Abstract
Background:
Medications that taste unpleasant can be a struggle to administer to children, most often resulting in low adherence rates. Pictograms can be useful tools to improve adherence by conveying information to patients in a way that they will understand.
Methods:
One-on-one structured interviews were conducted with parents/guardians and with children between the ages of 9 and 17 years at a pediatric hospital. The questionnaire evaluated the comprehension of 12 pictogram sets that described how to mask the taste of medications for children. Pictograms understood by >85% of participants were considered validated. Short-term recall was assessed by asking participants to recall the meaning of each pictogram set.
Results:
There were 51 participants in the study—26 (51%) were children aged 9 to 17 years and 25 (49%) were parents or guardians. Most children (54%) had health literacy levels of grade 10 or higher. Most parents and guardians (92%) had at least a high school health literacy level. Six of the 12 pictogram sets (50%) were validated. Eleven of 12 pictogram sets (92%) had a median translucency score greater than 5. All 12 pictogram sets (100%) were correctly identified at short-term recall and were therefore validated.
Conclusion:
The addition of validated illustrations to pharmaceutical labels can be useful to instruct on how to mask the taste of medication in certain populations. Further studies are needed to assess the clinical impact of providing illustrated information to populations with low health literacy.
Knowledge Into Practice.
Medications that taste bad can most often result in low adherence rates, especially with children.
Strategies exist to mask or alter the taste of a medication, but most parents or guardians are not aware of these tricks.
Most parents and guardians in Canada do not have a level of health literacy high enough to comprehend what is said or what they read about medication.
Pictograms can be a useful tool to improve comprehension and adherence by transmitting information to patients in a way they can understand.
An infographic on how to mask the taste of medication was validated in parents and can serve as an educational tool for parents and guardians, enhancing the communication between health care providers and patients.
Mise En Pratique Des Connaissances.
Les médicaments qui ont mauvais goût sont ceux qui entraînent le plus souvent des faibles taux d’observance, en particulier chez les enfants.
Il existe des stratégies pour masquer ou modifier le goût des produits, mais la plupart des parents ou tuteurs ne connaissent pas ces astuces.
Au Canada, la plupart des parents et tuteurs n’ont pas un niveau de littératie en matière de santé suffisamment élevé pour comprendre ce que l’on dit ou ce qu’ils lisent au sujet des médicaments.
Les pictogrammes peuvent être utiles pour améliorer la compréhension et l’observance en transmettant de l’information aux patients d’une manière qu’ils peuvent comprendre.
Un schéma infographique sur la manière de masquer le goût des médicaments a été validé auprès de parents et peut servir d’outil pédagogique pour les parents et tuteurs et améliorer la communication entre les fournisseurs de soins et les patients.
Background
Administering medication with poor palatability to children is a widespread challenge that can frustrate both parents and physicians.1 It has been shown that the taste and smell of medications are key determinants in a child’s willingness to comply with his or her prescribed therapy.2,3 More than 90% of physicians have reported that the drug’s palatability was the biggest challenge in successfully completing the child’s course of treatment.2,4 Over the years, there have been many strategies that were developed to mask the taste of medications, such as coating the taste buds with other foods prior to administering the medication, freezing the taste buds with a popsicle, or using strong flavours to mask the medication taste (Appendix 1 available at cph.sagepub.com/supplemental).3,5 However, there are still many parents/guardians who are unaware of the importance of taste in a child’s adherence to their medication regimen; a child’s poor adherence highlights the importance of providing counselling points and tips on how to mask the taste of medications.
According to the Canadian Council on Learning, 60% of the adult population lack the necessary skills to adequately manage their health,6 and 66% of individuals with a high school education or higher have limited health literacy.6,7 Health literacy skills have also been shown to be linked to overall general literacy skills7; individuals with low general literacy skills tend to have lower health literacy as well.7 Caregiver literacy skills also have an influence on a child’s health.7 There is increasing evidence that most child health information is too complex for caregivers to understand, particularly for those with limited health literacy skills.7 Based on findings from several agencies, the readability of patient education materials should not exceed the sixth to eighth grade.8,9
An effective way to disseminate complex information in a simplified manner is to use pictograms.10,11 It has been shown that the use of pictograms can improve a patient’s understanding of complex health instructions and improve their adherence10,11 if the pictograms are well designed and validated before their use.12 Pictograms can help individuals who have difficulty understanding instructions in a text format.13-16 Pictograms have also been developed and sometimes validated to communicate medication instructions; however, pictograms on how to specifically mask the taste of medications were not available.11,17-21 Educating patients and their families on how to mask the taste of medications can be facilitated with the use of pictograms and can potentially improve medication adherence in children. The purpose of this study is to evaluate and validate pictograms that depict various strategies to help mask the taste of medications for children.
Methods
Pictogram design
After reviewing the literature on how to mask the taste of medicines, the research team for this study determined 12 key counselling points.22,23 From this information, the team created an infographic/board game to teach patients how to make medications more palatable, depending on the form of the medication (capsule, liquid, or tablet).5 A graphic designer was given artistic freedom to create pictogram sets based on the previous board games and the 12 key counselling points. The pictogram sets were then redesigned and adjusted until they were approved by the research team for further validation (Appendix 2 available at cph.sagepub.com/supplemental).
Pictogram validation
This study was conducted using one-on-one semistructured interviews, and pictogram comprehension was assessed using the concepts of transparency, translucency, and recall. The interviews were conducted by 2 research assistants who were students in health sciences. Comprehension is defined as “the process of interpreting the meaning of words or pictures to understand their collective meaning,”24 while transparency is the “guessability” of the meaning of the pictogram when its meaning is unknown.13 Translucency is a measure of the strength of the relationship between a pictogram and its intended meaning.25 Finally, recall looks at the participant’s ability to remember the meaning of each pictogram after a brief distraction. To be validated according to the American National Standards Institute (ANSI), each pictogram must be understood by 85% of the population, and no more than 5% of the population can be critically confused.26
The set of 12 pictograms was shuffled before being shown to the participants to ensure randomness. To measure the transparency of the set of pictograms, the participants were informed that each pictogram set depicted a counselling point on how to mask the taste of medications, and they were then asked what they thought each set represented. Their answers were recorded verbatim and were later scored by 3 independent evaluators who were told the significance of each pictogram. If the responses received a different score from the evaluators, a discussion took place among the evaluators until a consensus was reached. The pictogram sets were scored as “correct,” “partially correct,” “incorrect,” or “critically confused.” If participants provided the meaning of the pictogram using the exact words as in our definition, the response was rated as “correct.” If the participant used different words or had only a few elements of the meaning but would still perform the proper action, the response was rated as “partially correct.” To assess the comprehension, both “correct” and “partially correct” are included. Following the transparency assessment, the participants were told the intended meaning of the pictogram sets and asked to rate, on a 7-point scale, the degree to which this intended meaning was accurately represented. A translucency score of 1 indicated that there was no relationship between the pictogram set and its intended meaning, whereas a translucency score of 7 showed a very strong relationship between these. A translucency score minimum of 5 was required for the pictogram set to demonstrate a “good” to “very strong” relationship between the pictogram set and its intended meaning.25 When the pictogram set was given a translucency score lower than 5, the participant was asked how to change certain elements to more accurately represent the intended meaning.
Before testing for recall, the participants required a distraction. The Rapid Estimate of Adult Literacy in Medicine (REALM) test is a list of medical words used to assess health literacy. Adult participants used the REALM list, and participants between the ages of 9 and 17 years used the Rapid Estimate of Adolescent Literacy in Medicine (REALM-TEEN) list. Each participant was categorized into a health literacy level based on their REALM test scores.27,28
Once the distraction was completed, the short-term recall of all 12 pictogram sets was assessed. The participants were asked to assess the meaning of each pictogram, their responses were recorded verbatim on a data-collecting sheet, and the responses were then scored once again by 3 independent evaluators.
Population and setting
Parents/guardians who spoke English or French, and children between the ages of 9 and 17 years, were recruited from the emergency department waiting rooms and waiting rooms from outpatient clinics at the Children’s Hospital of Eastern Ontario (CHEO) in Ottawa, Ontario. Patients were recruited Monday through Friday from 8 AM to 4 PM during the summer. This study received approval from the Research Ethics Board at the Children’s Hospital of Eastern Ontario, and written informed consent was granted from every subject.
Results
A total of 51 participants were interviewed. Twenty-six (51%) were between the ages of 9 and 17, and 25 (49%) were aged 18 and older, with only 1 being older than 60 years; demographic data are summarized in Table 1. According to the REALM-TEEN test, the majority of the participants between the ages of 9 and 17 years had a health literacy level of grade 10 or higher. Most of the participants aged 18 and older fell under the subcategory of “high school and higher” after taking the REALM test. There were 47 English-speaking participants (92%) and 4 French participants (8%).
Table 1.
Demographic data of study participants
| Participant age, years | ||
|---|---|---|
| 9-17 (n = 26) | 18 and older (n = 25) | |
| Male sex | 13 (25.5) | 6 (11.8) |
| Nationality | Canadian: 23 Lebanese: 1 Chinese: 2 |
Canadian: 20 Mexican: 1 Lebanese: 1 Chinese: 1 Sudanese: 1 Nepalese: 1 |
| Number of medications taken mean (SD) | 1.38 (1.94) | 0.44 (0.71) |
| Education level | REALM-TEEN | REALM |
| Grade 3 and below | 2 (7.7) | 1 (4) |
| Grade 4-5 | 4 (15.4) | |
| Grade 4-6 | 0 (0) | |
| Grade 6-7 | 4 (15.4) | |
| Grade 7-8 | 1 (4) | |
| Grade 8-9 | 2 (7.7) | |
| Grade 10 and higher | 14 (53.8) | |
| High school and higher | 23 (92) | |
Data presented as n (%). Shaded boxes represent no category in Rapid Estimate of Adult Literacy in Medicine (REALM) test score.
Transparency and translucency results
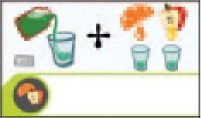
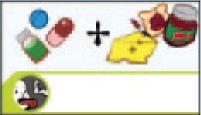
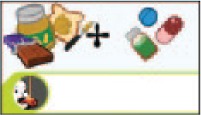
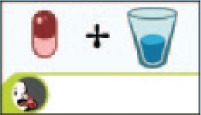
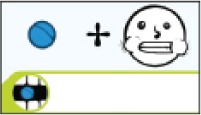
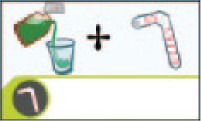
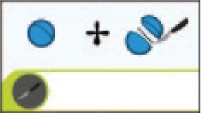
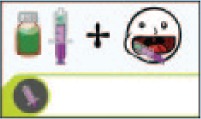
Initially, 6 of the 12 pictogram sets (50%) were validated to describe how to mask the taste of medications by achieving a transparency score >85%. The following pictogram sets were not understood by more than 85% of the participants: “pour the medication into a glass and mix with orange juice or apple juice,” “take the medication then eat something with a strong flavour like cheese or jam,” “eat something like chocolate or peanut butter to coat the tongue then take the medication,” “chew the tablet,” “cut the tablet in half with a knife and take both pieces,” and “use a syringe to inject the medication into the side of the cheek.” Following short-term recall, all 12 pictogram sets were validated. One pictogram set, “take the medication then eat something with a strong flavour like cheese or jam,” had a median translucency score of less than 5. The transparency and translucency results are presented in Table 2.
Table 2.
Pictogram transparency, translucency scores and recall
| Pictogram set | Transparency |
Recall |
Translucency |
||||
|---|---|---|---|---|---|---|---|
| C, n (%) | PC + C, n (%) | C, n (%) | PC + C, n (%) | Median score | Interquartile range | ||
| 1 |
|
36 (70.6) | 39 (76.5) | 51 (100) | 51 (100) | 6 | 1 |
| 2 |
|
11 (26.1) | 36 (70.6) | 48 (94.1) | 50 (98) | 4 | 3 |
| 3 |
|
10 (19.6) | 39 (76.5) | 45 (88.2) | 50 (98) | 5 | 2 |
| 4 |
|
43 (84.3) | 46 (90.2) | 51 (100) | 51 (100) | 7 | 0 |
| 5 |
|
33 (64.7) | 35 (68.6) | 47 (92.2) | 47 (92.2) | 7 | 3 |
| 6 |
|
47 (92.2) | 47 (92.2) | 50 (98) | 50 (98) | 7 | 1 |
| 7* |
|
39 (76.5) | 42 (82.4) | 45 (88.2) | 45 (88.2) | 7 | 1 |
| 8 |
|
12 (23.5) | 39 (76.5) | 39 (76.5) | 51 (100) | 6 | 2 |
| 9 |
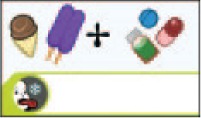
|
38 (74.5) | 45 (88.2) | 51 (100) | 51 (100) | 6 | 2 |
| 10 |
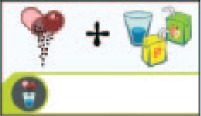
|
42 (82.4) | 50 (98) | 40 (78.4) | 44 (86.3) | 7 | 1 |
| 11 |
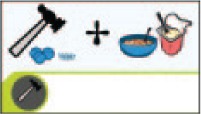
|
45 (88.2) | 48 (94.1) | 51 (100) | 51 (100) | 7 | 1 |
| 12 |
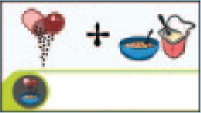
|
36 (70.6) | 48 (94.1) | 43 (84.3) | 48 (94.1) | 7 | 1 |
C = correct; PC = partially correct.
The “guessability” of the “cut the tablet in half with a knife and take both pieces” pictogram set had 1 response scored as critically confused. The participant thought the pictogram set depicted cutting the medication in half and taking only one-half of the tablet.
Bold results represent transparency scores that reached the ANSI standard for comprehension.
There were significant differences between the transparency scores of children and adults and between those of males and females. The transparency scores among adults were found to be higher than those of children for pictogram set 7 (p = 0.012). In addition, females had a higher transparency score than males for the same pictogram set (p = 0.044), and female children scored higher than male children for pictogram set 1 (p = 0.027). There were no significant differences between the transparency scores of adult males and adult females.
Adults also showed a higher translucency score for pictogram set 10 when compared with children (p = 0.003). Females had a better level of comprehension over males for pictogram set 9 (p = 0.045). In addition, female children had a higher average translucency for pictogram set 7 than male children (p = 0.011).
There were no significant differences between the transparency, translucency scores or recall of English and French participants. There were also no significant differences in the recall of any demographic group.
Discussion
The use of pictures in health care is a relatively new concept that is becoming more common in practice. Pictograms and their role in children’s health care is an area that needs to be further researched. This is the first study designed to validate a set of pictograms used to teach children and their caregivers how to mask the taste of medications. These pictograms will serve as an adjunct during the counselling process to further enhance the effectiveness of transmitting information from the health care provider to the patient.
One of the biggest challenges of using pictograms in practice is ensuring that they will be effective for the target population. The pictograms must be verified for effectiveness by testing the comprehensibility of the pictogram sets at all stages, including evaluation and implementation.
The results of the comprehension assessment validated 6 of 12 of the pictogram sets tested, according to the ANSI standards. For pictogram sets depicting 2 concepts, some participants were able to correctly identify one of the concepts but not the other. In response to pictogram set 8, “use a syringe to inject the medication into the side of the cheek,” the participants understood the implication of taking the medication using a syringe. However, they did not correctly identify where to inject the medication to improve the palatability. Pictogram set 2, “take the medication then eat something with a strong flavour like cheese or jam,” was not validated at “guessability” testing because many participants thought the medication was supposed to be taken with food, specifically healthy foods or a sandwich; the participants did not specify that the food needed a strong flavour to mask the taste of the medication. Similarly, with pictogram set 3, “eat something like chocolate or peanut butter to coat the tongue then take the medication,” participants were not able to identify the purpose of eating chocolate or peanut butter. Instead, participants said that the medication could be taken with food or candy. Pictogram set 1 depicted pouring and mixing the medication into orange juice or apple juice, but many participants did not identify the fruit juice and thought the pictogram set meant to take the medication with fruits. Although only 6 pictogram sets were validated according to the ANSI standards, all 12 pictogram sets could be considered valid based on the International Organization for Standards (ISO) standard. According to the ISO 3864 standard, pictograms could be validated if they received a comprehensibility score of at least 67.5%.29
Following short-term recall, all 12 of the pictogram sets were validated; this suggests that pictograms are more effective if they are accompanied with verbal instructions to the patient. There is a possibility of detrimental outcomes when the pictogram is left unaccompanied without any explanation, since this leaves room for misinterpretation. The International Pharmaceutical Federation guidelines on drug labelling suggest that graphic symbols should always be accompanied with text.30 Therefore, the most effective approach, in practice, is to combine written and visual aids to make the counselling effective. However, during the initial transparency testing, no more than 5% of participants were “critically confused” by any pictogram set.
Pictogram set 7, in particular, “cut the tablet in half with a knife and take both pieces,” raised a few concerns during the evaluation process. This pictogram set depicted cutting the tablet in half and swallowing each small piece separately to minimize exposure to the unfavourable taste. Some participants misinterpreted the pictogram sets, thinking it meant to take half the tablet instead of the full dose. The misinterpretation was labelled as “critically confused,” because it could potentially harm the patient. However, the pictogram set did not meet the cutoff of 5% and is therefore deemed safe for implementation in practice. Although it has been validated, the pictogram set will be redesigned to better align itself with the intended meaning to minimize potential hazards.
Overall, it was noted that adults had significantly higher transparency and translucency scores than children. This finding is consistent with similar studies that found a correlation between picture comprehension and overall knowledge.21 It was also found that adults had higher literacy rate competencies than younger participants in the study; those with higher literacy rates were able to achieve higher transparency and translucency scores. Girls between the ages of 9 and 17 years also had higher transparency and translucency scores compared with males. This finding can be attributed to findings in previous studies stating that girls achieve earlier psychological development than males and have higher literacy scores overall.21
Study limitations
This study was limited by the sample size used, a homogenous population and by having 2 research assistants conduct the counselling. The research assistants were provided with the real significance of each pictogram, and there were sometimes further explanations provided to the participants by the research assistants, which could have affected the recall. In addition, the majority of the adults in the study fell into the highest health literacy category, with only 2 adults falling short of this. We have previously shown that the population treated at the CHEO location is generally highly literate.21 Therefore, the study cannot be extrapolated to assess its effectiveness in low-literacy populations. The majority of the population of this study was Canadian and made up of individuals who took fewer than 3 medications daily as part of their therapy regimen. Additional research should be done into the comprehensibility of the pictograms among foreign patients and those patients who are required to take more than 3 medications daily. Involving 2 different research assistants may have limited the study if each had a different explanation for the pictogram meanings; this would elicit varying responses in the short-term recall responses, and there may also have been a discrepancy in the results recorded by the 3 research assistants. In the future, this limitation could be avoided by training both assistants to use the same protocols when conducting the assessments.
Conclusion
The study successfully evaluated and validated 12 pictogram sets that will help children and their caregivers mask the taste of medications. After being taught the intended meaning, all pictogram sets were validated through short-term recall. A future study could validate the use of these pictogram sets in a low-health literacy population. ■
Footnotes
Author Contributions:R. Vaillancourt initiated and supervised the project. Y. Truong was in charge of data analysis and drafted the report. S. Karmali, A. Kraft and S. Manji were in charge of data collection and data analysis and drafted the report. G. Villarreal was in charge of the design, the methodology, the data collection, the results review and the supervision of the ensemble of the project. A. Pouliot was in charge of the design, the methodology, the data collection, the results review and the supervision of the project.
Declaration of Conflicting Interests:The authors declared no potential conflicts of interest with respect to the research, authorship and/or publication of this article.
Funding:The authors received no financial support for the research, authorship and/or publication of this article.
References
- 1. Gee SC, Hagemann TM. Palatability of liquid anti-infectives: clinician and student perceptions and practice outcomes. J Pediatr Pharmacol Ther 2007;12(4):216-23. [DOI] [PMC free article] [PubMed] [Google Scholar]
- 2. Mennella JA, Spector AC, Reed DR, Coldwell SE. The bad taste of medicines: overview of basic research on bitter taste. Clin Ther 2013;35(8):1225-46. [DOI] [PMC free article] [PubMed] [Google Scholar]
- 3. Baguley D, Lim E, Bevan A, Pallet A, Faust SN. Prescribing for children—taste and palatability affect adherence to antibiotics: a review. Arch Dis Child 2011;97(3):293-7. [DOI] [PubMed] [Google Scholar]
- 4. Milne C-P, Bruss JB. The economics of pediatric formulation development for off-patent drugs. Clin Ther 2008;30(11):2133-45. [DOI] [PubMed] [Google Scholar]
- 5. Children’s Hospital of Eastern Ontario. Helping medication taste better! Available: www.cheo.on.ca/en/medication-taste-better (accessed Aug. 18, 2016).
- 6. Canadian Council on Learning. Health literacy in Canada: a healthy understanding. Ottawa (ON): Canadian Council on Learning; 2008. Available: www.bth.se/hal/halsoteknik.nsf/bilagor/HealthLiteracyReportFeb2008E_pdf/$file/HealthLiteracyReportFeb2008E.pdf (accessed Aug. 18, 2016). [Google Scholar]
- 7. Kutner M, Greenberg E, Jin Y, Paulsen C. The health literacy of America’s adults: results from the 2003. national assessment of adult literacy. 2006. U.S. Department of Education. Washington (DC): National Center for Education Statistics; Available: https://nces.ed.gov/pubs2006/2006483.pdf (accessed Aug. 24, 2016). [Google Scholar]
- 8. Centers for Disease Control and Prevention. Simply put: A guide for creating easy-to-understand materials. Available: https://www.cdc.gov/healthliteracy/pdf/Simply_Put.pdf (accessed Aug. 18, 2016).
- 9. Nielsen-Bohlman L, Panzer AM, Kindig DA. Health literacy: a prescription to end confusion. Washington (DC): Institute of Medicine, National Academies; Press; 2004. [PubMed] [Google Scholar]
- 10. Dowse R, Ehlers M. Medicine labels incorporating pictograms: do they influence understanding and adherence? Patient Educ Couns 2005;58(1):63-70. [DOI] [PubMed] [Google Scholar]
- 11. Kassam R, Vaillancourt R, Collins JB. Pictographic instructions for medications: do different cultures interpret them accurately? Int J Pharm Pract 2004;12(4):199-209. Available: http://doi.wiley.com/10.1211/0022357044698 (accessed Aug. 18, 2016). [Google Scholar]
- 12. Montagne M. Pharmaceutical pictograms: a model for development and testing for comprehension and utility. Res Soc Adm Pharm 2013;9(5):609-20. [DOI] [PubMed] [Google Scholar]
- 13. Katz MG, Kripalani S, Weiss BD. Use of pictorial aids in medication instructions: a review of the literature. Am J Health Syst Pharm 2006;63(23):2391-7. [DOI] [PubMed] [Google Scholar]
- 14. Houts PS, Doak CC, Doak LG, Loscalzo MJ. The role of pictures in improving health communication: a review of research on attention, comprehension, recall, and adherence. Patient Educ Couns 2006;61(2):173-90. Available: www.ncbi.nlm.nih.gov/pubmed/16122896 (accessed Jul. 17, 2016). [DOI] [PubMed] [Google Scholar]
- 15. Roberts NJ, Mohamed Z, Wong P-S, et al. The development and comprehensibility of a pictorial asthma action plan. Patient Educ Couns 2009;74(1):12-8. Available: www.sciencedirect.com/science/article/pii/S0738399108003972 (accessed May 14, 2015). [DOI] [PubMed] [Google Scholar]
- 16. Hämeen-Anttila K, Kemppainen K, Enlund H, et al. Do pictograms improve children’s understanding of medicine leaflet information? Patient Educ Couns 2004;55(3):371-8. Available: http://linkinghub.elsevier.com/retrieve/pii/S0738399104002824 (accessed Aug. 18, 2016). [DOI] [PubMed] [Google Scholar]
- 17. International Pharmaceutical Federation (FIP). Pictogram software. Available: www.fip.org/pictograms (accessed Jun. 26, 2015).
- 18. Sorfleet C, Vaillancourt R, Groves S, Dawson J. Design, development and evaluation of pictographic instructions for medications used during humanitarian missions. Can Pharm 2009;142(2):82-8. Available: http://cph.sagepub.com/content/142/2/82.short (accessed Aug. 18, 2016). [Google Scholar]
- 19. Cloutier M, Vaillancourt R, Pynn D, et al. Design and development of culture-specific pictograms for type 2 diabetes mellitus education and counselling. Can J Diabetes 2014;38:379-92. [DOI] [PubMed] [Google Scholar]
- 20. Richler M, Vaillancourt R. The use of pictograms to convey health information regarding side effects and/or indications of medications. J Commun Healthc 2012;5(4). Available: www.maneyonline.com/doi/abs/10.1179/1753807612Y.0000000012 (accessed Aug. 18, 2016). [Google Scholar]
- 21. Revol M, Vaillancourt R, Pouliot A. Evaluation, validation, and modification of pictograms depicting potential side effects to medication. J Commun Healthc 2013;6(2):79-89. Available: www.maneyonline.com/doi/abs/10.1179/1753807613Y.0000000032 (accessed Aug. 18, 2016). [Google Scholar]
- 22. Mennella JA, Beauchamp GK. Optimizing oral medications for children. Clin Ther 2008;30(11):2120-32. [DOI] [PMC free article] [PubMed] [Google Scholar]
- 23. Sohi H, Sultana Y, Khar RK. Taste masking technologies in oral pharmaceuticals: recent developments and approaches. Drug Dev Ind Pharm 2004;30(5):429-48. [DOI] [PubMed] [Google Scholar]
- 24. Houts PS, Witmer JT, Egeth HE, et al. Using pictographs to enhance recall of spoken medical instructions. Patient Educ Couns 2001;43(3):231-42. [DOI] [PubMed] [Google Scholar]
- 25. Kripalani S, Robertson R, Love-Ghaffari MH, et al. Development of an illustrated medication schedule as a low-literacy patient education tool. Patient Educ Couns 2007;66(3):368-77. Available: www.sciencedirect.com/science/article/pii/S0738399107000419 (accessed Aug. 18, 2016). [DOI] [PubMed] [Google Scholar]
- 26. National Electrical Manufacturers Association. American national standard criteria for safety symbols. September 2011. Available: https://www.nema.org/Standards/ComplimentaryDocuments/Z535-3-Contents-and-Scope2-2.pdf (accessed Aug. 24, 2016).
- 27. Davis TC, Wolf MS, Arnold CL, et al. Development and validation of the Rapid Estimate of Adolescent Literacy in Medicine (REALM-Teen): a tool to screen adolescents for below-grade reading in health care settings. Pediatrics 2006;118(6):e1707-14. Available: www.ncbi.nlm.nih.gov/pubmed/17142495 (accessed Jan. 5, 2015). [DOI] [PubMed] [Google Scholar]
- 28. Davis TC, Michielutte R, Askov EN, et al. Practical assessment of adult literacy in health care. Health Educ Behav 1998;25(5):613-24. [DOI] [PubMed] [Google Scholar]
- 29. International Standards Organization (ISO). International standards for safety colours and safety signs. ISO 3864 2011. [Google Scholar]
- 30. International Pharmaceutical Federation. FIP guidelines for the labels of prescribed medicines. 2001. Available: www.fip.org/www/uploads/database_file.php?id=256&table_id= (accessed Aug. 18, 2016).


