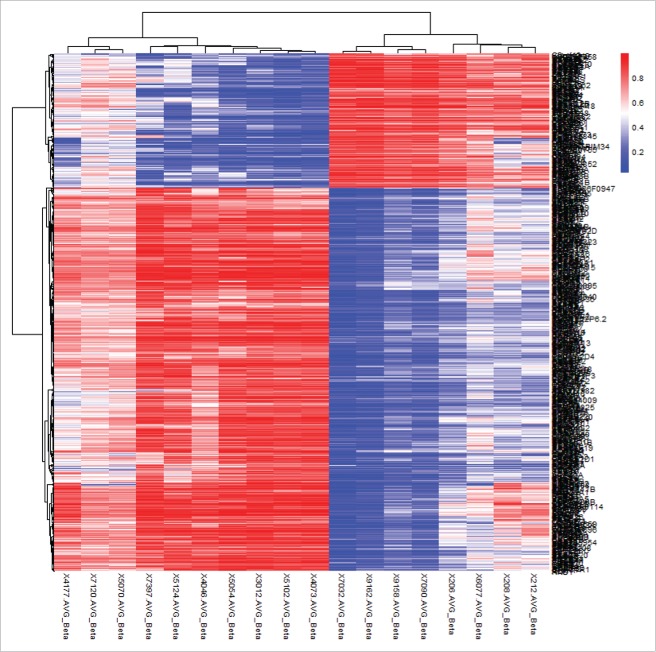
Figure 1.
Hierarchical cluster analysis of the top 500 significantly differentially methylated CpG sites in neural tissues of NTD cases and controls of Population 1. Rows represent probes and columns represent samples. Cells are colored according to level of methylation (blue = low methylation, red = high methylation). The top 500 significant CpG sites can clearly distinguish lesion tissues from normal neural tissues.

