Abstract
To elucidate metabolism of ascorbic acid (AsA) in sweet cherry fruit (Prunus avium ‘Hongdeng’), we quantified AsA concentration, cloned sequences involved in AsA metabolism and investigated their mRNA expression levels, and determined the activity levels of selected enzymes during fruit development and maturation. We found that AsA concentration was highest at the petal-fall period (0 days after anthesis) and decreased progressively during ripening, but with a slight increase at maturity. AsA did nevertheless continue to accumulate over time because of the increase in fruit fresh weight. Full-length cDNAs of 10 genes involved in the L-galactose pathway of AsA biosynthesis and 10 involved in recycling were obtained. Gene expression patterns of GDP-L-galactose phosphorylase (GGP2), L-galactono-1, 4-lactone dehydrogenase (GalLDH), ascorbate peroxidase (APX3), ascorbate oxidase (AO2), glutathione reductase (GR1), and dehydroascorbate reductase (DHAR1) were in accordance with the AsA concentration pattern during fruit development, indicating that genes involved in ascorbic acid biosynthesis, degradation, and recycling worked in concert to regulate ascorbic acid accumulation in sweet cherry fruit.
Introduction
Ascorbic acid (AsA) has several essential functions in plant physiology. AsA is the most abundant water-soluble antioxidant in higher plants, participates in the detoxification of reactive oxygen species, and has an important role in promoting resistance to senescence [1] and numerous environmental stresses, such as ozone [2, 3], dehydration stress [4, 5], high light [6] and salt stress [7]. Also, AsA operates as a cofactor and take part in the regulation of some fundamental cellular processes (e.g. photoprotection, the cell cycle and cell expansion) and biosynthesis of important plant hormones (e.g. including ethylene, jasmonic acid, salicylic acid, abscissic acid gibberellic acid) [8, 9]. Moreover, fruit and vegetables are a primary source of dietary intake of vitamin C for humans, because primates and some other animals lack the ability to synthesize AsA [10].
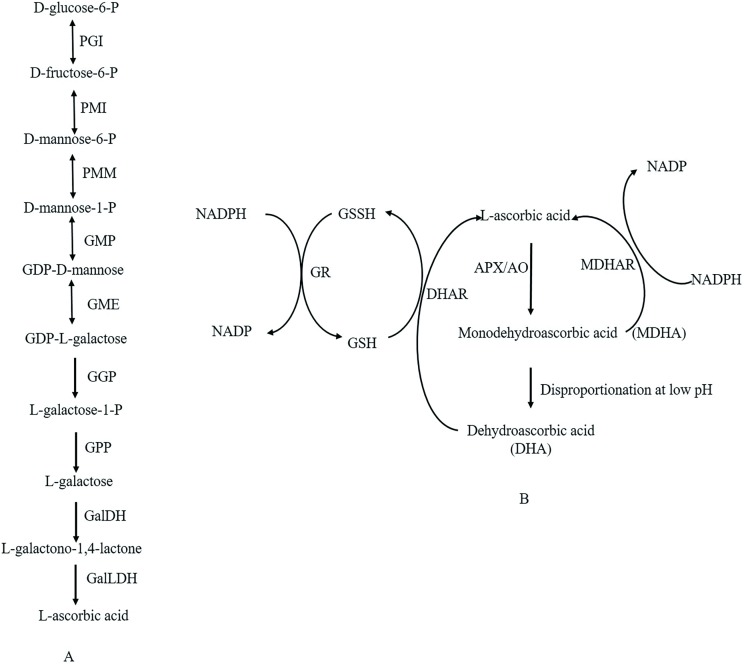
Because of these unique functions, as well as its benefits to human health, mounting attention has been paid to AsA metabolism and regulation in plant tissues. De novo biosynthesis is believed to be the main reason for its accumulation in plant. At least four AsA synthesis pathways have been proposed in plants according to the molecules acting as precursors: L-galactose [11], L-glucose [12], D-galacturonic acid [13] and myo-inositol pathways [14]. Among them, the L-galactose pathway has been deemed to be the main route for AsA accumulation in different species [15, 16], and all structural genes from this pathway have been obtained in various species [17–20]. Briefly, the L-galactose pathway consists of a series of successive reactions (Fig 1A): starting from D-glucose-6P, then D-mannose-1-phosphate, guanosine diphosphate-D-mannose (GDP-D-mannose), GDP-L-galactose, L-galactose and L-galactone-1,4-lactone, which are intermediates to the formation of AsA [19, 20].
Fig 1.
L-ascorbic acid biosynthesis by the L-galactose pathway (A) and the ascorbate-glutathione cycle (B) in plants. The enzymes catalyzing the reactions are as follows: glucose-6-phosphate isomerase (GPI), mannose-6-phosphate isomerase (PMI), phosphomannomutase (PMM), GDP-mannose pyrophosphorylase (GMP), GDP-mannose-3′,5′-epimerase (GME), GDP-L-galactose phosphorylase (GGP), L-galactose-1-phosphate phosphatase (GPP), L-galactose dehydrogenase (GalDH), L-galactono-1,4-lactone dehydrogenase (GalLDH), ascorbate peroxidase (APX), monodehydroascorbate reductase (MDHAR), dehydroascorbate reductase (DHAR), ascorbate oxidase (AO), and glutathione reductase (GR).
The AsA levels in plants are maintained by an efficient balance among biosynthesis, oxidation and recycling, known as the AsA–GSH cycle [9] (Fig 1B). The first step of the pathway is the detoxification of reactive oxygen species by ascorbate peroxidase (APX) and ascorbate oxidase (AO) catalyzed peroxidation of AsA which generates monodehydroascorbate (MDHA). MDHA is either reduced back to AsA by monodehydroascorbate reductase (MDHAR) or it undergoes non-enzymatic disproportionation to AsA and dehydroascorbate (DHA). The DHA molecules are reduced to AsA by dehydroascorbate reductase (DHAR) using GSH as the reductant. GSH is regenerated from the oxidized glutathione dimmers (GSSG) by NADPH-dependent Glutathione oxidoreductase (GR).
Sweet cherry (Prunus avium L.) is one of the popular and economically-valuable fruit cultivated in temperate regions of the world and is recognized for its nutraceutical properties and antioxidant activity. Although transcriptional regulation of AsA biosynthesis has been studied extensively in several horticultural crops, such as peach [21], kiwifruit [17], apple [18], strawberry [22], chestnut [20] and Chinese jujube [23], little is known about AsA metabolism in sweet cherry. To gain new insight into that process in sweet cherry fruit, we identified a complete and continuous set of sequences involved in the L-galactose pathway from sweet cherry fruit. Moreover, we systematically investigated the accumulation of AsA, mRNA expression of genes and key enzyme activity involved in its biosynthesis as well as recycling during fruit development. Our objective was to provide useful information to improve AsA concentration in sweet cherry fruit and to explore the mechanisms that regulate AsA accumulation in cells.
Materials and methods
Plant materials
Eight-year-old cherry (P. avium ‘Hongdeng’) trees were grown at a 3m × 4m spacing in an orchard in Hanyuan County, Sichuan Province, China (29.51°N, 102.62°E). There were no specific permissions required for local activities in experimental field, and the field studies did not involve endangered or protected species. Fruit was harvested at 10 ± 1d intervals following anthesis. The day on which the petals had just dropped off was designated as 0 days after anthesis (DAA). Fruit were immediately frozen in liquid nitrogen and stored at −80°C. On each collection date, at least fifteen fruits were harvested from each of five trees, and each three fruits represented one of five replications. At least 15 young, mature and old leaves were collected respectively.
Assays for AsA
Frozen tissue (2.0g) was added to extract AsA and determined essentially as described in [20, 23] by a high-performance liquid chromatography (HPLC). To determine the total AsA (T-AsA) level, the method described by [17, 18] was used. Dehydroascorbic acid (DHA) content was evaluated as the difference between total and reduced AsA levels.
HPLC was carried out using Agilent 1260 with a VWD detector, SB-Zobax C18 column (150×4.6mm, 5μm). The mobile phase was composed of 15% methanol and 85% metaphosphoric acid aqueous solution, pH 2.5. The flux was set to 1ml/min and the injection volume was 10μl. The temperature of the column was set at 35°C; the detection wavelength was set at 243nm.
Cloning of cDNAs encoding enzymes involved in AsA biosynthesis and recycling
Standard primers for gene cloning were designed according to the unigene sequence obtained from our transcriptome data (unpublished) and BLAST searching in the GenBank Prunus EST results (Table 1).
Table 1. Standard primers used for gene cloning.
| Gene | Forward primer (5′-3′) | Reverse primer (5′-3′) |
|---|---|---|
| GPI | GGCACATACATGGTGTGAGG | TCCTAAATGCCGGAACATAA |
| PMI | TGAAGCACCACAATCAAAGG | TGCTTGCACTAAAGCCAAGA |
| PMM | CCATTTCGGAGCTCTCATTC | CCGAAACCAAAAAGTTGGAA |
| GMP | GGAAAGCAAAGGGCATATCA | CAGCCTGAATCCAGAGAAGC |
| GME | GCCTTGTTTCCTTTGCTCTG | CTGAGCAATGCTTCAGATGG |
| GGP1 | TCCCTCCGATCTTACCTTCC | TTGCTGAGCGTCTATTTCCA |
| GGP2 | CATCACGGCTATACACGGAG | ATAAACCCAAATGGCAAACT |
| GPP | CCGCATTTCCTTCTCTCATC | AGCTTCGAGCAAGATTACCG |
| GalDH | ATATTTTTCGCTTCACTTCC | ATTTTATTGATTCATCTCCA |
| GalLDH | AAAGAGGGAAGGAGGAGCAG | TGAAGCCAAAATGCATTCAA |
| APX1 | TCCTTCCCTCCAAACAACAC | CACACATAGGCAACCAATGC |
| APX2 | CTACCCAAACAGAGGGTGGA | AGCCATCGCTGCCTTATTTA |
| APX3 | AATGGCGTTCTCCTTCCTTT | AGCTATCCGTGGGTCAAACA |
| AO1 | TGTCTCTTTCTGTAACCTTC | TTCTTTCTTTTTCCTCTCTC |
| AO2 | TTTTAACTTGTTGTAGTTTG | ATAGTTGAATGGTATGAGAT |
| DHAR1 | CTGGCACTCTTCCTCACTTC | CTTCCTTTTTTTGGCTATCT |
| DHAR2 | ACACCGACCAATGCGTTAAT | TCCACATCTGACATGCACAC |
| GR1 | TCATGGCCACCTCTCTCTCT | CATGCTCTGCAGAACCTCAA |
| GR2 | GCTTCGCCATCTTCAACTTC | CGTCCTATTGCTTGCATCCT |
| MDHAR | GCCAGCCACTGTCCTTAAAC | TGCAAAGGAGACAGCTTCAA |
Total RNA was extracted from samples by the modified CTAB method [24], and then reverse-transcription PCR was used to amplify whole cDNA sequences for every gene. The obtained fragments were cloned into pMD19-T vector (Takara) and unique clones of positive transformants were sequenced. Homology comparison was performed using the BLAST program in NCBI (http://www.ncbi.nlm.nih.gov).
mRNA expression analyses
Total RNA was extracted from samples by the modified CTAB method [24], and DNase was used to clean DNA before reverse-transcription reaction. Gene-specific primers were designed from the sequences that we had cloned using Primer3 online software (Table 2).
Table 2. Standard primers used for mRNA expression.
| Gene | Forward primer (5′-3′) | Reverse primer (5′-3′) |
|---|---|---|
| GPI | TTGACAATACCGATCCAGCA | GTTATCGCGACACCCTGTTT |
| PMI | TTCAAAAATGGGGCTCTGAC | CCTTATCTGGGTGTGCCTGT |
| PMM | GTTCCGAAGTGGGATGCTTA | TTCTCGCGAAGGATGGATAC |
| GMP | TGGCATCAAGATCACATGCT | AGCTTCTCCTCCATGGGATT |
| GME | GCTTCATCCAGTCCAACCAT | GGCATCAGACTCCTTCAAGC |
| GGP1 | TTCTAGCGCAGTGGGAAGAT | TTTTGTTCTTGCCCAGCTTT |
| GGP2 | GCCTGTGAAACCAAGGTGAT | GCCCAACTTTGGTGAGGTTA |
| GPP | GTACGTGGAGGAGGTGCATT | AGCCACTCATGCGAAGAGAT |
| GalDH | CCAGCATCTGCTGAATTGAA | CAGCAGCAATGTTCTCCTCA |
| GalLDH | ACTCCTTCCCTTTCCCTGAA | TTTTCTTCTCATGGGCATCC |
| APX1 | GAGCCAAATTTGATCCTCCA | CTTATCTGGGCTTCCACCAA |
| APX2 | CGGATCATTTGAGGGATGTC | ACGTTCCTTGTGGCACCTAC |
| APX3 | AATGGCGTTCTCCTTCCTTT | GTGGCACCAACACATTTGAG |
| AO1 | TGGTGGGGTTTTTAAAGCTG | ATCCATTCCAACAACCCAAA |
| AO2 | TCCAGAATTGGGAAGACACC | ACATTGTCCAGTGCCACGTA |
| DHAR1 | ATGGGAAGGAGGTTTCTGCT | TGGAAGGGAATCTGGAACTG |
| DHAR2 | ATGGGTCAGAACAGGCTTTG | ATCTGCGGCAGTGATCTTCT |
| GR1 | GAAAGCTGGCTTGACAAAGG | CAACCACGATCAAACACCAG |
| GR2 | CCATAGGCGTGGAACTTGAT | CCTCCATTAAAGCCACAGGA |
| MDHAR | CAAGCTCAACACCGCTTACA | ATTGATGGAATGCTCGGAAG |
| TEF2 | GGTGTGACGATGAAGAGTGATG | TGAAGGAGAGGGAAGGTGAAAG |
| ACT | CTTGCATCCCTCAGCACCTT | TCCTGTGGACAATGGATGGA |
Expression of the genes involved in AsA biosynthesis and recycling was evaluated by quantitative reverse transcription PCR (qRT-PCR). qRT-PCR was performed with a PrimeScript™ RT Reagent Kit with gDNA Eraser (Perfect Real Time) (Takara) and a SYBR Premix Ex Taq kit (Takara). The amplified PCR products were quantified by a CFX96 Touch™ Real-Time PCR Detection Systems (Bio-Rad). qRT-PCR experiments were done with four technical replications. All data were analyzed by the 2-△△CT method, with CFX Manager™ Software. Translation elongation factor 2 (TEF2) and Actin 7 /actin 2 (ACT) were used as reference genes for the relative quantification of PCR products (Table 1). The expression of these reference genes has been shown to be stable during cherry fruit development [25].
Assays of GalLDH and GalDH activities
GalLDH (EC 1.3.2.3) and GalDH (EC 1.1.1.117) enzyme activity were prepared and detected according to the method of [17, 20]. The GalLDH activity was determined by cytochrome c was reduced. One unit of activity was defined as the reduction of 1mmol of cytochrome c per minute. Activity of GalDH was calculated in terms of mmol of NAD+ reduced per minute.
Assays of APX, GR, DHAR, and MDHAR activities
For extraction of enzyme solution, samples were homogenized with 8ml of 50mM potassium phosphate buffer (pH 7.5) containing 1mM EDTA, 1mM DTT, 0.3% (v/v) Triton X-100, 2% (w/v) PVP and 2% (w/v) mercaptoethanol. The homogenates were centrifuged at 16,000g for 20min at 4°C and the supernatants were collected for enzyme assays.
APX (EC 1.11.1.11) activity was assayed by measuring the decrease in AsA concentration at 290nm according to Nakano and Asada [26] with slight modifications. GR (EC 1.6.4.2) activity was calculated by measuring the decrease in absorbance at 340nm due to oxidation of NADPH as described by Ma and Cheng [27]. DHAR (EC 1.8.5.1) and MDHAR (EC 1.6.5.4) activities were assayed using the method of Ma and Cheng [27]. DHAR activity was expressed as μmol of DHA reduced per minute. MDHAR activity was calculated in terms of mmol of NADH oxidized per minute.
Statistical analysis
ANOVA was performed using SPSS software (SPSS Inc., Chicago, IL, USA). Each treatment was replicated five times. Results were represented as the means ± standard deviation (SD). Significant differences were detected using Duncan's test at P<0.05 level.
Results
Changes in AsA levels during cherry fruit development
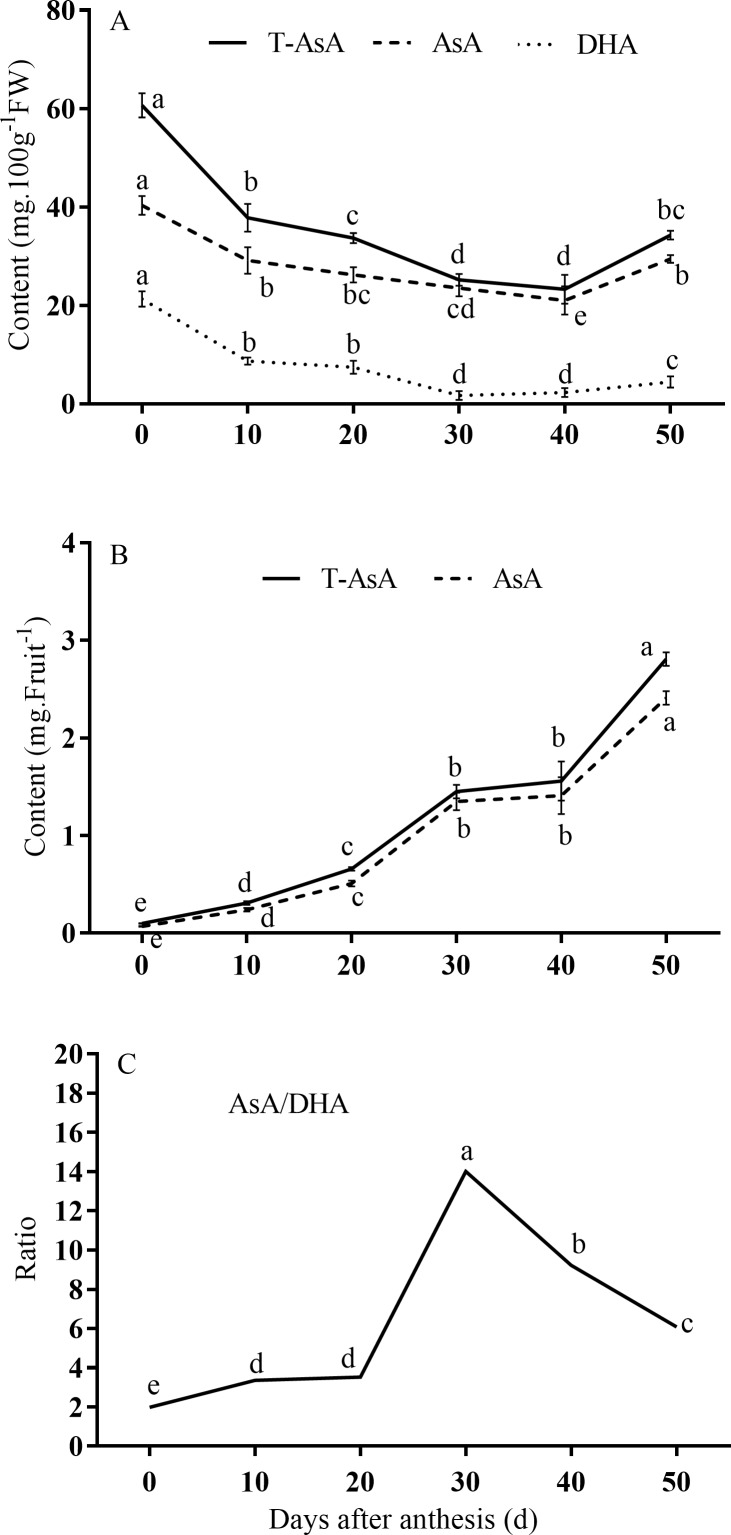
T-AsA and AsA levels for ‘Hongdeng’ cherry were monitored from the young fruit stage (0 DAA) up to maturity. Based on unit fresh weights, fruits at 0 DAA had the highest concentrations of T-AsA, DHA, and AsA, but these levels decreased clearly until 40 DAA, and then increased slightly to 50 DAA (Fig 2A, S1 Appendix). However, T-AsA and AsA accumulation per fruit generally increased throughout. Content levels of T-AsA and AsA were lowest at 0 DAA and then increased rapidly to 30 DAA before a relatively stable period (30–40 DAA), and then increased again from 40–50 DAA (Fig 2B, S1 Appendix). Reduced AsA concentration was lower than that of oxidized AsA during whole fruit ripening process. The AsA/DHA ratio remained at a lower level from 0–20 DAA, increased rapidly from 20–40 DAA, and then dramatically decreased from 40–50 DAA (Fig 2C, S1 Appendix).
Fig 2. Changes in ascorbic acid (AsA) accumulation levels during fruit development.
(A) Total AsA (T-AsA), AsA, and dehydroascorbate (DHA) concentrations based on fresh weight of fruit; (B) T-AsA and AsA content per fruit; (C) AsA/DHA ratio. T-AsA and AsA content per fruit was obtained by multiplying average fruit weight by concentration based on fresh weight.
cDNA isolation of genes involved in AsA biosynthesis and recycling in cherry fruit
Since there were no sequences involved in AsA metabolism of sweet cheery available in GenBank, we cloned sequences involved in AsA synthesis and recycling based on unigene sequences from a transcriptome database we had sequenced. The cDNA sequences of a total of 20 genes were identified; ten of them encoded proteins that belonged to the L-galactose pathway of AsA synthesis (PacGPI, PacPMI, PacPMM, PacGMP, PacGME, PacGGP1, PacGGP2, PacGPP, PacGalDH, and PacGalLDH), and the other ten genes encoded enzymes that were involved in the AsA-GSH cycle (PacAO1, PacAO2, PacAPX1, PacAPX2, PacAPX3, PacDHAR1, PacDHAR2, PacMDHAR, PacGR1, and PacGR2). The cDNAs for all these genes contained the entire protein-encoding regions. NCBI homology searches for these cloned sequences showed high degrees of similarity to the expected biosynthetic enzymes in Prunus mume, Prunus persica, and Pyrus × bretschneideri (Table 3). We concluded that the cloned sequences were cherry orthologs that encoded AsA biosynthetic and recycling enzymes and could therefore be used for mRNA expression analyses.
Table 3. Genbank homology search results for cloned sequences in this study.
| Accession No. in Genbank | Gene | ORF (bp) | Top hit ortholog | |||
|---|---|---|---|---|---|---|
| Accession No. | Organism | Annotation | Identities | |||
| KX196283 | GPI | 1707 | XM_009366209.1 | Pyrus × bretschneideri | glucose-6-phosphate isomerase | 92% |
| KX196284 | PMI | 1323 | XM_008246293.1 | Prunus mume | mannose-6-phosphate isomerase | 98% |
| KX196285 | PMM | 744 | KC339527.1 | Prunus persica | phosphomannose mutase | 98% |
| KX196286 | GMP | 1086 | AB457581.1 | Prunus persica | GDP-D-mannose pyrophosphorylase | 99% |
| KX196287 | GME | 1131 | AB457582.1 | Prunus persica | GDP-D-mannose-3′,5′-epimerase | 98% |
| KX196288 | GGP1 | 1107 | XM_008227382.1 | Prunus mume | GDP-L-galactose phosphorylase | 98% |
| KX196289 | GGP2 | 1341 | XM_008228760.1 | Prunus mume | GDP-L-galactose phosphorylase | 98% |
| KX196290 | GPP | 813 | AB457584.1 | Prunus persica | L-galactose-1-phosphate phosphatase | 99% |
| KX196291 | GalDH | 975 | AB457585.1 | Prunus persica | L-galactose dehydrogenase | 97% |
| KX196292 | GalLDH | 1791 | XM_008242509.1 | Prunus mume | L-galactono-1,4-lactone dehydrogenase | 98% |
| KX196297 | APX1 | 1363 | XM_008221397.1 | Prunus mume | L-ascorbate peroxidase | 97% |
| KX196298 | APX2 | 753 | XM_008240917.1 | Prunus mume | L-ascorbate peroxidase | 98% |
| KX196293 | APX3 | 1050 | XM_008221119.1 | Prunus mume | L-ascorbate peroxidase | 97% |
| KX196295 | AO1 | 1611 | XM_008237876.1 | Prunus mume | L-ascorbate oxidase | 98% |
| KX196296 | AO2 | 1632 | XM_008226470.1 | Prunus mume | L-ascorbate oxidase | 100% |
| KX196299 | DHAR1 | 801 | XM_008230975.1 | Prunus mume | dehydroascorbate reductase | 98% |
| KX196300 | DHAR2 | 639 | XM_008235328.1 | Prunus mume | dehydroascorbate reductase | 100% |
| KX196294 | GR1 | 1674 | XM_008237191.1 | Prunus mume | glutathione reductase | 96% |
| KX196301 | GR2 | 1491 | XM_008226379.1 | Prunus mume | glutathione reductase | 99% |
| KX196302 | MDHAR | 849 | XM_008229040.1 | Prunus mume | monodehydroascorbate reductase | 98% |
Changes in mRNA expression of genes involved in AsA synthesis, degradation, and recycling during fruit development
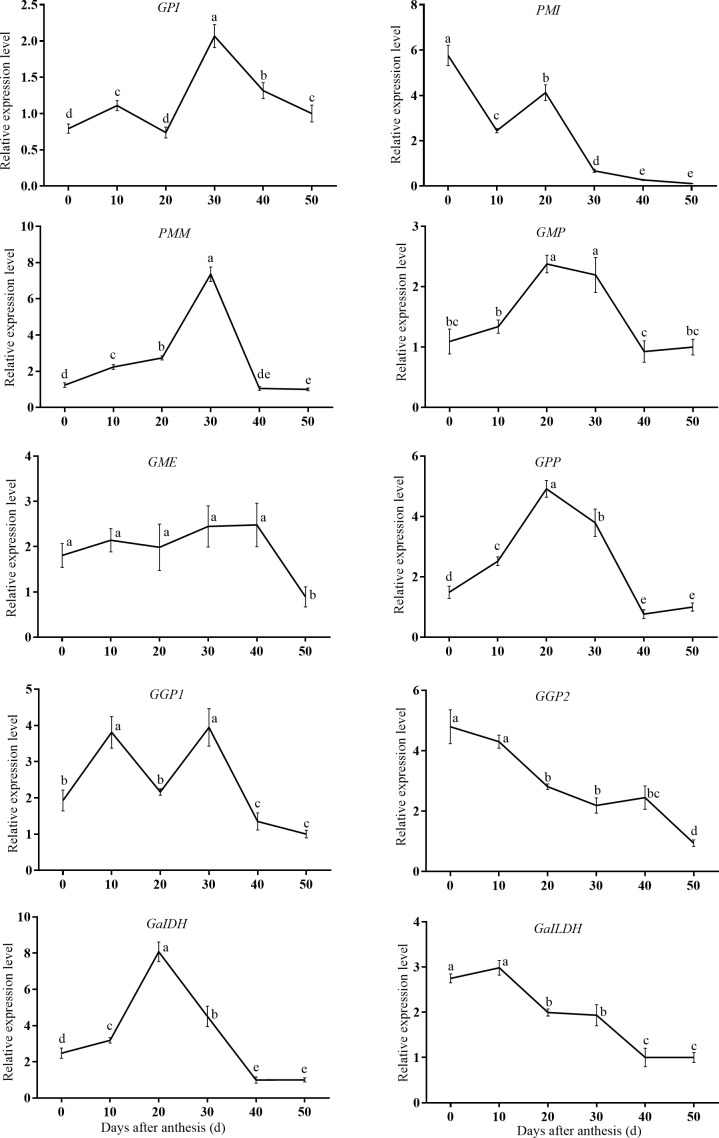
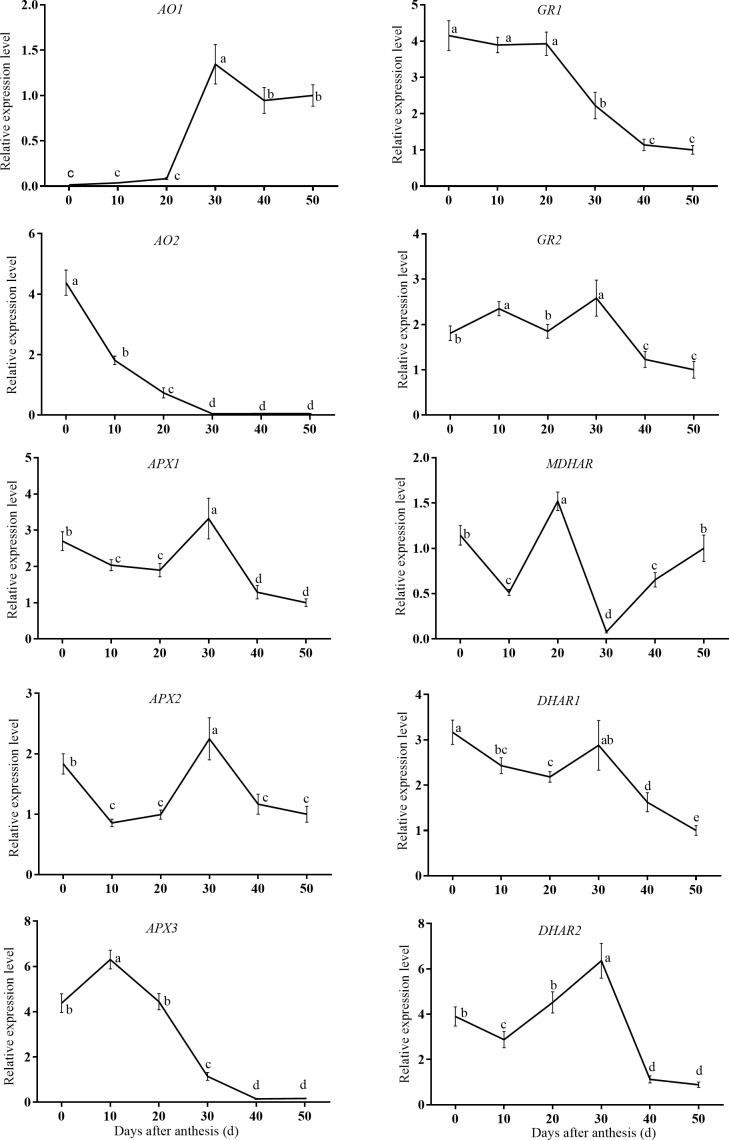
To understand the transcriptional regulation of genes involved in AsA accumulation in sweet cherry fruits, the expression of the genes encoding specific enzymes in the main AsA biosynthetic (Fig 3), degradation, and recycling pathways (Fig 4) during cherry fruit development were investigated using qRT-PCR.
Fig 3. Changes in relative mRNA expression for genes encoding enzymes involved in the L-galactose pathway of ascorbic acid synthesis, including GP1, PMI, PMM, GMP, GME, GPP, GGP1, GGP2, GalDH, and GalLDH.
Fig 4. Changes in relative mRNA expression for genes encoding enzymes involved in ascorbic acid degradation and recycling during fruit development, including AO1, AO2, APX1, APX2, APX3, GR1, GR2, MDHAR, DHAR1, and DHAR2.
The genes exhibited varying expression patterns. In the L-galactose pathway, GPI, PMM, GMP, GPP, and GalDH were expressed at relatively low levels at the young fruit stage; they increased to their highest levels during the enlargement stage (20 DAA or 30 DAA), and then decreased towards maturation. By contrast, the relative expression of GME remained steady before 40 DAA and then clearly declined until 50 DAA. And GGP1 displayed an “up-down-up-down” expression pattern during the whole course of development. PMI, GGP2, and GalLDH showed a similar expression pattern, with levels at their highest at 0 DAA, and then decreasing persistently with fruit ripening (S2 Appendix).
In the AsA-GSH cycle, the expression levels of APX1 and APX2 decreased during the young fruit stage, increased to their maximum at 30 DAA, and then decreased towards maturation. The relative expression of APX3, however, peaked at 10 DAA and then clearly declined to a steady and lower level after 40 DAA. DHAR2 displayed a similar expression profile to APX1 and APX2. Relative expression of AO1 mRNA showed no obvious changes from 0–20 DAA but clearly increased by 30 DAA, after which it remained at a constant level until fruit maturation. Moreover, the relative expression of AO2, GR1, and DHAR1 mRNA had its highest peak in 0 DAA fruit followed by a marked decline, and then it remained at a stable and very low level. The mRNA expression pattern of MDHAR was complicated, with three peaks (0, 20, and 50 DAA) and two troughs (10 and 30 DAA) (Fig 4), while GR2 showed an “up-down-up-down” pattern (S2 Appendix).
Expression of genes involved in AsA biosynthesis and recycling in leaves
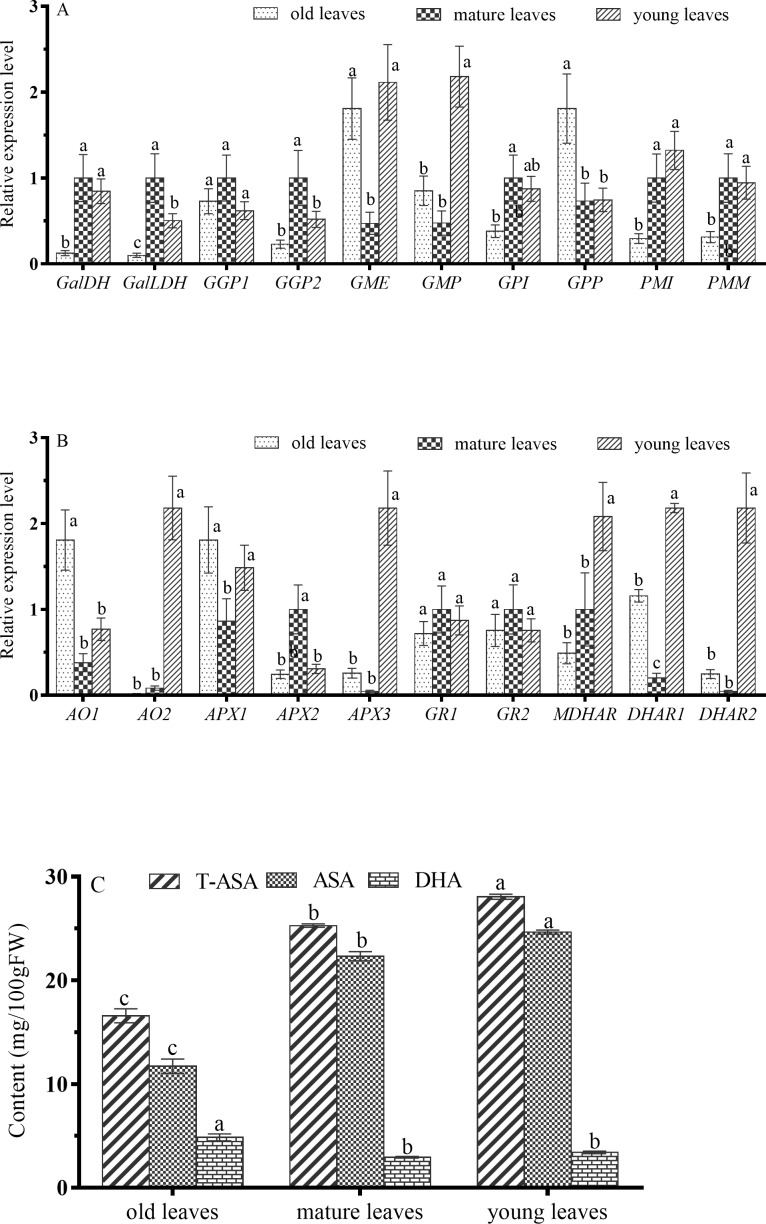
To explore AsA metabolism in leaves of sweet cherry, we analyzed the expression of genes related to AsA metabolism in young leaves, mature leaves, and old leaves, and we also measured reduced and oxidized AsA concentrations (Fig 5).
Fig 5. Changes in relative mRNA expression for genes encoding enzymes involved in ascorbic acid synthesis and recycling in young, mature, and old leaves.
(A) GPI, PMI, PMM, GMP, GME, GGP1, GGP2, GPP, GalDH, and GalLDH; (B) AO1, AO2, APX1, APX2, APX3, DHAR1, DHAR2, MDHAR, GR1, and GR2; (C) ascorbic acid (AsA) accumulation levels in old leaves, mature leaves, and young leaves.
AsA concentrations in leaves ranged from 16.5 to 28mg per 100g FW (Fig 5C), lower than the average AsA level in fruit. T-AsA and AsA both were highest in young leaves, significantly higher than they were in mature and old leaves. Accordingly, old leaves had lowest T-AsA and AsA concentrations, but the highest DHA concentrations.
Six of the genes related to AsA biosynthesis, GalDH, GalLDH, GGP1, GGP2, GPI, and PMM, had their highest expression levels in mature rather than young or old leaves, while three genes, GME, GMP, and PMI, had their highest levels of transcription in young leaves (Fig 5A). Five genes involved in degradation and recycling, AO2, APX3, MDHAR, DHAR1, and DHAR2, had extremely high expression levels in young leaves in contrast to mature and old leaves (Fig 5B). GR1 and GR2 expression levels did not significantly differ in young, mature, and old leaves. Considered together, these results indicate that high AsA concentrations in young leaves can be attributed to the high transcription levels of genes involved in AsA recycling (S3 Appendix).
Changes in activities of key enzymes involved in AsA synthesis and recycling during fruit development
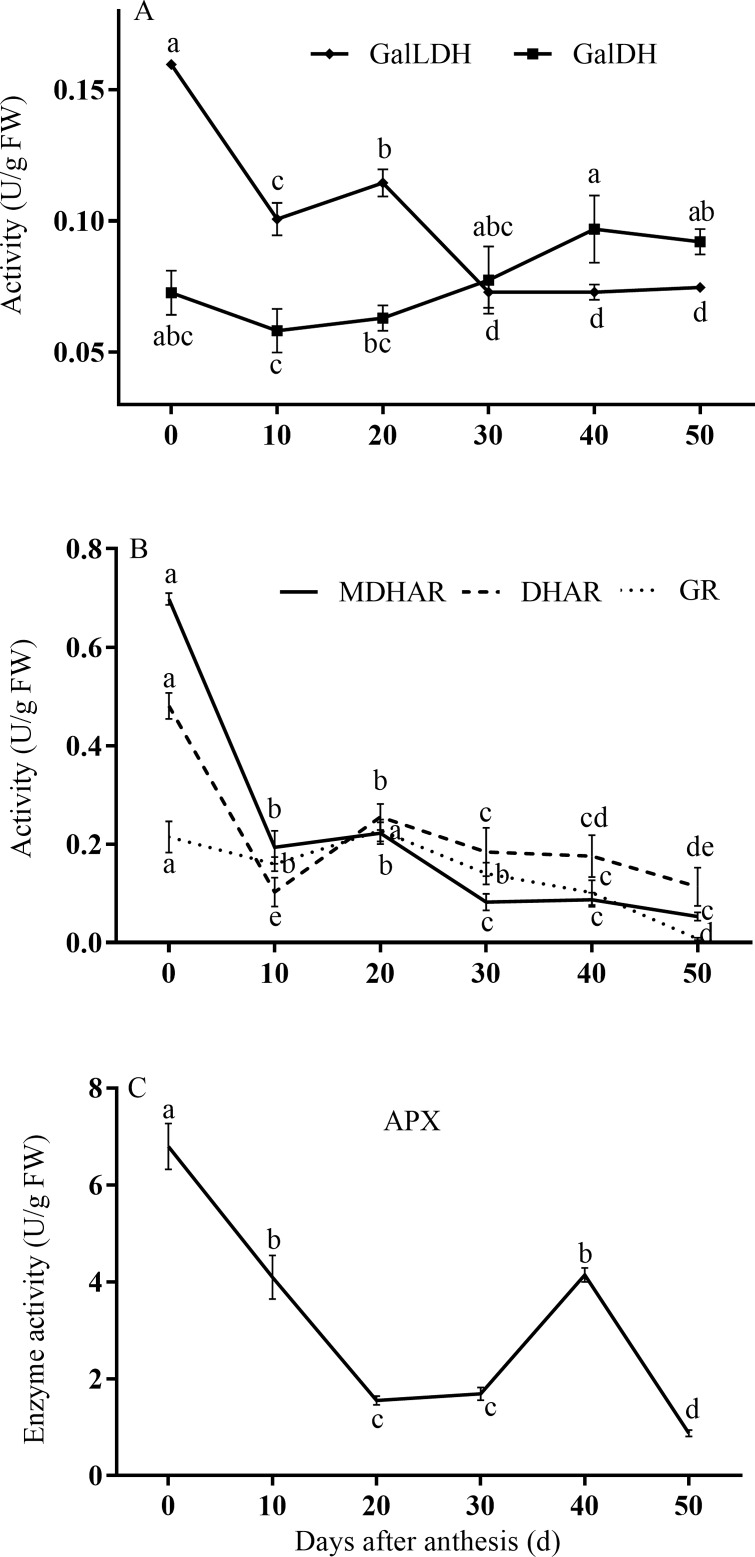
We selected several important enzymes involved in AsA metabolism for evaluation (Fig 6). On a fresh-weight basis, the patterns of GalLDH activity decreased gradually during fruit development and ripening. By contrast, GalDH activity increased slowly until fruit maturation (Fig 6A).
Fig 6.
Changes in enzyme activity levels of (A) GalLDH and GalDH; (B) MDHAR, DHAR, and GR; (C) APX, based on fresh weight during fruit development.
The activity of MDHAR peaked in 0 DAA fruit, and then clearly declined by 10 DAA. After that time point, MDHAR activity slightly decreased until maturity. Compared with its maximum in 0 DAA fruit, DHAR activity declined to its lowest point at 10 DAA; it increased from 10–20 DAA, and then declined slowly through to maturity. From 0–20 DAA, GR activity remained at a high and stable level, but clearly declined from 20 DAA to fruit maturation (Fig 6B). APX activity decreased significantly from 0–20 DAA but remained nearly constant and at a low level until maturity (Fig 6C).
Discussion
AsA accumulation during fruit development
AsA levels in plant cells vary between species and even between genotypes of a given species, and they are highly regulated by developmental processes [28]. In the present study, the AsA levels in sweet cherry fruit as determined by HPLC were found to be highest during the petal-fall period, they declined progressively during development, but then slightly increased at the last stage. Similar patterns have been seen in results from peach [21] and apple [18]. By contrast, AsA levels tend to increase over time in the fruit of grapes [29], strawberry [22], and chestnut rose [20]. In other fruits, such as kiwifruit and blueberry [30, 17], AsA concentration increases rapidly in the early stage, but declines in later stages. Variation in the AsA content trend during maturation determines the final AsA level in the fruit.
AsA biosynthesis and related gene expression during fruit development
AsA biosynthesis in situ is considered to be the prime mechanism leading to AsA accumulation in most plants, including blackcurrant [31], peach [21], kiwifruit [17], apple [18], and strawberry [22]. In the present study, we obtained 10 cDNA sequences involved in the L-galactose pathway. Results of qRT-PCR demonstrated that 10 key genes involved in AsA synthesis through the L-galactose pathway were expressed during sweet cherry fruit development (Fig 3). It is therefore understandable that genes/enzymes involved in the L-galactose pathway exist in sweet cherry fruit cells and may play key roles in AsA biosynthesis. Among these genes, GGP2 and GalLDH exhibited expression pattern that were in accord with the AsA levels during sweet cherry fruit ripening, indicating their key regulatory role in AsA biosynthesis. GGP has been supposed to be the key regulatory gene of the L-galactose pathway for AsA biosynthesis in kiwifruit [32] and apple [33]. The expression of GalLDH mostly correlated with the respective AsA content levels in different Myrciaria dubia tissues [34].
Expression patterns of genes involved in AsA degradation and recycling during fruit development
AsA concentration is determined not only by its biosynthesis but also by its degradation and recycling. We examined the pattern of expression of five genes involved in the degradation pathways (three APX and two AO isoforms) and five genes involved in AsA recycling during fruit maturation. AO2 and APX3 exhibited high expression levels at the beginning, and then decreased persistently during fruit development, a pattern in accordance with the observed changes in AsA levels. The high levels of AO transcripts during early fruit development may participate in cell growth [35]. The rapid decline of APX3 expression abundance in the fruit enlargement stage, simultaneously with fall of AsA, suggests that it plays an important role in AsA degradation.
With respect to the enzymes involved in recycling, MDHAR activity was found to be correlated with AsA concentration, but expression data showed that the GR1 and DHAR1 expression patterns tracked the AsA concentration more closely than did MDHAR. A high correlation between enzyme activity and MDHAR and DHAR mRNA abundance in response to ripening and stresses has been observed in acerola fruits [36]. Correlations between the expression and activity levels of DHAR and the level of AsA have been observed in kiwifruit [17] and chestnut rose [20]. The variation in strawberry fruit AsA content also correlated well with MDHAR [22].
The recycling and degradation steps, in particular AO2, APX3, GR1, and DGAR1, therefore appear to be important factors in the regulation of AsA content in the fruit of sweet cherry.
Expression of genes involved in AsA biosynthesis and recycling in leaves
Our results showed that sweet cherry had highest AsA content in young leaves, followed by a continuous decline with increasing leaf age. Whereas old leaves had highest DHA content compared with young and mature young leaves (Fig 5C). These results indicate that the rate of AsA synthesis exceeds the rate of oxidation loss in young leave, whereas oxidation loss exceeds biosynthesis in old leaves. It also suggests that AsA content in sweet cherry leaves is controlled by developmental processes, which is consistent with what was found in apple leaves [37].
GalDH, GalLDH and GGP were key enzymes in L-galactose pathway of AsA synthesize [38, 39]. In the present study, the expression patterns of GalDH, GalLDH and GGP showed highest expression level in mature leaves, which was not good agreement with AsA content in leaves of different ages (Fig 5A and 5C). while three genes involved in recycling, MDHAR, DHAR1, and DHAR2, had extremely high expression levels in young leaves in contrast to mature and old leaves (Fig 5B), indicating their critical role in maintaining the high levels of AsA content in young leaves.
Conclusions
AsA concentrations in plant cells are highly regulated by developmental processes such as fruit development. This regulation may differ according to genotype, tissue, and cell type. In the present study, we identified a complete and continuous set of sequences involved in the L-galactose pathway in AsA biosynthesis from sweet cherry fruit. The AsA content, expression, and activity levels of the corresponding proteins were detected during fruit development. AsA concentration was correlated with mRNA expression levels of GGP2, GalLDH, AO2, APX3, GR1, and DHAR1, all of which were highest in young fruit and then decreased steadily until full maturity. This indicates that these genes are the main control points for AsA production. More investigations are thus needed to achieve a deeper understanding of the role of key regulatory sites in sweet cherry fruit AsA accumulation.
Supporting information
(XLSX)
(XLSX)
(XLSX)
Data Availability
All relevant data are within the paper and its Supporting Information files.
Funding Statement
The authors received no specific funding for this work.
References
- 1.Wang P, Yin L, Liang D, Li C, Ma FW, Yue Z. Delayed senescence of apple leaves by exogenous melatonin: towards regulating the ascorbate-glutathione cycle. J. Pineal Res. 2012; 53:11–20. 10.1111/j.1600-079X.2011.00966.x [DOI] [PubMed] [Google Scholar]
- 2.Zheng YB and John H. Ascorbate in the leaf apoplast is a factor mediating ozone resistance in Plantago major. Plant Physiol. Bioch. 2000; 38:403–411. [Google Scholar]
- 3.Sanmartin M, Drogoudi PD, Lyons T, Pateraki I, Barnes J, Kanellis AK. Over-expression of ascorbate oxidase in the apoplast of transgenic tobacco results in altered ascorbate and glutathione redox states and increased sensitivity to ozone. Planta. 2003; 216:918–928. 10.1007/s00425-002-0944-9 [DOI] [PubMed] [Google Scholar]
- 4.Bartoti CG, Guiamet JJ, Kiddle G, Pastori G, Di Cagno R, Theodoulou FL, et al. The relationship between L-galactono-1,4-lactone dehydrogenase (GalLDH) and ascorbate content in leaves under optimal and stress conditions. Plant Cell Environ. 2005; 28: 1073–1081. [Google Scholar]
- 5.Wang Z, Xiao Y, Chen W, Tang K, Zhan L. Increased vitamin c content accompanied by an enhanced recycling pathway confers oxidative stress tolerance in Arabidopsis. J. Integr. PlantBiol. 2010; 52: 400–409. [DOI] [PubMed] [Google Scholar]
- 6.Yabuta Y, Mieda T, Rapolu M, Nakamura A, Motoki T, Maruta T, et al. Light regulation of ascorbate biosynthesis is dependent on the photosynthetic electron transport chain but independent of sugars in Arabidopsis. J. Expt. Bot. 2007; 58:2661–2671. [DOI] [PubMed] [Google Scholar]
- 7.Shalata A, Mittova V, Volokita M, Guy M, Tai M. Response of the cultivated tomato and its wild salt-tolerant relative Lycopersicon pennellii to salt-dependent oxidative stress: The root antioxidative system. Physiol. Plant. 2001; 112:487–494. [DOI] [PubMed] [Google Scholar]
- 8.Davey MW, Van Montagu M, Inzé D, Sanmartin M, Kanellis A, Smirnoff N, et al. Plant L-ascorbic acid: chemistry, function, metabolism, bioavailability and effects of processing. J. Sci. Food Agric. 2000; 80(7):825–860. [Google Scholar]
- 9.Foyer CH and Noctor G. Redox sensing and signaling associated with reactive oxygen in chloroplasts, peroxisomes and mitochondria. Physiol. Plantarum. 2003; 119:355–364. [Google Scholar]
- 10.Hancock RD and Viola R. Improving the nutritional value of crops through enhancement of L-ascorbic acid (Vitamin C) content: rationale and biotechnological opportunities. J. Agric. Food Chem. 2005; 53:5248–5257. 10.1021/jf0503863 [DOI] [PubMed] [Google Scholar]
- 11.Wheeler GL, Jones MA, Smirnoff N. The biosynthetic pathway of vitamin C in higher plants. Nature. 1998; 393:365–369. 10.1038/30728 [DOI] [PubMed] [Google Scholar]
- 12.Wolucka BA and van Montagu M. GDP-mannose-3′,5′-epimerase forms GDP-L-gulose, a putative intermediate for the de novo biosynthesis of vitamin C in plants. J. Biol. Chem. 2003; 278: 47483–47490. 10.1074/jbc.M309135200 [DOI] [PubMed] [Google Scholar]
- 13.Agius F, González-Lamothe R, Caballero JL, Muñoz-Blanco J, Botella MA, Valpuesta V. Engineering increased vitamin C levels in plants by overexpression of a D-galacturonic acid reductase. Nat. Biotechnol. 2003; 21:177–181. 10.1038/nbt777 [DOI] [PubMed] [Google Scholar]
- 14.Lorence A, Chevone BI, Mendes P, Nessler CL. Myoinositol oxygenase offers a possible entry point into plant ascorbate biosynthesis. Plant Physiol. 2004; 134:1200–1205. 10.1104/pp.103.033936 [DOI] [PMC free article] [PubMed] [Google Scholar]
- 15.Dowdle J, Ishikawa T, Gatzek S, Rolinski S, Smirnoff N. Two genes in Arabidopsis thaliana encoding GDP-L-galactose phosphorylase are required for ascorbate biosynthesis and seedling viability. Plant J. 2007; 52:673–689. 10.1111/j.1365-313X.2007.03266.x [DOI] [PubMed] [Google Scholar]
- 16.Linster CL, Gomez TA, Christensen KC, Adler LN, Young BD, Brenner C, et al. Arabidopsis VTC2 encodes a GDP-L-galactose phosphorylase, the last unknown enzyme in the Smirnoff-Wheeler pathway to ascorbic acid in plants. J. Biol. Chem. 2007; 282:18879–18885. 10.1074/jbc.M702094200 [DOI] [PMC free article] [PubMed] [Google Scholar]
- 17.Li MJ, Ma FW, Liang D, Li J, Wang YL. Ascorbate biosynthesis during early fruit development is the main reason for its accumulation in kiwi. PLoS ONE. 2010; 5(12):e14281 10.1371/journal.pone.0014281 [DOI] [PMC free article] [PubMed] [Google Scholar]
- 18.Li MJ, Chen XS, Wang PP, Ma FW. Ascorbic acid accumulation and expression of genes involved in its biosynthesis and recycling in developing apple fruit. Soc. Hort. Sci. 2011; 136(4): 231–238. [Google Scholar]
- 19.Concetta G, Karppinen K, Suokas M, Hohtola A, Haggman H, Spinardi A, et al. Ascorbic acid metabolism during bilberry (Vaccinium myrtillus L.) fruit development. J. Plant Physiol. 2012; 169:1059–1065. 10.1016/j.jplph.2012.03.010 [DOI] [PubMed] [Google Scholar]
- 20.Huang M, Xu Q, Deng XX. L-Ascorbic acid metabolism during fruit development in an ascorbate-rich fruit crop chestnut rose (Rosa roxburghii Tratt). J. Plant Physiol. 2014; 171:1205–1216. 10.1016/j.jplph.2014.03.010 [DOI] [PubMed] [Google Scholar]
- 21.Imai T, Ban Y, Terakami S, Yamamoto T, Moriguchi T. L-Ascorbate biosynthesis in peach: cloning of six L-galactose pathway-related genes and their expression during peach fruit development. Physiol. Plantarum. 2009; 136:139–149. [DOI] [PubMed] [Google Scholar]
- 22.Cruz-Rus E, Amaya I, Sánchez-Sevilla JF, Botella MA, Valpuesta V. Regulation of L-ascorbic acid content in strawberry fruits. J. Exp. Bot. 2011; 62:4191–4201. 10.1093/jxb/err122 [DOI] [PMC free article] [PubMed] [Google Scholar]
- 23.Zhang CM, Huang J, Li XG. Transcriptomic Analysis Reveals the Metabolic Mechanism of L-Ascorbic Acid in Ziziphus jujuba Mill. Front. Plant Sci. 2016; 7: 122 a 10.3389/fpls.2016.00122 [DOI] [PMC free article] [PubMed] [Google Scholar]
- 24.Gasic K, Hernandez A, Korban SS. RNA extraction from different apple tissues rich in polyphenols and polysaccharides for cDNA library construction. Plant Mol. Biol. Rep. 2004; 22:437–438. [Google Scholar]
- 25.Ye X, Zhang FM, Tao YH, Song SW, Fang JB. Reference gene selection for quantitative real-time PCR normalizationin different cherry genotypes, developmental stages and organs. Sci. Horti. 2015; 181:182–188. [Google Scholar]
- 26.Nakano Y and Asada K. Hydrogen peroxide is scavenged by ascorbate-specific peroxidase in spinach chloroplasts. Plant Cell Physiol. 1981; 22: 867–880. [Google Scholar]
- 27.Ma FW and Cheng LL. The sun-exposed peel of apple fruit has higher xanthophyll cycle-dependent thermal dissipation and antioxidants of the ascorbate-glutathione pathway than the shade peel. Plant Sci. 2003; 165: 819–827. [Google Scholar]
- 28.Hancock RD, Walker PG, Pont SDA, Marquis N, Vivera S, Gordon SL, et al. L-Ascorbic acid accumulation in fruit of Ribes nigrum occurs by in situ biosynthesis via the L-galactose pathway. Funct. Plant Biol. 2007; 34:1080–1091. [DOI] [PubMed] [Google Scholar]
- 29.Cruz-Rus E, Botella MA, Valpuesta V, Gomez-Jimenez MC. Analysis of genes involved in L-ascorbic acid biosynthesis during growth and ripening of grape berries. J. Plant Physiol. 2010; 167:739–748. 10.1016/j.jplph.2009.12.017 [DOI] [PubMed] [Google Scholar]
- 30.Liu FH, Wang L, Gu L, Zhao W, Su HY, Cheng XH. Higher transcription levels in ascorbic acid biosynthetic and recycling genes were associated with higher ascorbic acid accumulation in blueberry. Food Chemi. 2015; 188:399–405. [DOI] [PubMed] [Google Scholar]
- 31.Gallie DR. L-Ascorbic Acid: A Multifunctional Molecule Supporting Plant Growth and Development. Scientifica, 2013; Article ID 795964, 24 pages. [DOI] [PMC free article] [PubMed] [Google Scholar]
- 32.Bulley S, Wright M, Rommens C, Yan H, Rassam M, Lin-Wang K, Andre C, Brewster D, Karunairetnam S, Allan AC, Laing WA. Enhancing ascorbate in fruits and tubers through over-expression of the L-galactose pathway gene GDP-L-galactose phosphorylase. Plant Biotechnol J. 2012; 10(4): 390–397. 10.1111/j.1467-7652.2011.00668.x [DOI] [PubMed] [Google Scholar]
- 33.Mellidou I, Chagné D, Laing WA, Keulemans J, Davey MW. Allelic variation in paralogs of GDP-L-Galactose phosphorylase is a major determinant of vitamin C concentrations in apple fruit. Plant Physiol. 2012; 160, 1613–1629. 10.1104/pp.112.203786 [DOI] [PMC free article] [PubMed] [Google Scholar]
- 34.Castro JC, Cobos M, Maddox JD, Imán SA, Egoavil A, Torres J, Gutierrez F. Gene expression and enzyme activities of the D-mannose/L-galactose pathway influence L-ascorbic acid content in Myrciaria dubia. Biol. Plantarum. 2015; 59 (4):783–787. [Google Scholar]
- 35.Sanmartin M, Pateraki I, Chatzopoulou F, Kanellis, A K. Differential expression of the ascorbate oxidase multigene family during fruit development and in response to stress. Planta. 2007; 225, 873–885. 10.1007/s00425-006-0399-5 [DOI] [PubMed] [Google Scholar]
- 36.Eltelib HA, Badejo AA, Fujikawa Y, Esaka M. Gene expression of monodehydroas corbate reductase and dehydroascorbate reductase during fruit ripening and in response to environmental stresses in acerola (Malpighia glabra). J. Plant Physiol. 2011; 168:619–627. 10.1016/j.jplph.2010.09.003 [DOI] [PubMed] [Google Scholar]
- 37.Li MJ, Ma FW, Guo CM, Liu J. Ascorbic acid formation and profiling of genes expressed in its synthesis and recycling in apple leaves of different ages. Plant Physiology and Biochemistry. 2010; 48:216–224 10.1016/j.plaphy.2010.01.015 [DOI] [PubMed] [Google Scholar]
- 38.Linster CL, Clarke SG. L-ascorbate biosynthesis in higher plants: the role of VTC2. Trends Plant Sci. 2008; 13: 567–573. 10.1016/j.tplants.2008.08.005 [DOI] [PMC free article] [PubMed] [Google Scholar]
- 39.Valpuesta V, Botella MA. Biosynthesis of L-ascorbic acid in plants: new pathways for an old antioxidant TRENDS in Plant Science. 2004; 9: 573–577. 10.1016/j.tplants.2004.10.002 [DOI] [PubMed] [Google Scholar]
Associated Data
This section collects any data citations, data availability statements, or supplementary materials included in this article.
Supplementary Materials
(XLSX)
(XLSX)
(XLSX)
Data Availability Statement
All relevant data are within the paper and its Supporting Information files.


