Abstract
Few technologies are capable of imaging in vivo function during development. In this study, we have implemented spectral photoacoustic imaging to estimate tissue oxygenation longitudinally in pregnant mice. We used the spectral photoacoustic signal to estimate hemoglobin oxygen saturation within intact, in vivo mouse concepti from developmental day (E) 8.5 to E16.5—a first step towards functional imaging of the maternal-fetal environment. Future work will apply these methods to compare longitudinal functional changes during normal vs abnormal development of embryos, fetuses, and placentas.
OCIS codes: (100.1830) Deconvolution, (170.2655) Functional monitoring and imaging, (170.7170) Ultrasound, (170.5120) Photoacoustic imaging
1. Introduction
To study developmental abnormalities, researchers have made significant discoveries using simpler models of the in vivo system—such as in vitro culture or ex vivo tissues to study changes in genetic and protein expression profiles [1]. However, in vivo function—the production and transport of nutrients, oxygen, and signaling molecules—remains difficult to study and incompletely understood in the maternal-fetal environment. We have implemented ultrasound-guided spectral photoacoustic imaging to measure longitudinal in vivo hemoglobin oxygen saturation as a first step towards imaging function during development.
Several imaging modalities provide the high contrast and centimeter-scale imaging depth necessary for in vivo studies of function during development—micro-magnetic resonance imaging (µMRI), high frequency ultrasound, and photoacoustic imaging. Optical imaging methods that are dependent upon coherent light have limited depth of imaging due to light scattering, while embryonic and fetal tissues provide minimal x-ray contrast [2]; due to these limitations, most optical and x-ray based imaging methods are limited to ex vivo tissue analysis. µMRI provides high resolution images of anatomical structure [3]—in vivo brain sparing has been assessed using blood oxygenation level dependent (BOLD) µMRI [4]. However, real-time measurements are critical for characterization of in vivo function, while clinical applications of MRI during pregnancy are limited due to instrumentation cost and the inability to use the system at bench-side. Ultrasound provides high spatial resolution for structural phenotyping [5–11] and has provided new insights on the functional effects on the heart of teratogen exposure [12]. Photoacoustic imaging—using a short laser pulse to generate ultrasound transients from optical absorbers—improves image contrast while maintaining many advantages of ultrasound imaging. Introduction of targeted contrast agents for photoacoustic imaging provides information about molecular composition of in vivo tissues [13, 14]. Imaging of function is a particular strength of photoacoustic techniques—measurements of hemoglobin oxygen saturation (sO2) been demonstrated in phantoms [15] and preclinical models [16–18].
In this work, we demonstrate the combination of ultrasound-guided spectral photoacoustic as a preclinical method to analyze the maternal-fetal environment—specifically, sO2 of the conceptus tissues—longitudinally over an extended period of development. Previously, photoacoustic methods have been used to image mouse developmental anatomy either ex vivo or in situ by exteriorizing the uterus [19, 20]. The single reported image of an E15.5 conceptus in an intact mother acquired photoacoustic signal within a relatively small field of view [16]; without ultrasound images of anatomy for guidance, distinction between the maternal and fetal contributions to the signal can be challenging. In addition to providing ultrasound-guidance, we extend the application of photoacoustic imaging to the functional maternal-fetal environment, using a 2D linear phased array transducer for acquisition of both ultrasound and photoacoustic signals of intact, in vivo pregnancies. We apply spectral photoacoustic imaging methods to measure sO2 similar to those used in preclinical models of cancer—scanning the wavelength of the laser and acquiring photoacoustic images at each wavelength of light, then using linear least squares to fit the resulting photoacoustic signal intensity to the characteristic absorption spectra of oxy- and deoxyhemoglobin to generate maps of sO2 [18, 21, 22]. Additionally, we calibrate our fit of sO2 using data obtained from a phantom of porcine blood. Quantitative measurement of the concentration of blood sO2 remains a challenge [22, 23], since the local laser fluence is difficult to measure and model due to the complex scattering and absorption properties of in vivo tissues [24]. This complex optical scattering and absorption leads to “spectral coloring”. However, assessment of qualitative or relative changes in sO2 can provide insight on underlying mechanisms of normal and abnormal development. Ongoing advances in spectral photoacoustic imaging and quantitative analysis methods make our approach a viable and timely strategy for tracking functional development during pregnancy.
2. Methods
2.1 In vivo model
Inbred SWV mice were allowed free access to food and water, and maintained in a closed breeding colony at the Dell Pediatric Research Institute Vivarium. Nulligravid females, 2-3 months of age, were bred overnight to males and examined the following morning for the presence of vaginal plugs. The presence of vaginal plugs indicated copulation, using 1 am the previous night as the start of gestation. Mice were handled and housed following protocols approved by the University of Texas Institutional Animal Care and Use Committee.
2.2 Ultrasound-guided spectral photoacoustic imaging, calibration, and analysis
Ultrasound and photoacoustic images were acquired using a Vevo LAZR small animal imaging system. We used an LZ-550 transducer—axial resolution of 44 um, lateral resolution of 90 um at geometric focus, broadband frequency of 32 MHz to 55 MHz with a center frequency of 40 MHz—to acquire photoacoustic images from 780 nm to 820 nm in steps of 10 nm. For mice, this transducer provides good resolution at the earlier gestational stages, while having a depth of field sufficient to capture larger fetuses at later stages of development. We used the same transducer and positioned the conceptus of interest approximately 1 cm beneath the transducer face when collecting longitudinal images to ensure comparable fluence in all imaging sessions. Mice were anesthetized with isoflurane—2-2.5% carried with 1.5 mL/min of oxygen gas—and placed supine on a heated physiological monitoring stage. Depth of anesthesia was monitored and isoflurane was adjusted as needed to maintain 50-60 breaths per minute. Images were acquired every other day from gestational day E8.5 to E18.5. Each animal was anesthetized for a maximum of 3 hrs per day.
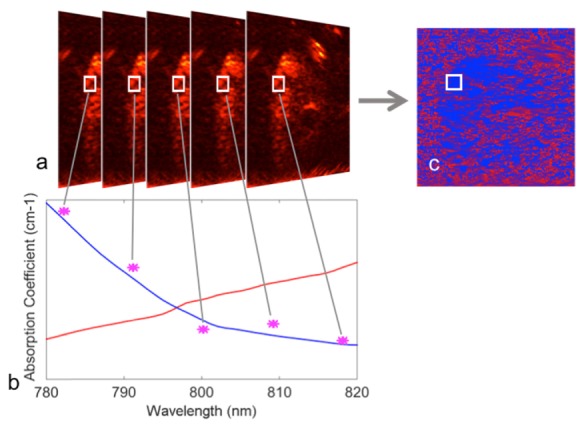
The image data from the Vevo LAZR imaging sessions was processed to calculate the sO2. The image data was first exported and parsed into a data matrix for subsequent analysis. At each pixel, the variation in the photoacoustic signal intensity vs wavelength was fit to the optical absorption spectra of oxy- and deoxyhemoglobin using linear least squares [25], as shown in Fig. 1. A limitation of this analysis method is that it neglects wavelength-dependent variation in fluence. To calibrate our fitting algorithms, we acquired photoacoustic images of a tube phantom containing heparinized porcine blood. We flowed oxygen to the blood, while stirring, and recorded the partial pressure of oxygen of the solution (NeoFox, Ocean Optics). The blood was pulled, using a syringe, through polymer tubing with inner diameter of 0.86 mm, suspended in water, 9 mm away from the transducer. Photoacoustic images at wavelengths from 680 to 970 nm in steps of 1 nm were acquired at oxygen partial pressures varying from 0 mmHg to 140 mmHg.
Fig. 1.

Linear least squares fitting of 2D images of photoacoustic signal intensity variation with laser wavelength to the optical absorption of oxy- and deoxyhemoglobin, to generate 2D images of sO2. (a) photoacoustic images acquired at multiple laser wavelengths; (b) photoacoustic signal at each pixel is fit to the optical absorption coefficient of oxy- and deoxyhemoglobin to generate a 2D map of sO2 (c).
The phantom data was used to correct the linear fit of the hemoglobin oxygen saturation, by first fitting the sO2 calculated from the blood phantom to a sigmoidal curve then scaling to a sigmoidal curve fit of tabulated oxyhemoglobin dissociation data [26]. The corrected sO2 was then displayed using a red-blue color map, where red represents fully oxygenated hemoglobin while blue represents fully deoxygenated hemoglobin, with varying proportions of red and blue represented using a 255 value colormap. In the final images, the ultrasound image was used to segment the anatomy of interest, and the transparency of the sO2 map was scaled to the original photoacoustic signal intensity in the 2D images. All programming was implemented in Matlab software.
3. Results and discussion
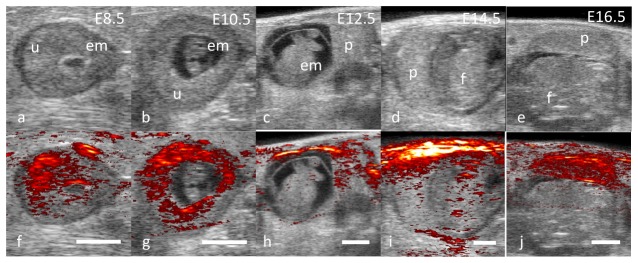
In these studies, we acquired ultrasound-guided spectral photoacoustic images of pregnant SWV mice longitudinally throughout the late embryonic and fetal stages of development. The photoacoustic imaging instrumentation used in these studies consisted of a 2D linear array ultrasound transducer, designed for small animal imaging, integrated with a tunable nanosecond laser. Performing ultrasound and photoacoustic imaging with the same transducer co-registers the two images. Additional advantages of the ultrasound-guided photoacoustic-enabled 2D transducer array system include fast imaging speed (real time 2D imaging), imaging at significant tissue depth, and the ability to correlate anatomical features on ultrasound with the photoacoustic signal [21, 27, 28]. Co-registration of the anatomy and the contrast from the photoacoustic signal provides anatomical guidance for functional characterization. Ultrasound provided high-resolution images of the developing anatomy from E8.5 to E16.5 (Fig. 2(a)), allowing the identification of major features of the developing conceptus—the uterine wall, embryo/fetus, and placenta. An overlay of ultrasound and photoacoustic images provides guidance for identification of the anatomical origin of the photoacoustic signal (Fig. 2(b)); in each image, the median photoacoustic signal was used as a threshold for display of photoacoustic signal—above this threshold, the photoacoustic signal is displayed, below this threshold the ultrasound signal is displayed. Each photoacoustic image is scaled to the maximum photoacoustic signal in that image. Light traveling through tissue is absorbed and scattered such that light transmission diminishes exponentially with depth [24]; as expected, strong photoacoustic signal is seen in vasculature close to the tissue surface—as in the placenta in Fig. 2(a)—indicating high optical absorption due to increased concentration of hemoglobin.
Fig. 2.
Longitudinal ultrasound-guided photoacoustic images of development. The ultrasound (a-e) provides high resolution images of the anatomy. The photoacoustic signal, overlain on the ultrasound images (f-j) shows signal in tissue which is highly absorbing due to the presence of hemoglobin. All images were acquired with a 40 MHz transducer, and the photoacoustic signal was acquired at 810 nm. Scale bars = 2mm. Uterus (u), embryo (em), fetus (f) and placenta (p) are labeled in the ultrasound images. Photoacoustic skin artifacts have been manually segmented and removed from images.
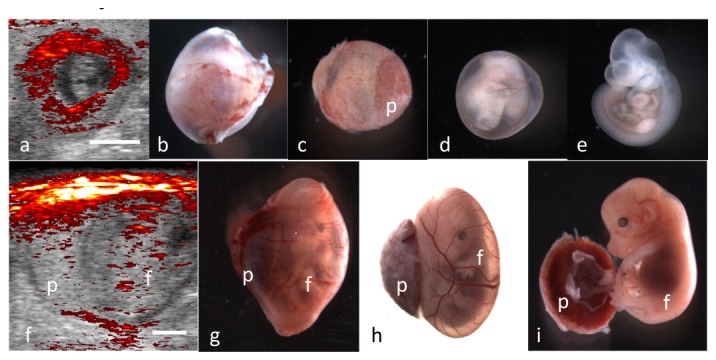
To compare the photoacoustic signal to the development of vasculature and hematopoietic vessels, microscopy images of whole-mount concepti were acquired. In the E10.5 conceptus, PA signal appears in areas where blood supply is increased—the uterine wall and decidua (Fig. 3(a)). The corresponding microscopy images (Fig. 3(b)) shows vessels supplying the uterine wall and decidua. Additionally, the Reichert’s membrane is a source of blood contrast (Fig. 3(c)). Vasculature from yolk sac (Fig. 3(d)) and embryo (Fig. 3(e)) is present but has less blood—and therefore less photoacoustic signal—in comparison to the maternal tissues at this stage. At later stages of development—E14.5—fetal vasculature is discernable (Fig. 3(f)-3(i)). The placenta is distinguishable both in the ultrasound and photoacoustic images and the fetal body has sufficient vasculature to generate photoacoustic signal (Fig. 3(f)). Some smaller vessels can be seen, as well as potentially the yolk sac vessels (Fig. 3(h)). Increased signal is seen within the fetus tissue—more signal is generated within the abdominal region of fetus from the liver (Fig. 3(i)). The anatomy and photoacoustic signal generation is consistent with what is understood about embryonic and fetal hematopoiesis and vasculogenesis [29]. Red blood cells derive from hematopoetic progenitors from the endothelium of arteries—vitelline artery, umbilical artery, and dorsal aorta—as well as the heart and yolk sac [30]. Distribution of light is likely to vary from position to position in tissue, which our algorithms and reconstruction methods do not currently account for.
Fig. 3.

Endogenous photoacoustic contrast in E10.5 and E14.5 concepti. (a) ultrasound-guided photoacoustic image, (b) excised gravid uterine horn segment, (c) Reichart’s membrane (d) yolk sac; and (e) embryo of E10.5 conceptus. (f) ultrasound-guided photoacoustic image, (g) excised gravid uterine horn segment, (h) yolk sac and (i) fetus of E14.5 conceptus. Scale bars = 2mm. placenta (p) and fetus (f) are labeled in the images.
3.1 Longitudinal images of oxygen saturation
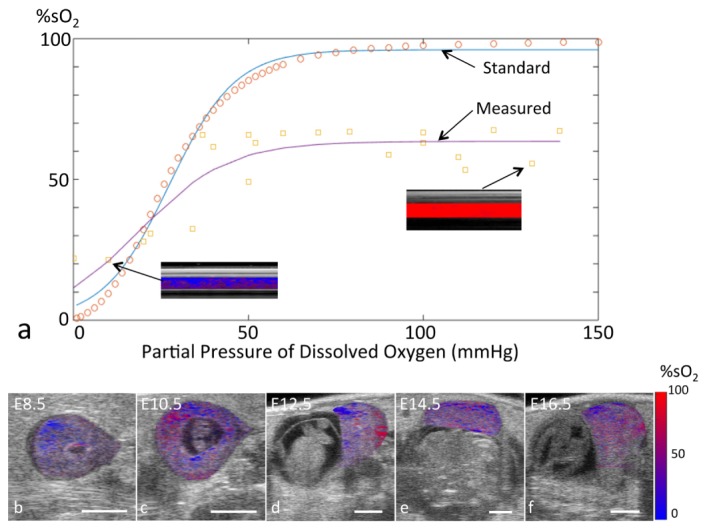
Spectral photoacoustic images of a phantom of porcine blood were used to calibrate the spectral fitting of the in vivo images. We fit the spectral photoacoustic images acquired of blood at varying partial pressure of oxygen to the optical absorption spectra of oxy- and deoxyhemoglobin using a linear least squares algorithm [21]. The oxygen saturation plotted versus the measured partial pressure of oxygen (ppO2) shows the expected sigmoid curve, but with errors in estimation of the absolute value of sO2; Fig. 4(a) displays the measured sO2 calculated from the spectral photoacoustic signals using linear least squares (yellow circle markers); the sigmoidal fit is overlain (purple solid line). Tabulated sO2 at varying partial pressures is plotted (orange circles) and the sigmoidal fit is overlain (blue line). We rescaled our sO2 maps by first calculating a sigmoidal fit to blood hemoglobin oxygen saturation data from literature [31], and also calculating a sigmoidal fit to our phantom sO2 versus ppO2. Our sigmoidal fit to the measured phantom sO2 was used to calculate ppO2 for a given pixel, then the standard sigmoidal fit was used to convert the ppO2 to sO2. Using human hemoglobin for our sO2 estimation could introduce a 10-20% error in the estimation of sO2 [32]. The resulting sO2 maps, segmented to anatomy of interest, are shown in Fig. 4(b)-4(f). Rescaling our sO2 estimations attempts to correct for systems-level inaccuracies in the sO2 values—for example, unequal weighting of photoacoustic signal at particular wavelengths due to differences in delivery of laser fluence. Though our sample size was too small to demonstrate statistical significance, our calculated sO2, segmented to the conceptus as shown in the example images, was comparable to expected physiological values—0.44 at E8.5, 0.55 at E14.5, and 0.52 at E16.5. For comparison, placental oxygenation was measured as 0.48 + 0.19 at E14.5 and 0.39 + 0.17 at E17.5 using BOLD MRI [4]. Our spectral analysis algorithms do not correct for wavelength-dependent differences in the optical scattering and absorption in tissues, which change the spectral fluence at depth—future work will implement light scattering and absorption modeling to improve quantification of sO2. Longitudinal tracking of conceptus oxygenation or placental hemoglobin oxygenation is a promising use of this analytical method, segmenting the functional photoacoustic signal using ultrasound anatomy.
Fig. 4.

Longitudinal in vivo imaging of regional tissue sO2 during development. a) A tissue phantom of porcine blood at varying partial pressure of oxygen was used to generate spectral photoacoustic images, which were fit using the spectral fitting algorithms (measured data). The spectral fitting algorithm results were calibrated using tabulated sO2 vs partial pressure of oxygen (standard). b) The oxygen saturation values resulting from the calibrated fitting algorithms are overlain on the ultrasound anatomy. Intensity of sO2 signal in each image is proportional to the photoacoustic signal intensity. Scale bars = 2mm.
4. Conclusions
In this work, we characterize the photoacoustic signal generation from endogenous chromophores of a pregnant mouse model, and the ability of spectral photoacoustic processing methods to generate maps of function—using ultrasound to segment anatomy, and quantify photoacoustic signal and measure sO2 longitudinally over time. We demonstrate the ability of ultrasound-guided spectral photoacoustic imaging to conduct longitudinal studies of development (from E8.5 to E16.5 in these studies). Imaging of function is an emerging area of photoacoustic imaging, with applications in the study of many pathologies. Specific to studying pregnancy, the oxygenation or function of the environment is critical to understanding the development of many abnormal conditions—the study of genetic birth defects, teratogens, preeclampsia and gestational diabetes. Since our imaging instrumentation borrows many features from clinical ultrasound, future translation of ultrasound-guided photoacoustic imaging to clinical use is on the horizon.
Acknowledgments
We thank Drs. Jason Cook and Geoffrey Luke for assistance with the conception and construction of the blood phantom prototype used to calibrate the sO2 algorithms in these studies.
References and links
- 1.Richardson L., Venkataraman S., Stevenson P., Yang Y., Moss J., Graham L., Burton N., Hill B., Rao J., Baldock R. A., Armit C., “EMAGE mouse embryo spatial gene expression database: 2014 update,” Nucleic Acids Res. 42(D1), D835–D844 (2014). 10.1093/nar/gkt1155 [DOI] [PMC free article] [PubMed] [Google Scholar]
- 2.Norris F. C., Wong M. D., Greene N. D. E., Scambler P. J., Weaver T., Weninger W. J., Mohun T. J., Henkelman R. M., Lythgoe M. F., “A coming of age: advanced imaging technologies for characterising the developing mouse,” Trends Genet. 29(12), 700–711 (2013). 10.1016/j.tig.2013.08.004 [DOI] [PubMed] [Google Scholar]
- 3.Pallares P., Perez-Solana M. L., Torres-Rovira L., Gonzalez-Bulnes A., “Phenotypic characterization by high-resolution three-dimensional magnetic resonance imaging evidences differential effects of embryo genotype on intrauterine growth retardation in NOS3-deficient mice,” Biol. Reprod. 84(5), 866–871 (2011). 10.1095/biolreprod.110.088534 [DOI] [PubMed] [Google Scholar]
- 4.Cahill L. S., Zhou Y. Q., Seed M., Macgowan C. K., Sled J. G., “Brain sparing in fetal mice: BOLD MRI and Doppler ultrasound show blood redistribution during hypoxia,” J. Cereb. Blood Flow Metab. 34(6), 1082–1088 (2014). 10.1038/jcbfm.2014.62 [DOI] [PMC free article] [PubMed] [Google Scholar]
- 5.Greco A., Ragucci M., Coda A. R. D., Rosa A., Gargiulo S., Liuzzi R., Gramanzini M., Albanese S., Pappatà S., Mancini M., Brunetti A., Salvatore M., “High frequency ultrasound for in vivo pregnancy diagnosis and staging of placental and fetal development in mice,” PLoS One 8(10), e77205 (2013). 10.1371/journal.pone.0077205 [DOI] [PMC free article] [PubMed] [Google Scholar]
- 6.Mu J., Slevin J. C., Qu D., McCormick S., Adamson S. L., “In vivo quantification of embryonic and placental growth during gestation in mice using micro-ultrasound,” Reprod. Biol. Endocrinol. 6(1), 34 (2008). 10.1186/1477-7827-6-34 [DOI] [PMC free article] [PubMed] [Google Scholar]
- 7.Brown S. D., Zurakowski D., Rodriguez D. P., Dunning P. S., Hurley R. J., Taylor G. A., “Ultrasound diagnosis of mouse pregnancy and gestational staging,” Comp. Med. 56(4), 262–271 (2006). [PubMed] [Google Scholar]
- 8.Aristizábal O., Mamou J., Ketterling J. A., Turnbull D. H., “High-throughput, high-frequency 3-D ultrasound for in utero analysis of embryonic mouse brain development,” Ultrasound Med. Biol. 39(12), 2321–2332 (2013). 10.1016/j.ultrasmedbio.2013.06.015 [DOI] [PMC free article] [PubMed] [Google Scholar]
- 9.Phoon C. K. L., Ji R. P., Aristizábal O., Worrad D. M., Zhou B., Baldwin H. S., Turnbull D. H., “Embryonic heart failure in NFATc1-/- mice: novel mechanistic insights from in utero ultrasound biomicroscopy,” Circ. Res. 95(1), 92–99 (2004). 10.1161/01.RES.0000133681.99617.28 [DOI] [PubMed] [Google Scholar]
- 10.Leatherbury L., Yu Q., Lo C. W., “Noninvasive phenotypic analysis of cardiovascular structure and function in fetal mice using ultrasound,” Birth Defects Res. C Embryo Today 69(1), 83–91 (2003). 10.1002/bdrc.10005 [DOI] [PubMed] [Google Scholar]
- 11.Lo J. O., Mission J. F., Caughey A. B., “Hypertensive disease of pregnancy and maternal mortality,” Curr. Opin. Obstet. Gynecol. 25(2), 124–132 (2013). 10.1097/GCO.0b013e32835e0ef5 [DOI] [PubMed] [Google Scholar]
- 12.Bake S., Tingling J. D., Miranda R. C., “Ethanol exposure during pregnancy persistently attenuates cranially directed blood flow in the developing fetus: evidence from ultrasound imaging in a murine second trimester equivalent model,” Alcohol. Clin. Exp. Res. 36(5), 748–758 (2012). 10.1111/j.1530-0277.2011.01676.x [DOI] [PMC free article] [PubMed] [Google Scholar]
- 13.Luke G. P., Yeager D., Emelianov S. Y., “Biomedical applications of photoacoustic imaging with exogenous contrast agents,” Ann. Biomed. Eng. 40(2), 422–437 (2012). 10.1007/s10439-011-0449-4 [DOI] [PubMed] [Google Scholar]
- 14.Weber J., Beard P. C., Bohndiek S. E., “Contrast agents for molecular photoacoustic imaging,” Nat. Methods 13(8), 639–650 (2016). 10.1038/nmeth.3929 [DOI] [PubMed] [Google Scholar]
- 15.Laufer J., Delpy D., Elwell C., Beard P., “Quantitative spatially resolved measurement of tissue chromophore concentrations using photoacoustic spectroscopy: application to the measurement of blood oxygenation and haemoglobin concentration,” Phys. Med. Biol. 52(1), 141–168 (2007). 10.1088/0031-9155/52/1/010 [DOI] [PubMed] [Google Scholar]
- 16.Stein E. W., Maslov K., Wang L. V., “Noninvasive, in vivo imaging of blood-oxygenation dynamics within the mouse brain using photoacoustic microscopy,” J. Biomed. Opt. 14(2), 020502 (2009). 10.1117/1.3095799 [DOI] [PMC free article] [PubMed] [Google Scholar]
- 17.Bar-Zion A., Yin M., Adam D., Foster F. S., “Functional Flow Patterns and Static Blood Pooling in Tumors Revealed by Combined Contrast-Enhanced Ultrasound and Photoacoustic Imaging,” Cancer Res. 76(15), 4320–4331 (2016). 10.1158/0008-5472.CAN-16-0376 [DOI] [PubMed] [Google Scholar]
- 18.Mallidi S., Watanabe K., Timerman D., Schoenfeld D., Hasan T., “Prediction of tumor recurrence and therapy monitoring using ultrasound-guided photoacoustic imaging,” Theranostics 5(3), 289–301 (2015). 10.7150/thno.10155 [DOI] [PMC free article] [PubMed] [Google Scholar]
- 19.Chitnis P. V., Aristizabal O., Filoux E., Sampathkumar A., Mamou J., Turnbull D. H., Ketterling J. A., “Combined optoacoustic and high-frequency ultrasound imaging of live mouse embryos,” in Photons Plus Ultrasound: Imaging and Sensing (2012), pp. 822314–822316. [Google Scholar]
- 20.Laufer J., Norris F., Cleary J., Zhang E., Treeby B., Cox B., Johnson P., Scambler P., Lythgoe M., Beard P., “In vivo photoacoustic imaging of mouse embryos,” J. Biomed. Opt. 17(6), 061220 (2012). 10.1117/1.JBO.17.6.061220 [DOI] [PubMed] [Google Scholar]
- 21.Luke G. P., Emelianov S. Y., “Label-free Detection of Lymph Node Metastases with US-guided Functional Photoacoustic Imaging,” Radiology 277(2), 435–442 (2015). 10.1148/radiol.2015141909 [DOI] [PMC free article] [PubMed] [Google Scholar]
- 22.Cox B., Laufer J. G., Arridge S. R., Beard P. C., “Quantitative spectroscopic photoacoustic imaging: a review,” J. Biomed. Opt. 17(6), 061202 (2012). 10.1117/1.JBO.17.6.061202 [DOI] [PubMed] [Google Scholar]
- 23.Lutzweiler C., Razansky D., “Optoacoustic imaging and tomography: reconstruction approaches and outstanding challenges in image performance and quantification,” in Sensors (Basel) (2013), pp. 7345–7384. [DOI] [PMC free article] [PubMed] [Google Scholar]
- 24.Jacques S. L., “Optical properties of biological tissues: a review,” Phys. Med. Biol. 58(11), R37–R61 (2013). 10.1088/0031-9155/58/11/R37 [DOI] [PubMed] [Google Scholar]
- 25.S. Prahl, “Optical Absorption of Hemoglobin.” http://omlc.org/spectra/hemoglobin/
- 26.Severinghaus J. W., “Oxyhemoglobin dissociation curve correction for temperature and pH variation in human blood,” J. Appl. Physiol. 12(3), 485–486 (1958). [DOI] [PubMed] [Google Scholar]
- 27.Bayer C. L., Luke G. P., Emelianov S. Y., “Photoacoustic imaging for medical diagnostics,” Acoust. Today 8(4), 15–23 (2012). 10.1121/1.4788648 [DOI] [PMC free article] [PubMed] [Google Scholar]
- 28.Wei C. W., Nguyen T. M., Xia J., Arnal B., Wong E. Y., Pelivanov I. M., O’Donnell M., “Real-time integrated photoacoustic and ultrasound (PAUS) imaging system to guide interventional procedures: ex vivo study,” IEEE Trans. Ultrason. Ferroelectr. Freq. Control 62(2), 319–328 (2015). 10.1109/TUFFC.2014.006728 [DOI] [PMC free article] [PubMed] [Google Scholar]
- 29.Swartley O. M., Foley J. F., Livingston D. P., 3rd, Cullen J. M., Elmore S. A., “Histology Atlas of the Developing Mouse Hepatobiliary Hemolymphatic Vascular System with Emphasis on Embryonic Days 11.5-18.5 and Early Postnatal Development,” Toxicol. Pathol. 44(5), 705–725 (2016). 10.1177/0192623316630836 [DOI] [PMC free article] [PubMed] [Google Scholar]
- 30.Yzaguirre A. D., Speck N. A., “Extravascular endothelial and hematopoietic islands form through multiple pathways in midgestation mouse embryos,” Dev. Biol. 415(1), 111–121 (2016). 10.1016/j.ydbio.2016.04.004 [DOI] [PMC free article] [PubMed] [Google Scholar]
- 31.Severinghaus J. W., “Simple, accurate equations for human blood O2 dissociation computations,” J. Appl. Physiol. 46(3), 599–602 (1979). [DOI] [PubMed] [Google Scholar]
- 32.Serianni R., Barash J., Bentley T., Sharma P., Fontana J. L., Via D., Duhm J., Bunger R., Mongan P. D., “Porcine-specific hemoglobin saturation measurements,” J. Appl. Physiol. 94, 561–566 (2003). [DOI] [PubMed] [Google Scholar]


