Abstract
Large-scale and label-free phenotyping of cells holds great promise in medicine, especially in cancer diagnostics and prognosis. Here, we introduce inline digital holography microscopy for volumetric imaging of cells in bulk flow and fingerprinting of flowing tumor cells based on two metrics, in-focus scattered intensity and cell diameter. Using planar distribution of immobilized particles, we identify the optimal recording distance and microscope objective magnification that minimizes the error in measurement of particle position, size and scattered intensity. Using the optimized conditions and the two metrics, we demonstrate the capacity to enumerate and fingerprint more than 100,000 cells. Finally, we highlight the power of our label-free and high throughput technology by characterizing breast tumor cell lines with different metastatic potentials and distinguishing drug resistant ovarian cancer cells from their parental cell line.
OCIS codes: (090.1995) Digital holography, (170.0170) Medical optics and biotechnology
List of Symbols
| Symbol | Description | |
|---|---|---|
| xH, yH | : | x and y coordinates on hologram plane. |
| x,y,z | : | x, y, and z coordinates in reconstruction volume. |
| IH(xH,yH) | : | Intensity distribution of hologram image |
| E(x,y,z) | : | Complex amplitude distribution of images in reconstruction volume. |
| I(x,y,z) | : | Intensity distribution of images in reconstruction volume. |
| hz(x,y;xH,yH) | : | Free space impulse response function from hologram plane (xH, yH) to reconstruction image plane (x,y) at a distance z from hologram plane. |
| h | : | Height of the micro-channel |
| w | : | Width of the micro-channel |
| L | : | Length of the micro-channel/Frame |
| f | : | Focal length of the lens/microscope objective |
| Fv | : | Focus value of intensity gradient along axial direction in the reconstruction volume |
| Q | : | Flow rate (µL/min) |
| Vx,y,z | : | Velocity of bead/cell in 3D volume |
| F | : | Frame rate (frames/sec) |
| NA | : | Numerical aperture |
| λ | : | Wavelength of light |
| FWHM | : | Full-width-at-half-maximum |
| D | : | Diameter of bead/cell (µm) |
| Imax | : | Peak intensity of single core pixel of focused image of bead/cell in the reconstruction volume |
| µ | : | Mean value of the distribution |
| σ | : | Standard deviation of the distribution |
| CV | : | Coefficient of variance (σ/µ) of the distribution |
| TR | : | Drug resistant |
| SF | : | Sequential frame. |
| S | : | The forward scattering intensity collected within a 2o angle |
| C | : | Concentration of beads/cells |
1. Introduction
Rapid developments in high-throughput high–content cell-based assays have offered great promise in the fields of basic biology and applied medicine, especially in the areas of drug screening and cell characterization, identification, and counting [1,2]. In particular, characterization of cells using established microscopy and cytometry methods has relied heavily on fluorescent or other label-dependent techniques [1]. Although powerful, fingerprinting cells with fluorescent dyes and antibodies raises the concern of intervening with the biological activity of the cell and moreover antibody binding needs to be optimized to ensure sufficient signal to noise ratio. Additional issues include photobleaching of fluorophores, the short shelf-life of antibodies, and challenges in optimizing antibodies for specific protein targets. Thus, there is growing interest in developing non-invasive, label-free and high throughput techniques which require minimal cell manipulation, making them especially appropriate for analysis of primary cells [3].
In recent years, digital holography microscopy (DHM) has been explored as a powerful label-free technique for cell characterization [4]. The majority of prior works employing DHM have focused on two main areas of investigation. In the first case, off-axis DHM has been used to fingerprint static specimens of biological cells including red blood cells [5–8], blood and its constituents [9, 10], tumor cells [11], neurons [12], macrophages [13], and fibroblasts [14]. In the second case, inline DHM has been used to track particles or cells in bulk flow for enumeration purposes [15] or to quantify their trajectories [16, 17] or to characterize flow fields [18–21]. In the first case, the emphasis is on obtaining amplitude and/or phase information to establish label-free metrics to fingerprint cells; while in the second case, the emphasis is on precisely locating the three-dimensional position of the objects of interest in bulk flow. Building on these two lines of investigation, efforts are emerging to apply DHM to fingerprint biological cells in flow. As shown in Table 1, these works have characterized blood cells [22, 23], spermatozoon [24], planktonic organisms [25, 26], and tumor cells [27, 28].
Table 1. An overview of DHM studies in flow showing the capabilities demonstrated on fingerprinting biological cells.
| Reference | Cell type | Readout | No. of cells analyzed | Additional remarks |
|---|---|---|---|---|
| Sung et al. 2014 [29] | RKO Human Colon Cancer Cells, RPMI8266 multiple myeloma cells | Volume, dry mass, density, refractive index | 60 per sample | Single line of cells |
| Merola et al. 2013 [24] | Spermatozoon | Biovolume of spermatozoon head | ~80 total | Integrated with optical tweezers |
| Zetsche et al. 2015 [30] | Three separate single-celled nanoplankton species (all spherical ~5 μm diameter) | Six morphometric features (area, perimeter length, major and minor axis, eccentricity, and equivalent circular diameter) and six textural features (average gray level, average contrast, smoothness, skewness, uniformity, and entropy) | ~200 per sample | |
| Won Seo et al. 2014 [31] | Red blood cells +/− malaria infection (vertical focusing) | Cell diameter, maximum height, and volume | 100 (also 2,000 counted) | Cells ordered in plane by sheath free fluid viscoelasticity |
| Vercruysse et al. 2015 [23] | Fixed lysed whole blood (granulocytes, monocytes and lymphocytes) | Cell diameter and granularity | 1,000 per sample <10,000 total | Compact lens-free in-line holographic microscope – line of cells |
| Present Study | Breast cancer cell lines (MDA-MB-231 and MCF7) and ovarian cancer cell line +/− drug resistance | Cell diameter and maximum intensity | 0.1 million cells per sample | Recording time 10 seconds in bulk flow |
Despite these very recent advances to analyse cells in flow, a major gap exists in terms of characterizing a large population of cells, i.e. ≥ 105 cells. Studies listed in Table 1 have not focused on large-scale phenotyping of cells, as most of the studies analysed one-dimensional trains of cells in smaller image volumes, thereby fingerprinting a small number of cells. Large-scale phenotyping of cells is especially important in cancer research, where a minority of diseased cells need to be identified among a background of other cell types, for example, in tumor biopsies, pleural effusions and fine-needle aspirates [32, 33]. Moreover, tumor cells are known to be heterogeneous, necessitating large-scale cellular phenotyping to determine sub-populations. A similar need exists for identifying drug resistant tumor cells in patient samples.
Optical advances have significantly increased the throughput and resolution achievable by holographic techniques. For example, the inline DHM reported in [34–37] achieves large field of view with a lens-less in line approach and has demonstrated high resolution images of cells, pathogens and worms in a portable, cost effective configuration. Similarly, a new technique [38, 39] using off-axis DHM provides imaging with unlimited field-of-view by generating synthetic interferograms of objects in flow. This technique can be used to achieve high throughput imaging of cells in flow.
Here we introduce a second, complementary approach to achieve large-scale fingerprinting capabilities by applying a well-established optical configuration to record simple, but useful, optical signatures characterizing tumor cell in bulk flow. We quantify the in-focus scattered intensity and size of tumor cells, and use these metrics to fingerprint cell populations. Given that large-scale sampling of cells may sacrifice accuracy in finger-printing, we study the effect of DHM recording parameters and evaluate the errors associated with our metrics. We then apply our methodology to enumerate tumor cells in bulk flow. Finally, we illustrate the benefits of our method with two demonstrative applications – first is to characterize tumor cell lines with different metastatic potential, and the second is to distinguish drug resistant tumor cells from their normal counterparts.
2. Theoretical background
The finger-printing of cells i.e. determination of diameter and axial and transverse intensity profiles of focused images of cells in bulk flow using inline-DHM involves the following steps: (i) the sequence of holograms of cells is recorded by a CMOS camera and stored in a computer, (ii) the holograms are reconstructed numerically and images of cells are generated in full volume, (iii) the cells are characterized i.e. x, y, and z coordinates of cells at their best focus in the reconstruction volume are determined. Thereafter, finger-printing of cells is carried out. In the following sections, the recording of holograms, their numerical reconstruction, and characterization and finger-printing of the cell image field using inline-DHM are discussed.
2.1 Hologram recording
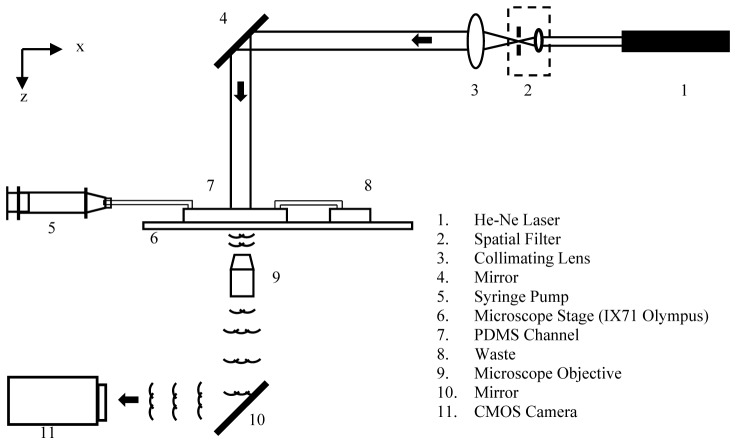
The present study uses an inline configuration of digital holography microscopy (Fig. 1). The sample volume is illuminated by a collimated beam of laser light. The scattered light (object beam) and the non-scattered light (reference beam) interfere in an imaginary plane (focal plane of the microscope objective) that is located close to - but outside - the imaged sample volume. The hologram is magnified by the microscope objective and imaged onto a CCD sensor. The magnification of the hologram allows imaging of microscopic fringes generated by micron-sized beads and cells. The intensity of the hologram on the focal plane of the microscope objective is denoted by.
Fig. 1.
Schematic layout of the inline Digital Holography Microscopy setup.
2.2 Numerical reconstruction
The plane-wise 3D numerical reconstruction of cell images in the full sample volume from the 2D digital hologram is carried out using the angular spectrum method [40–42]. This method does not involve the Fresnel approximation. The complex amplitude of a reconstructed image on each plane is obtained by convolving the hologram function with the impulse response function as:
| (1) |
In the above expression, and x, y and are the spatial coordinates in the hologram and reconstructed image planes respectively, and z is the depth wise reconstruction distance. The complex amplitude of the reconstructed image in Eq. (1) can be effectively calculated by employing a fast Fourier transform (FFT) as follows:
| (2) |
where, and denote the FFT and inverse FFT respectively. The focused image of each bead or cell in the reconstruction volume can be obtained from three-dimensional intensity distribution of reconstructed image which can be obtained from Eq. (2) as follows [42]:
| (3) |
It may be noted that the obtained reconstructed image is not magnified compared to the recorded object as the image is reconstructed from the original hologram (non-magnified).
2.3 Procedure for fingerprinting beads and tumor cells
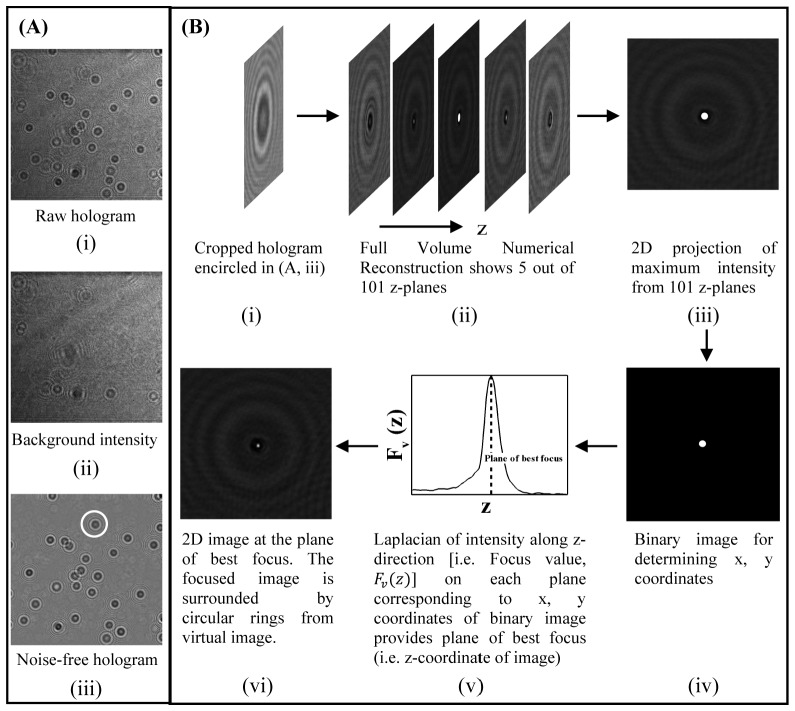
The numerical reconstruction of each hologram provides the intensity distribution at various transverse planes over the full reconstruction volume. The gradient of axial intensity of the cell (or bead) inside the reconstruction volume is used to determine its plane of best focus. The following steps are used to determine the particle location, size, and peak value of intensity in the focused image (see Fig. 2):
Fig. 2.
The procedure for fingerprinting of beads and tumor cells using inline-DHM is outlined: (A) shows the background correction of a representative raw hologram of polystyrene beads (i). The background hologram (ii) is generated for each raw hologram by averaging the 100 raw holograms centered around the hologram being processed. The noise-free hologram (iii) is generated by dividing pixel by pixel intensities of (i) by (ii). (B) shows the procedure for the numerical reconstruction of each bead or cell.
-
1.
The background noise from every hologram is eliminated prior to its reconstruction. In the present study, the background noise is generated for each raw hologram by averaging the 100 raw holograms centred around the hologram being processed. The pixel intensity at given location in each hologram is then divided by the background intensity to obtain the noise-free hologram. Figure 2(A) shows a sample raw hologram, the background noise and noise-free hologram.
-
2.
Numerical reconstruction is pursued on the noise-free hologram using Eqs. (2) and (3) to obtain the intensity distribution in the full image volume. Figure 2(Bi) shows the hologram of a bead cropped from the noise free hologram in Fig. 2(Aiii). Figure 2(Bii) demonstrates the depth-wise numerical reconstruction of the full volume in which the bead is located.
-
3.
All images in the reconstruction volume are projected on a 2D image. Figure 2(Biii) shows the 2D image obtained by projecting the maximum intensity value of each pixel along the z-direction from all images in the full reconstruction volume of Fig. 2(Bii).
-
4.
The projected 2D image is then converted into a binary image using a threshold value automatically calculated based on the signal-to-noise ratio of the reconstructed image as described in [45]. Figure 2(Biv) shows the binary image obtained from Fig. 2(Biii). The central x, y coordinates of the bead are determined from the binary image using the morphological technique as described in [46].
-
5. Once the x and y coordinates are determined, the z coordinate of the bead/cell is determined using the intensity gradient along the z-direction in the reconstruction volume. The gradient of intensity along the z-direction, (), is determined using the Laplacian of intensity as follows [16]:
(4) Where, the summation is carried out over 3 × 3 pixels about the center of the bead/cell image on each reconstruction plane. The location where the focus value (z) shows the maximum is the plane of best focus of the bead, as shown in Fig. 2(Bv).
-
6.
Once the best focus plane is located in the reconstruction volume, the fingerprinting i.e. size and intensity information of the bead/cell can be obtained. The size of the bead/cell is determined using the lateral intensity profile along the line passing through the center of the focused image. The distance between two minima about the central maxima provides the diameter of the bead/cell. The maximum value of intensity () corresponding to single bright pixel in the focused image as shown in Fig. 2(Bvi) is recorded, and taken as a second signature of each bead or cell.
-
7.
We implemented this procedure in MATLAB. Using the desktop computer (Intel(R) Core (TM) i7-4790 @ 3.60GHz, RAM: 8.00GB) it takes 1.94 hours to analyze 1000 holograms.
The above steps were used to determine the metrics used in this study. Two additional considerations warrant discussion:
First, the effect of channel walls on the intensity of focused image of cells. In this study, the channel walls are transparent, flat and smooth. Therefore, top and bottom walls don’t affect the signal unlike in the study of [20] where the bottom wall is structured. But, sidewalls might deteriorate the signal due to the interference patterns generated by the difference in the index of refraction between sidewall and nearby fluid. To minimize the effect on determination of intensity of focused images of cells, the static pattern near the wall was removed by dividing each hologram intensity with the background intensity and those cells which fall within 25µm (slightly higher than average cell diameter) from each sidewall have been excluded in the analysis.
Second, the present research work aims to characterize non-adherent, slightly nonspherical cells that might cause them to roll as they are flowing the channel. We observed the intensity of cell images at different x-locations (i.e. along the trajectory of the cell) doesn’t vary significantly and remains within 10% variation. Therefore, the intensity of light scattered from these cells included in this study in the forward direction is not expected to be significantly affected by the orientation or random rolling of the cells.
3. Materials and methods
3.1 Planar test target and bead samples
In the present study, polystyrene beads (Polyscience Inc., NIST traceable polystyrene beads) of size, D = 15.13µm ± 6%, and of stock concentration of 1 vol% in water have been used. The bead samples were made by mixing water (1mL) and stock suspension (20µL). This sample was used in bulk flow to validate DHM measurements of particle size and maximum intensity. We also used the same sample to prepare the planar test target to study the influence of recording parameters and evaluate errors. The planar test target was prepared by sandwiching 10µL of the bead sample between two cover slips (24mm × 50mm × 0.17mm; Thermo Scientific) separated by the same coverslips as spacers.
3.2 Tumor cell and culture
Breast tumor cell lines MDA-MB-231 (passage 9, purchased from ATCC, Manassas, VA) and MCF-7 (passage 10, provided by Dr. Lauren Gollahon at Texas Tech University) were cultured in DMEM media supplemented by 10% fetal bovine serum (FBS), 1% penicillin-streptomysin solution (Gibco) and 1nM sodium pyruvate. Ovarian cancer cell line SKOV-3 and matching paclitaxel-resistant clone, SKOV-3-TR were the generous gift of Dr. Xinli Liu at College of Pharmacy, University of Houston, Texas [43]. SKOV-3 cells were grown in McCoy’s 5A medium supplied with 10% FBS; SKOV-3-TR cells were maintained in the same medium containing 0.75mM of paclitaxel for two weeks culture prior to imaging. Immediately prior to DHM imaging, adherent cultured cells were detached by incubating with trypsin/EDTA solution, neutralized with serum and resuspended in phosphate buffered saline. Cells were filtered through a 30µm pre separation filter (Miltenyi Biotec) and adjusted to the designated concentrations by further dilution with phosphate buffered saline.
3.3 Microfluidic device fabrication and operation
The microfluidic channels of width, , and height, , were fabricated using soft lithography [44]. Negative photoresist (SU-8 2050) were used to make the mold. Polydimethyl siloxane (PDMS) prepolymer and curing agent were mixed in a 10:1 ratio, degassed, poured on the mold and cured for a minimum of two hours at 65° C. The PDMS replica was cut with a scalpel and peeled. Inlet and outlet reservoirs were defined by punching holes and the channel was irreversibly bonded to a glass slide 25mm × 75mm × 1mm; Fisher) after exposing the bonding surfaces of the PDMS device and glass slide to plasma for 2 minutes.
3.4 Digital holography microscopy setup
Figure 1 shows the schematic of the front view of the inline-DHM experimental arrangement which consists of a laser, a spatial filter and collimator assembly, and an inverted optical microscope (IX-71, Olympus Inc.). A He-Ne laser (10mW, λ = 0.6328µm, Thorlabs) is used as a light source, operating in continuous wave (CW) mode. The laser beam is filtered and expanded by a spatial filter assembly consisting of a pinhole (25µm diameter) and a microscope objective (10x, NA = 0.25; Thorlabs). The expanded beam is then collimated using a plano-convex lens (focal length, f = 100mm, Thorlabs). The diameter of the collimated beam is approximately 5mm. This collimated beam of laser light illuminates cells or beads flowing in the microfluidic channel. The flow through the channel is generated by a syringe pump (KD Scientific). The cross-sectional dimensions of the channel are 1000(y) × 350(z) µm2. The 2D hologram of cells or beads is generated in the focal plane of the microscope objective (M = 10x, NA = 0.25 and M = 20x, NA = 0.40; Thorlabs) of the optical microscope. The magnified image of the hologram is recorded on a CMOS camera (Phantom v310, Vision Research) at a resolution of 512x512 (20µm/pixel) and 12-bit gray level quantization. The recoded holograms were transferred to a computer for numerical reconstruction and data analysis. Table 2 presents the experimental parameters used in this study.
Table 2. The experimental parameters used to capture sequence of holograms of cells using DHM.
| Parameters | Values | |
|---|---|---|
| Concentration of cells, C | 0.3 million per mL | |
| Channel dimensions | 1mm (x) × 1mm (y) × 0.35 mm (z) | |
| Microscope magnification, M | 10x, 20x | |
| Pixel size | 20 µm | |
| Pixel number per frame | 512 × 512 | |
| Frame rate, F | 100 fps | |
| Flow rate, Q | 1400 µL/min | |
| Volume of sample imaged per frame | 0.35µL | |
| Number of cells imaged per frame | 105 | |
| Number of frames analyzed in each sample | 1000 | |
| Number of beads/cells analyzed in each sample | 105,000 |
4. Results and discussion
4.1 Influence of DHM recording parameters and evaluation of errors
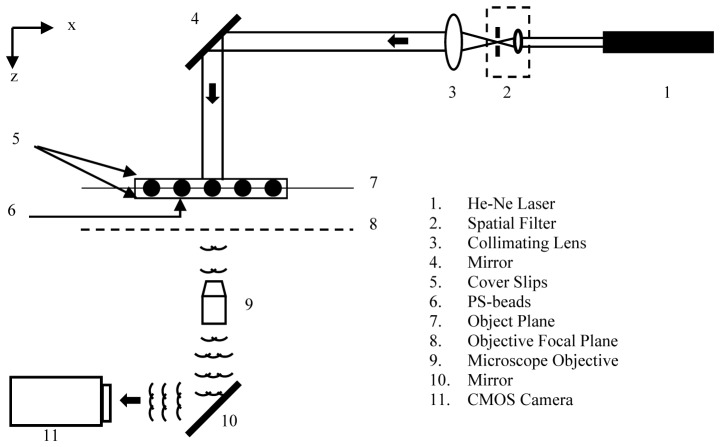
In this section, the effect of the recording distance and the magnification of the microscope objective on the accuracy of the axial position, size, and peak intensity of beads in the focused image is determined. We used the planar test target consisting of a monolayer of polystyrene beads (see Fig. 3) to optimize the operating conditions and quantify the errors on the metrics used for fingerprinting. The holograms of beads at two magnifications, M = 10x and 20x, were recorded at different z values in the range 200 - 1000µm. Each hologram image was reconstructed at 200 planes with a 2µm interval between successive planes.
Fig. 3.
Optical arrangement for optimization of DHM recording parameters and evaluation of errors, using a planar test target of polystyrene beads. The recording distance is measured from the z = 0 position. The z = 0 position is defined as the location of the focal plane of microscope objective when the image is sharp and consists of bright centers of the beads surrounded by dark edges.
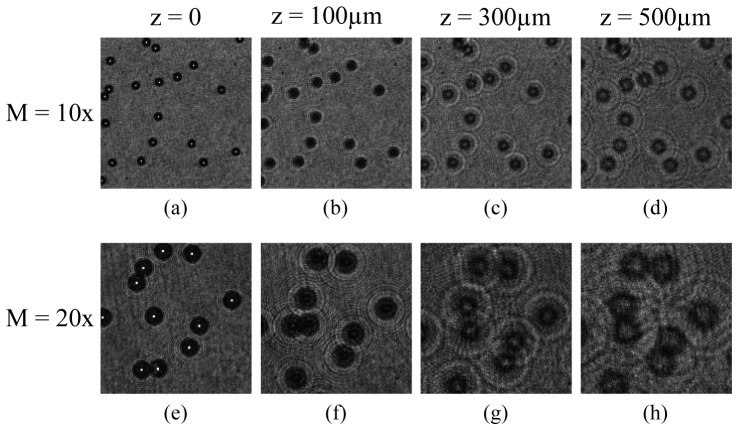
Figure 4 demonstrates qualitatively the effect of recording distance and magnification of microscope objective on interference pattern of beads. Three observations can be made from the images shown. First, at recording distance z = 0, the images of beads appear as bright spots at the centre with sharp outer boundaries because beads fall on the focal plane of the objective. Second, as the recording distance increases, circular fringe patterns appear which grow and expand outward with increase in the recording distance. The outward expansion of circular fringes introduces loss of high frequency information at the edge of the recording sensor. Third, as the magnification increases the numerical aperture of system increases which results in gain in high frequency information. Also, the fringes are more resolved at higher magnification. We expect that the gain in resolution and high frequency information at 20x magnification improves the axial accuracy of reconstructed images of beads compared to 10x magnification.
Fig. 4.
Digital holograms of static polystyrene beads of 15µm diameter, at magnifications of 10x [(a) – (d)] and 20x [(e) – (f)]. The recording distance from the focal plane of microscope objective is shown at the top of the first row of images.
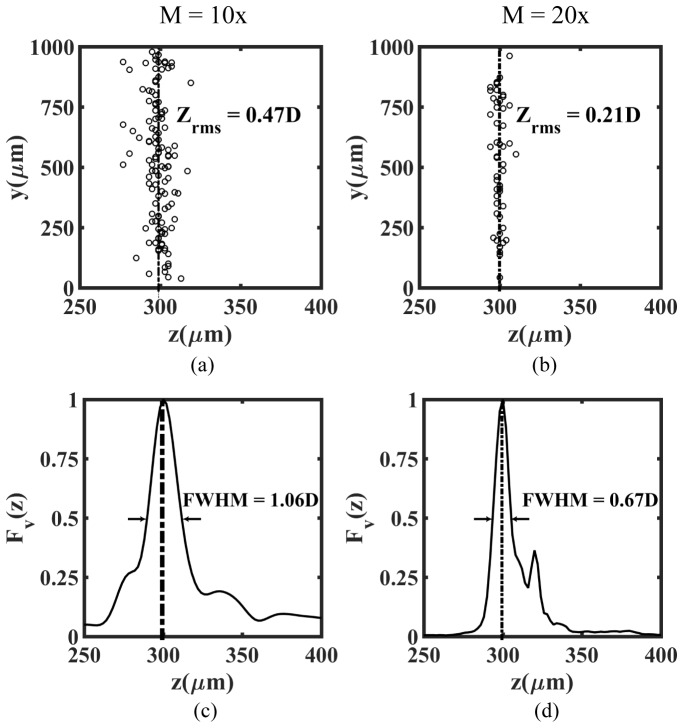
To demonstrate the effect of objective magnification on determining the axial location of beads, we use the holograms recorded at z = 300µm as a representative case, and show the resulting analysis in Fig. 5. At both 10x and 20x magnification, data in Fig. 5(a) shows that the calculated average z-location is 300 µm, consistent with the actual z-location of the recorded holograms. In particular, Fig. 5(a) and 5(b) indicate that as magnification increases from 10x to 20x, the root mean square error in axial location () decreases from 0.47D to 0.21D, where D is the bead diameter. Similarly, Fig. 5(c) and 5(d) demonstrate that the full width at half maximum (FWHM) of axial profile of focus value (Fv) decreases from 1.06D to 0.67D. This indicates that as the magnification increases the error in determining the location of the best-focused z-plane decreases. The reason is that at higher magnification the numerical aperture of the system is higher which allows better resolution of the fringes as well as reduces loss of high frequency fringes.
Fig. 5.
Reconstructed axial positions (a, b) and ensemble average of axial intensity profile (c, d) of polystyrene beads in the planar test target, evaluated at magnifications of 10x (a, c) and 20x for the representative case of . The number of beads analyzed is, N = 120 and 55 at magnification 10x and 20x respectively. The root mean square error in determining axial position () is 0.47D and 0.21D at 10x and 20x magnification respectively. Likewise the full width at half maximum (FWHM) values of the axial intensity profile are 1.06D and 0.67D corresponding to 10x and 20x respectively. Here D is the mean diameter of the beads.
Figure 6 extends the analysis performed in Fig. 5 across the entire z-range and illustrates the effect of recording distance and magnification on axial accuracy of reconstructed images of beads. We find that the error in axial position () generally tends to increase with the increase in recording distance (z). This is due to increasing loss of high frequency fringes and decrease in numerical aperture of the system with increase in recording distance. In addition, similar to the result in Fig. 4, we observe that across the entire z-range, the error in determining the axial position is lower for higher magnification. Finally, when the recording distance varies from z = 100 – 500µm, we find that the axial error is minimal, with approximately 0.5D and 0.25D at 10x and 20x magnification respectively.
Fig. 6.
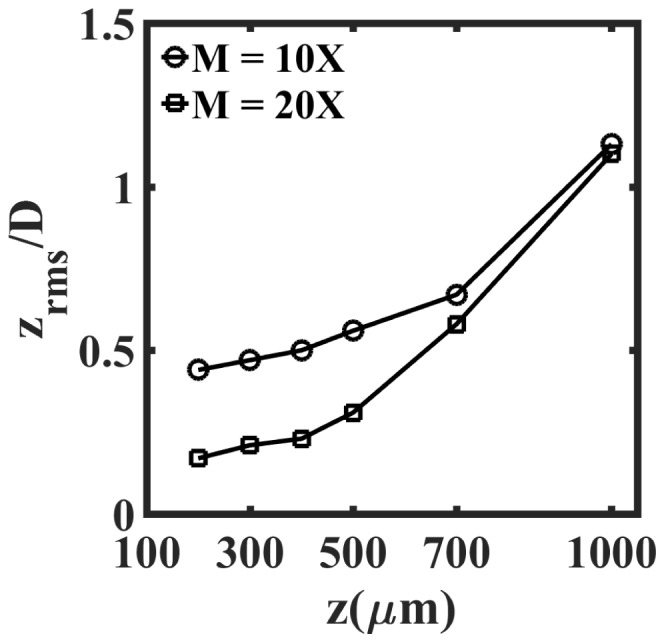
Influence of recording distance and magnification on the error in locating the axial position of beads in the planar test target sample. Here is the root mean square error in the axial position, normalized with the mean bead diameter, D.
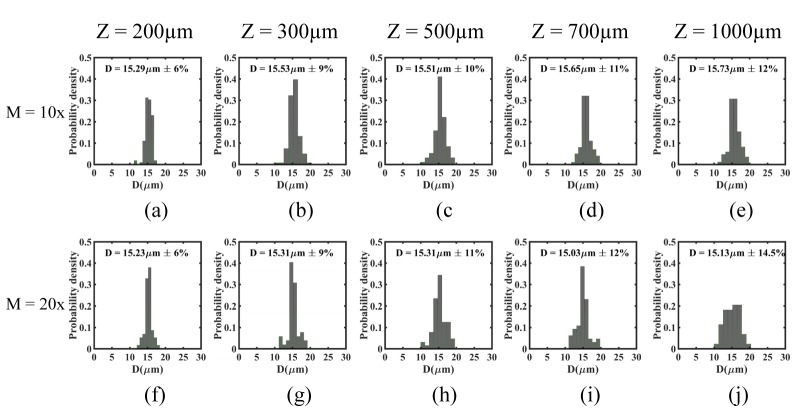
Next, we evaluated the influence of recording distance and objective magnification on the errors associated with determining bead size. As shown in Fig. 7, we find that the average bead diameter obtained from reconstructed images at both magnifications is in excellent agreement with the actual diameter reported for the polystyrene beads. Furthermore, we observe that the error calculated from the diameter distribution does not vary significantly with magnification but tends to increase with the recording distance. This increase in error with recording distance is most likely stemming from the error in determining the axial location of the beads (c.f. Fig. 6).
Fig. 7.
The distribution of polystyrene bead diameter calculated at different recording distances, z = 200, 300, 500, 700, and 1000µm and at magnifications, M = 10x and 20x. The inset shows the mean diameter (D) and coefficient of variance (CV). The manufacturer reported D and CV is 15.13 µm and 6% respectively.
In addition to determining the influence of recording distance and objective magnification on bead size, we also investigated the effect of these two parameters on the maximum intensity () calculated from reconstructed images. Table 3 shows the mean value () of at each recording distance is higher for higher magnification due to higher numerical aperture of later. In addition, we find that the coefficient of variance (CV) is close to 30% for all recording distances. It does not vary significantly from recording distance z = 200µm to 500µm but, it increases slightly for z > 500µm at both magnifications.
Table 3. The distribution of maximum intensity [] corresponding to single pixel of core of focused image of beads in the reconstruction volume at different recording distances, z = 200, 300, 500, 700, and 1000µm and at magnifications, M = 10x and 20x where, CV is coefficient of variance.
|
Magnification (M) |
Recording distance (z) (µm) |
||||
|---|---|---|---|---|---|
| 200 | 300 | 500 | 700 | 1000 | |
| 10x | 2.28 ± 27 | 2.31 ± 27 | 2.3 ± 30 | 2.07 ± 32 | 2.09 ± 39 |
| 20x | 14.5 ± 27 | 14 ± 28 | 14.17 ± 27 | 9.33 ± 31 | 6.93 ± 35 |
In general, the high CV observed in the analysis of maximum intensity can be attributed to several factors including polydispersity in particle size, axial error in determining particle centroid, Gaussian profile of illuminating light, spatial distribution of beads and local variation of refractive indices of beads [47]. A previous study [48] had showed that, where S is the forward scattering intensity collected within a 2° angle, for particles with a refractive index greater than 1.52 and suspended in water This indicates that the forward scattered light has cubic power dependence on the size of the beads. Given that our beads have a CV of 6%, this relation predicts that the associated CV in scattered intensity is 19%. Thus, the high CV observed in can be attributed to particle size variations in the sample. In addition, we have evaluated from a single pixel intensity. As a result, we expect some of the error in is associated with the axial error in determining the particle z-location. In fact, when we obtain by averaging a 3 × 3 pixel area, we find that the CV reduces by ~5%.
In summary, our results show that the recording distance of z = 200 – 500µm is optimal for having reduced errors in the axial position, diameter and maximum intensity of polystyrene beads. This finding suggests that for studying particles and cells in bulk flow, our choice of a microchannel height of 350µm is well suited. Furthermore, since increasing magnification from 10x to 20x reduces only marginally the errors in our measured parameters, we have chosen 10x magnification for our bulk flow studies, as it provides a larger field of view for fingerprinting a greater number of cells.
4.2 Enumeration of tumor cells in bulk flow
Accurate enumeration of cells in bulk flow is integral to quantitative cell characterization via DHM. In the present study, the bulk flow is laminar in the rectangular channel. Therefore, it is possible that at a given flow and frame rate a given bead/cell might be imaged in more than one sequential frame which leads to multiple count of beads/cells. Since digital holographic microscopy provides x, y, and z coordinates of beads/cells from each frame therefore, each bead/cell can be correlated between sequential frames so that it can be determined if the bead/cell has been imaged in more than one sequential frames and multiple counts of beads/cells can be eliminated. In this section, we discuss how we eliminated multiple counts of cells recorded in sequential frames based on the correlation of each bead/cell up to certain sequential frames.
The beads/cells which enter the channel are imaged in sequential frames till they cross the length of entire frame. The number of sequential frames (SF) in which beads are imaged depends on the velocity of beads (vx, y, z), length of the frame (L), and frame rate (F) and can be calculated as,
| (5) |
For our experimental conditions (see Table 2), L = 1mm and F = 100s−1. At the centerline (y = 0), 10% from the wall (y = 0.45 mm) and 6% from the wall (y = 0.47 mm), the velocity of beads (for Q = 1400μL/min) are; , , respectively (see Fig. 8(a)). Using Eq. (5), the number of sequential frames corresponding to these velocities are, respectively. Therefore, we estimate that all the beads having velocity in between 126.5 to 51.76mm/s (90%) and 51.76 to 35.13mm/s (4%) will be imaged till second and third sequential frames. Overall, our simple analysis indicates that 94% beads will be imaged by considering up to the third sequential frame.
Fig. 8.
The process elimination of multiple counts and accurate enumeration of beads/cells in bulk flow using correlation of coordinates of beads/cells between sequential frames is demonstrated. The laminar velocity profile along x-direction () across the width of rectangular channel (y) and at depth z = 0 is shown in (a). The ratio of number of beads after and before elimination of multiple counts () between sequential frames (SF) is shown in (b) and (c) corresponding to PS-beads and MCF7 cells respectively at three different concentrations (C) of beads/cells. The concentration (C) of beads is, and MCF7 cells is, .
Figure 8 shows the experimental results enumerating polystyrene beads and MCF-7 cells at three different concentrations (C). We find that SF = 2 is the optimal number of sequential frames that allows ≈100% enumeration of the beads/cells at all three concentrations. For SF > 2, the output count falls below the input count, whereas at SF < 2, the enumeration is significantly more than 100% due to multiple counts. In particular, for SF ≠ 2, the mismatch between the output and input counts is worst for the highest concentration of beads and cells tested. We note that our calculated SF value of 3 (from Eq. (5) overestimates the optimal experimental value of 2, due to the fact that beads are depleted very close to the wall, for example at y = 0.47 mm, beads of 15 µm diameter will be excluded because of overlap of diffraction pattern from channel wall and the beads. As a result of this excluded volume, SF = 2 is sufficient to enumerate all the particles without the need to resort to SF = 3 to capture the very slow-moving near-wall particles.
4.3 Fingerprinting of tumor cells in bulk flow
In this section, we present two proof-of-principle studies demonstrating the utility of our inline-DHM methodology for label-free fingerprinting of cells in bulk flow. The first demonstration is applying DHM to characterize breast tumor cell lines with different metastatic potentials, and the second is distinguishing drug resistant tumor cells from their normal counterparts. Figure 9 shows holograms corresponding to the breast tumor cells and normal & drug resistant ovarian tumor cells.
Fig. 9.
The holograms of size 64 × 64 pixels2 cropped from original raw holograms corresponding to (a) MDA-MB-231, (b) MCF7, (c) SKOV-3, and (d) SKOV-3-TR cells.
In these studies, we introduce two metrics, cell diameter and maximum intensity (), to characterize the given cell populations. For each cell line (and beads), 1000 reconstructed holograms were acquired using the same illumination of light, flow rate, frame rate, and channel dimensions (see Table 2). We demonstrate that under these conditions, we can characterize more than 100,000 cells from 10 seconds of imaging of bulk flow.
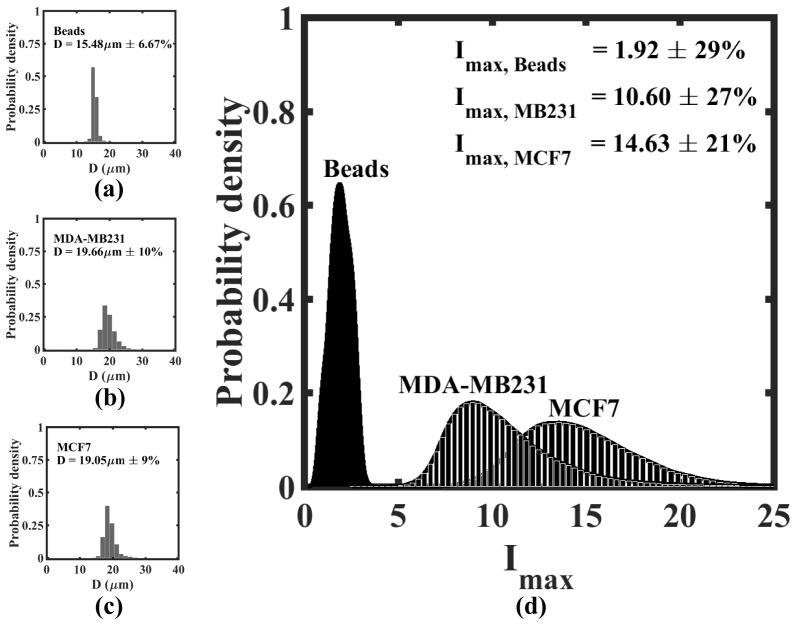
We first evaluated the accuracy of DHM characterization in bulk flow by measuring the size distribution of polystyrene beads and comparing it to manufacturer data and results from planar test target experiments. Figure 10(a) shows the diameter distribution for polystyrene beads measured in bulk flow. We find that the mean diameter of the beads obtained is . This value obtained from reconstructing the images taken in bulk flow is in good agreement with that of manufacturer reported diameter (D = 15.13µm ± 6%), and static measurements (see Fig. 7(b)). The good agreement obtained under static and flow conditions validates the digital refocusing along the entire depth of the microfluidic channel.
Fig. 10.
High throughput DHM-based fingerprinting of beads and tumor cells of different metastatic potential in bulk flow. The size distribution for polystyrene beads and breast tumor cells (MCF7 and MDA-MB-231) is presented in (a), (b), and (c) respectively. The maximum intensity distribution for the same systems is presented in (d). The inset shows the mean value and coefficient of variance [] for either the diameter (D) or maximum intensity ().
We extended the bulk flow analysis of polystyrene beads to characterization of two breast tumor cell lines, MCF-7 and MDA-MB-231. Evaluating these cell lines provides a starting point for application of DHM bulk characterization to heterogeneous tumor samples as both cell lines have been derived from human patients with breast cancer. However, whereas MCF7 cells are nonmotile and nonmetastatic, MDA-MB-231 cells are highly metastatic both in vitro [49] and in vivo [50] representing a clinically challenging hormone independent cancer population. We find that the populations of MDA-MB-231 and MCF7 cells have similar size distributions with a mean diameter and coefficient of variance of 19.66µm ± 9% and 19.05µm ± 10% respectively (Figs. 10(b), 10(c)). The distributions for the two cell lines shown in Fig. 9(d) are much broader than that of the beads, indicating the significant heterogeneity in the tumor cell population for both cell lines. Importantly, the distribution for MDA-MB-231 is statistically different from that of MCF-7 cells (p-value < 0.05, obtained from the two sample student t-test at 95% confidence interval), even though some portion of the distributions overlap. Thus, comparing average populations, DHM is capable of distinguishing breast tumor cell lines of different metastatic potential.
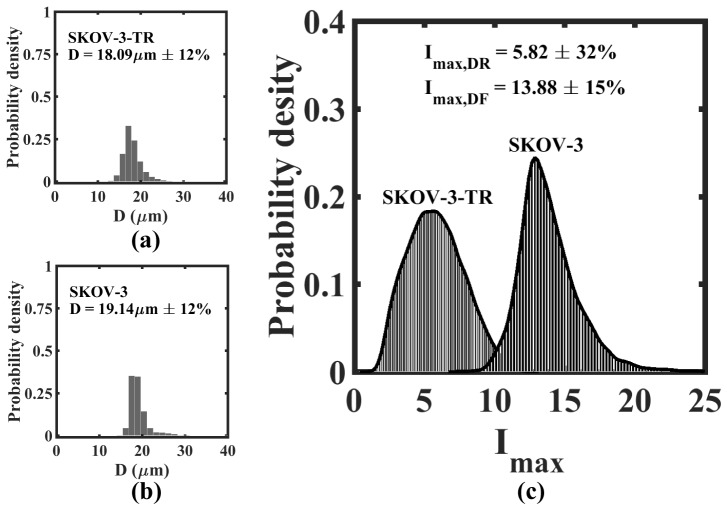
We also tested the capability of DHM to distinguish a cancer cell line that is drug resistant compared to its normal counterpart. SKOV-3 is a parent ovarian cancer cell line and SKOV-3-TR is the drug resistant variant of this parent cell line. Here, it is useful to mention that SKOV-3-TR cells were obtained by repeated rounds of exposure and culture of SKOV-3 cells to the chemotherapy drug paclitaxel [43], thereby selecting for ovarian tumor cells that are tolerant to paclitaxel treatment. Figure 11 shows the size and distributions for these two cell lines. We observe that the mean diameter of SKOV-3-TR (D = 18.09µm ± 12%) is slightly lower than that of the SKOV-3 cells (D = 19.14µm ± 12%). In contrast, we find striking difference in the intensity distributions of these two cell lines (p < 0.01). Drug resistant ovarian cancer cells have markedly lower intensity that the parental cell line, demonstrating that inline-DHM can be useful tool for fingerprinting drug resistant cells in a tumor cell population. In addition, the high coefficient of variance of drug treated cells compared to untreated cells suggests non-uniform response to drug treatment and highlights the importance of recording single cell rather than averaged cell metrics.
Fig. 11.
High throughput DHM-based fingerprinting of ovarian cancer cells in bulk flow. SKOV-3 is the parental ovarian cancer cell line and SKOV-3-TR is its drug resistant variant. The size distribution for SKOV-3 and SKOV-3-TR is presented in (a) and (b) respectively. The maximum intensity distribution for the same systems is presented in (c). The inset shows the mean value and coefficient of variance [] for either the diameter (D) or maximum intensity ().
Overall, our results demonstrate that our approach is capable of large-scale phenotyping of more than 100,000 tumor cells based on size and maximum intensity. We note that maximum intensity can depend on size, shape and refractive index of the cell. In case of breast tumor cells, the size distribution of MCF-7 and MDA-MB-231 are very similar and the distributions are statistically distinguishable suggesting that their optical properties are also different. In case of ovarian cancer cells as well, the size distributions are not markedly different. However, the distributions are strikingly different suggesting that the optical characteristics of drug resistant cells is different from that of parental cells. We expect that higher refractive index increases the absorption and refraction of light passing through a cell and hence the scattered intensity is reduced. Given that both MDA-MB-231 and SKOV-3-TR cells have lower than MCF-7 and SKOV-3 cells, respectively, we hypothesize that they have a higher integral refractive index compared to their tested counterparts. Measurements of integral refractive indexes of the cell lines used in the study are needed to corroborate our hypothesis.
Here we have shown differentiation of the population averages of cells having distinct metastatic potential and robust, single-cell resolution of cell populations having different levels of drug resistance. We expect that by integrating developing optical approaches [38,39], we might extend the characterization of cells in bulk flow presented here to include more refined metrics allowing increased single-cell resolution of a broad range of clinically relevant subpopulations.
5. Conclusions
Our results support the broad application of inline-DHM for characterizing cells in bulk flow. Although size is a well-established metric, we introduce maximum pixel intensity as a useful metric able to differentiate drug resistant cells from the parent cell line. This approach differs from prior methods that depend on high magnification [23] or absolute measures of refractive index [5,40,51,52] and are inherently low throughput. Our approach relies on comparatively coarse metrics, but substantially higher throughput that is still able to direct interesting biological observations. It is possible to increase the throughput further by technical improvements such as increasing camera speed, particle flow rate, camera field of view and channel dimensions as well as integrating the approaches for cell characterization in bulk flow presented here with ever improving light sources and optical configurations. In parallel, efforts are also needed to establish additional metrics from the hologram images and accelerate the computational analysis to achieve sample-in and answer-out capability.
With regards to cancer diagnostics and prognosis, our single cell, high throughput approach is particularly relevant since cancer is driven by mutations leading to large numbers of tumor cells having significant heterogeneity. Coupled with ever-improving optics, bulk-flow DHM approaches have the potential to better characterize and quantify diverse cancer cell populations, which is expected to direct therapeutic approaches and improve disease outcomes.
Acknowledgments
Authors thank Dr. Xinli Liu at College of Pharmacy, University of Houston, Texas for providing the ovarian cancer cell lines. Authors also thank Jacqueline Berry for assistance with experiments. Useful discussions with Dr. Jian Sheng and Dr. Vinothan Manoharan on the development of digital holography microscopy for cellular characterization is gratefully acknowledged.
Funding
Cancer Prevention and Research Institute of Texas (CPRIT) (RP140840).
References and links
- 1.Boutros M., Heigwer F., Laufer C., “Microscopy-based high-content screening,” Cell 163(6), 1314–1325 (2015). 10.1016/j.cell.2015.11.007 [DOI] [PubMed] [Google Scholar]
- 2.Goda K., Ayazi A., Gossett D. R., Sadasivam J., Lonappan C. K., Sollier E., Fard A. M., Hur S. C., Adam J., Murray C., Wang C., Brackbill N., Di Carlo D., Jalali B., “High-throughput single-microparticle imaging flow analyzer,” Proc. Natl. Acad. Sci. U.S.A. 109(29), 11630–11635 (2012). 10.1073/pnas.1204718109 [DOI] [PMC free article] [PubMed] [Google Scholar]
- 3.Fang Y., “Label-free drug discovery,” Front. Pharmacol. 5, 52 (2014). 10.3389/fphar.2014.00052 [DOI] [PMC free article] [PubMed] [Google Scholar]
- 4.Alm K., El-Schich Z., Falck M., Gjrloff Wingren A., Janicke B., Oredsso S., “Cells and Holograms – Holograms and Digital Holographic Microscopy as a Tool to Study the Morphology of Living Cells” in Holography - Basic Principles and Contemporary Applications, Mihaylova E., ed. (InTech, 2013). [Google Scholar]
- 5.Rappaz B., Barbul A., Emery Y., Korenstein R., Depeursinge C., Magistretti P. J., Marquet P., “Comparative study of human erythrocytes by digital holographic microscopy, confocal microscopy, and impedance volume analyzer,” Cytometry A 73(10), 895–903 (2008). 10.1002/cyto.a.20605 [DOI] [PubMed] [Google Scholar]
- 6.Anand A., Chhaniwal V. K., Patel N. R., Javidi B., “Automatic Identification of Malaria-Infected RBC With Digital Holographic Microscopy Using Correlation Algorithms,” IEEE Photonics J. 4(5), 1456–1464 (2012). 10.1109/JPHOT.2012.2210199 [DOI] [Google Scholar]
- 7.Moon I., Javidi B., Yi F., Boss D., Marquet P., “Automated statistical quantification of three-dimensional morphology and mean corpuscular hemoglobin of multiple red blood cells,” Opt. Express 20(9), 10295–10309 (2012). 10.1364/OE.20.010295 [DOI] [PubMed] [Google Scholar]
- 8.Jaferzadeh K., Moon I., “Quantitative investigation of red blood cell three-dimensional geometric and chemical changes in the storage lesion using digital holographic microscopy,” J. Biomed. Opt. 20(11), 111218 (2015). 10.1117/1.JBO.20.11.111218 [DOI] [PubMed] [Google Scholar]
- 9.Seo S., Isikman S. O., Sencan I., Mudanyali O., Su T. W., Bishara W., Erlinger A., Ozcan A., “High-throughput lens-free blood analysis on a chip,” Anal. Chem. 82(11), 4621–4627 (2010). 10.1021/ac1007915 [DOI] [PMC free article] [PubMed] [Google Scholar]
- 10.Boudejltia K. Z., Ribeiro de Sousa D., Uzureau P., Yourassowsky C., Perez-Morga D., Courbebaisse G., Chopard B., Dubois F., “Quantitative analysis of platelets aggregates in 3D by digital holographic microscopy,” Biomed. Opt. Express 6(9), 3556–3563 (2015). 10.1364/BOE.6.003556 [DOI] [PMC free article] [PubMed] [Google Scholar]
- 11.Rappaz B., Breton B., Shaffer E., Turcatti G., “Digital holographic microscopy: a quantitative label-free microscopy technique for phenotypic screening,” Comb. Chem. High Throughput Screen. 17(1), 80–88 (2014). 10.2174/13862073113166660062 [DOI] [PMC free article] [PubMed] [Google Scholar]
- 12.Pavillon N., Kühn J., Moratal C., Jourdain P., Depeursinge C., Magistretti P. J., Marquet P., “Early cell death detection with digital holographic microscopy,” PLoS One 7(1), e30912 (2012). 10.1371/journal.pone.0030912 [DOI] [PMC free article] [PubMed] [Google Scholar]
- 13.Ekpenyong A. E., Man S. M., Achouri S., Bryant C. E., Guck J., Chalut K. J., “Bacterial infection of macrophages induces decrease in refractive index,” J. Biophotonics 6(5), 393–397 (2013). 10.1002/jbio.201200113 [DOI] [PubMed] [Google Scholar]
- 14.Falck Miniotis M., Mukwaya A., Gjörloff Wingren A., “Digital holographic microscopy for non-invasive monitoring of cell cycle arrest in L929 cells,” PLoS One 9(9), e106546 (2014). 10.1371/journal.pone.0106546 [DOI] [PMC free article] [PubMed] [Google Scholar]
- 15.Tian L., Loomis N., Domínguez-Caballero J. A., Barbastathis G., “Quantitative measurement of size and three-dimensional position of fast-moving bubbles in air-water mixture flows using digital holography,” Appl. Opt. 49(9), 1549–1554 (2010). 10.1364/AO.49.001549 [DOI] [PubMed] [Google Scholar]
- 16.Choi Y.-S., Lee S.-J., “Three-dimensional volumetric measurement of red blood cell motion using digital holographic microscopy,” Appl. Opt. 48(16), 2983–2990 (2009). 10.1364/AO.48.002983 [DOI] [PubMed] [Google Scholar]
- 17.Sheng J., Malkiel E., Katz J., “Digital holographic microscope for measuring three-dimensional particle distributions and motions,” Appl. Opt. 45(16), 3893–3901 (2006). 10.1364/AO.45.003893 [DOI] [PubMed] [Google Scholar]
- 18.Yu X., Hong J., Liu C., Kim M. K., “Review of digital holographic microscopy for three-dimensional profiling and tracking,” Opt. Eng. 53(11), 112306 (2014). 10.1117/1.OE.53.11.112306 [DOI] [Google Scholar]
- 19.Singh D. K., Panigrahi P. K., “Three-dimensional investigation of liquid slug Taylor flow inside a micro-capillary using holographic velocimetry,” Exp. Fluids 56(1), 1–15 (2015). 10.1007/s00348-014-1863-9 [DOI] [Google Scholar]
- 20.Evans H. B., Gorumlu S., Aksak B., Castillo L., Sheng J., “Holographic microscopy and microfluidics platform for measuring wall stress and 3D flow over surfaces textured by micro-pillars,” Sci. Rep. 6, 28753 (2016). [DOI] [PMC free article] [PubMed] [Google Scholar]
- 21.F. Merola, P. Memmolo, L. Miccio, R. Savoia, M. Mugnano, A. Fontana, G. D’Ippolito, A. Sardo, A. Iolascon, and A. Gambale, “Tomographic Flow Cytometry by Digital Holography,” Light Sci. Appl., accepted article preview 17 October 2016 (2016). [DOI] [PMC free article] [PubMed]
- 22.Won Seo K., Ran Ha Y., Joon Lee S., “Vertical focusing and cell ordering in a microchannel via viscoelasticity: Applications for cell monitoring using a digital holographic microscopy,” Appl. Phys. Lett. 104(21), 213702 (2014). 10.1063/1.4880615 [DOI] [Google Scholar]
- 23.Vercruysse D., Dusa A., Stahl R., Vanmeerbeeck G., de Wijs K., Liu C., Prodanov D., Peumans P., Lagae L., “Three-part differential of unlabeled leukocytes with a compact lens-free imaging flow cytometer,” Lab Chip 15(4), 1123–1132 (2015). 10.1039/C4LC01131G [DOI] [PubMed] [Google Scholar]
- 24.Merola F., Miccio L., Memmolo P., Di Caprio G., Galli A., Puglisi R., Balduzzi D., Coppola G., Netti P., Ferraro P., “Digital holography as a method for 3D imaging and estimating the biovolume of motile cells,” Lab Chip 13(23), 4512–4516 (2013). 10.1039/c3lc50515d [DOI] [PubMed] [Google Scholar]
- 25.Zetsche E. M., El Mallahi A., Dubois F., Yourassowsky C., Kromkamp J. C., Meysman F. J., “Imaging‐in‐Flow: Digital holographic microscopy as a novel tool to detect and classify nanoplanktonic organisms,” Limnol. Oceanogr. Methods 12(11), 757–775 (2014). 10.4319/lom.2014.12.757 [DOI] [Google Scholar]
- 26.Yourassowsky C., Dubois F., “High throughput holographic imaging-in-flow for the analysis of a wide plankton size range,” Opt. Express 22(6), 6661–6673 (2014). 10.1364/OE.22.006661 [DOI] [PubMed] [Google Scholar]
- 27.Sung Y., Lue N., Hamza B., Martel J., Irimia D., Dasari R. R., Choi W., Yaqoob Z., So P., “Three-Dimensional Holographic Refractive-Index Measurement of Continuously Flowing Cells in a Microfluidic Channel,” Phys. Rev. Appl. 1(1), 014002 (2014). 10.1103/PhysRevApplied.1.014002 [DOI] [PMC free article] [PubMed] [Google Scholar]
- 28.Sung Y., Lue N., Hamza B., Martel J., Irimia D., Dasari R. R., Choi W., Yaqoob Z., So P., “Three-Dimensional Holographic Refractive-Index Measurement of Continuously Flowing Cells in a Microfluidic Channel,” Phys. Rev. Appl. 1(1), 014002 (2014). 10.1103/PhysRevApplied.1.014002 [DOI] [PMC free article] [PubMed] [Google Scholar]
- 29.Sung Y., Lue N., Hamza B., Martel J., Irimia D., Dasari R. R., Choi W., Yaqoob Z., So P., “Three-Dimensional Holographic Refractive-Index Measurement of Continuously Flowing Cells in a Microfluidic Channel,” Phys. Rev. Appl. 1(1), 014002 (2014). 10.1103/PhysRevApplied.1.014002 [DOI] [PMC free article] [PubMed] [Google Scholar]
- 30.Zetsche E. M., El Mallahi A., Dubois F., Yourassowsky C., Kromkamp J. C., Meysman F. J., “Imaging‐in‐Flow: Digital holographic microscopy as a novel tool to detect and classify nanoplanktonic organisms,” Limnol. Oceanogr. Methods 12(11), 757–775 (2014). 10.4319/lom.2014.12.757 [DOI] [Google Scholar]
- 31.Won Seo K., Ran Ha Y., Joon Lee S., “Vertical focusing and cell ordering in a microchannel via viscoelasticity: Applications for cell monitoring using a digital holographic microscopy,” Appl. Phys. Lett. 104(21), 213702 (2014). 10.1063/1.4880615 [DOI] [Google Scholar]
- 32.Chang Q., Hedley D., “Emerging applications of flow cytometry in solid tumor biology,” Methods 57(3), 359–367 (2012). 10.1016/j.ymeth.2012.03.027 [DOI] [PubMed] [Google Scholar]
- 33.Truong K., Vielh P., Malfoy B., Klijanienko J., Dutrillaux B., Bourgeois C. A., “Fluorescence-based analysis of DNA ploidy and cell proliferation within fine-needle samplings of breast tumors: a new approach using automated image cytometry,” Cancer 84(5), 309–316 (1998). [DOI] [PubMed] [Google Scholar]
- 34.Bishara W., Zhu H., Ozcan A., “Holographic opto-fluidic microscopy,” Opt. Express 18(26), 27499–27510 (2010). 10.1364/OE.18.027499 [DOI] [PMC free article] [PubMed] [Google Scholar]
- 35.Bishara W., Su T.-W., Coskun A. F., Ozcan A., “Lensfree on-chip microscopy over a wide field-of-view using pixel super-resolution,” Opt. Express 18(11), 11181–11191 (2010). 10.1364/OE.18.011181 [DOI] [PMC free article] [PubMed] [Google Scholar]
- 36.Mudanyali O., Oztoprak C., Tseng D., Erlinger A., Ozcan A., “Detection of waterborne parasites using field-portable and cost-effective lensfree microscopy,” Lab Chip 10(18), 2419–2423 (2010). 10.1039/c004829a [DOI] [PMC free article] [PubMed] [Google Scholar]
- 37.Luo W., Greenbaum A., Zhang Y., Ozcan A., “Synthetic aperture-based on-chip microscopy,” Light Sci. Appl. 4(3), e261 (2015). 10.1038/lsa.2015.34 [DOI] [Google Scholar]
- 38.Bianco V., Paturzo M., Ferraro P., “Spatio-temporal scanning modality for synthesizing interferograms and digital holograms,” Opt. Express 22(19), 22328–22339 (2014). 10.1364/OE.22.022328 [DOI] [PubMed] [Google Scholar]
- 39.Bianco V., Paturzo M., Marchesano V., Gallotta I., Di Schiavi E., Ferraro P., “Optofluidic holographic microscopy with custom field of view (FoV) using a linear array detector,” Lab Chip 15(9), 2117–2124 (2015). 10.1039/C5LC00143A [DOI] [PubMed] [Google Scholar]
- 40.Kim M. K., “Principles and techniques of digital holographic microscopy,” J. Photonics for Energy 1, 018005 (2010). [Google Scholar]
- 41.Goodman J. W., Introduction to Fourier Optics (McGraw-Hill, New York: 1968). [Google Scholar]
- 42.Kreis T., Handbook of Holographic Interferometry Optical and Digital Methods (WILEY-VCH Verlag GmbH & Co., KGaA, 2005). [Google Scholar]
- 43.Wang X., Wu E., Wu J., Wang T. L., Hsieh H. P., Liu X., “An antimitotic and antivascular agent BPR0L075 overcomes multidrug resistance and induces mitotic catastrophe in paclitaxel-resistant ovarian cancer cells,” PLoS One 8(6), e65686 (2013). 10.1371/journal.pone.0065686 [DOI] [PMC free article] [PubMed] [Google Scholar]
- 44.Duffy D. C., McDonald J. C., Schueller O. J., Whitesides G. M., “Rapid prototyping of microfluidic systems in poly (dimethylsiloxane),” Anal. Chem. 70(23), 4974–4984 (1998). 10.1021/ac980656z [DOI] [PubMed] [Google Scholar]
- 45.Singh D. K., Panigrahi P. K., “Automatic threshold technique for holographic particle field characterization,” Appl. Opt. 51(17), 3874–3887 (2012). 10.1364/AO.51.003874 [DOI] [PubMed] [Google Scholar]
- 46.Singh D. K., Panigrahi P. K., “Improved digital holographic reconstruction algorithm for depth error reduction and elimination of out-of-focus particles,” Opt. Express 18(3), 2426–2448 (2010). 10.1364/OE.18.002426 [DOI] [PubMed] [Google Scholar]
- 47.Choi Y.-S., Lee S.-J., “High-accuracy three-dimensional position measurement of tens of micrometers size transparent microspheres using digital in-line holographic microscopy,” Opt. Lett. 36(21), 4167–4169 (2011). 10.1364/OL.36.004167 [DOI] [PubMed] [Google Scholar]
- 48.Mullaney P. F., Van Dilla M. A., Coulter J. R., Dean P. N., “Cell sizing: a light scattering photometer for rapid volume determination,” Rev. Sci. Instrum. 40(8), 1029–1032 (1969). 10.1063/1.1684143 [DOI] [PubMed] [Google Scholar]
- 49.Sommers C. L., Byers S. W., Thompson E. W., Torri J. A., Gelmann E. P., “Differentiation state and invasiveness of human breast cancer cell lines,” Breast Cancer Res. Treat. 31(2-3), 325–335 (1994). 10.1007/BF00666165 [DOI] [PubMed] [Google Scholar]
- 50.Coopman P. J., Do M. T., Barth M., Bowden E. T., Hayes A. J., Basyuk E., Blancato J. K., Vezza P. R., McLeskey S. W., Mangeat P. H., Mueller S. C., “The Syk tyrosine kinase suppresses malignant growth of human breast cancer cells,” Nature 406(6797), 742–747 (2000). 10.1038/35021086 [DOI] [PubMed] [Google Scholar]
- 51.Matrecano M., Paturzo M., Ferraro P., “Extended focus imaging in digital holographic microscopy: a review,” OPTICE 53(11), 112317 (2014). 10.1117/1.OE.53.11.112317 [DOI] [Google Scholar]
- 52.Liang A. L. X., Lim C., Ayi T., Yap P., “Determining refractive index of single living cell using an integrated microchip,” Sensor Actuat. A-Phys. 133, 349–354 (2007). [Google Scholar]


