

Abstract
Denitrifying anaerobic methane oxidizing (DAMO) microorganisms play an important role in the global carbon and nitrogen cycles as they are able to mediate methane oxidation using nitrite/nitrate under anoxic conditions. However, the physiological properties of DAMO microorganisms remain poorly understood, partially since the organisms are difficult to isolate or cultivate in pure culture and partially because of their long cultivation time. In this study, DAMO cell sorting has been conducted by integrating optical tweezers within enclosed microfluidic chips. This integrated cell sorting method has high purity, low infection rates, and causes no discernable harm to cell viability. The purity of the sorted cells was controlled by the microfluidic chip structure design and operation, while the cell viability was verified by imaging the cultured DAMO archaea after 420 days.
OCIS codes: (350.4855) Optical tweezers or optical manipulation, (020.7010) Laser trapping
1. Introduction
CH4 is a potent greenhouse gas with a global warming potential 25 times than that of CO2 over a span of 100 years [1]. Its emission and oxidation plays a critical role in global climate change. Until recently methane was considered to be inert under anoxic conditions, and the presence of oxygen was assumed to be necessary to activate it [2]. The discovery of denitrifying anaerobic methane-oxidizing (DAMO) microorganisms fundamentally changed our understanding of the methane cycle [3, 4]. DAMO bacteria have been reported to have the ability to biologically produce oxygen from nitrogen oxides, which may have had a considerable geochemical and evolutionary role on the early Earth [5]. DAMO archaea are capable of independent anaerobic methane oxidation through reverse methanogenesis using nitrate as the terminal electron acceptor. So far, the understanding of the DAMO metabolic blueprint is based on studies carried out on enriched DAMO microorganisms [3, 5]. However, the physiological properties of DAMO microorganisms remain poorly understood, partially since the organisms are difficult to isolate or cultivate as a pure culture. Further, it is not known if DAMO microorganisms require a symbiotic relationship with other microorganisms, or whether other microorganisms hinder their doubling rate.
Single-cell sequencing, a powerful method for studies of homogeneous cell populations, has been widely used in the biological and life sciences [6] to enable researchers to comprehensively understand the scale of genomic and transcriptomic diversity for an individual organism. However, in their natural environment, most microorganisms live in large heterogeneous populations. In many research applications the cells of interest are expensive or very difficult to produce, and purity is essential. Several techniques have therefore been developed to sort specific target cells from the heterogeneous mixtures to limit heterogeneity uncertainty in biological applications and in clinical medicine [7]. This isolation step that helps to obtain pure cultures can often be very difficult, but is arguably one of the most critical for single-cell sequencing.
Conventional cell sorting methods typically use fluorescence activated cell sorting (FACS) [8, 9] and/or magnetic activated cell sorting (MACS) [10, 11]. While both have high levels of throughput, they are limited in that the process is carried out in open devices, therefore the extrinsic contamination cannot be prevented, have limited compatibility with microscopy and microfluidic devices, and have exacting demands on chemical adhesion to the cells of interest. Pipetting and serial dilution can also be used, but again contamination and infection are common. Optical tweezers [12], which use optical gradient forces from a highly-focused laser beam, can be used to trap and manipulate single cells [13]. The piconewton-scale forces generated when an object is located less than ∼200 nm from the centre of the optical trap can be used to manipulate trapped objects without physical contact, and guide them to alternate locations. By integrating optical tweezers with enclosed microfluidic chips [14], the system becomes a closed platform that reduces the risk of infection and contamination [15, 16].
Several studies have investigated the use of optical forces on cells. For example, a microfluidic- based optical deflection cell sorter was applied to select a subpopulation of live, unstressed macrophages infected with Francisella Tularenis [17]; image processing has been used for target cell recognition and high purity sorting [18]; and optical stretching has shown that cancerous cells have a lower cell elasticity than healthy cells [19]. As a physical tool for cell sorting, published works using optical tweezers and microfluidic channels have reported the trapping and movement of target cells to a destination, while not demonstrating their future viability or use. In this paper, we design and fabricate a microfluidic chip, sort and collect target DAMO archaea cells using optical tweezers, cultivate DAMO cells, and demonstrate that they are still viable after 420 days of culture.
2. Equipment and methods
Preparation of DAMO mixed cultures
The mixed culture of DAMO archaea was cultured in a lab-scale bioreactor [20]. Fluorescence in situ hybridization (FISH) analysis [21], Fig. 1, revealed that the culture in this reactor was dominated by DAMO archaea, comprising 60-70% of the overall populations. The FISH image of the DAMO archaea (Candidatus ‘Methanoperedens nitroreducens’) further indicated that most of the target cells exist as sarcina-like clusters. Typically, DAMO archaea grows as irregular cocci 1–3 µm in diameter [3]. 5 mL of the heterogeneous DAMO culture were collected from the reactor, and dispersed using ultrasonic separation (50 W, 1 min). The dispersed sample was diluted 20 times with the buffer solution (composition: KH2 PO4, 0.075 g/L; CaCl2 ·2H2 O, 0.3 g/L; MgSO4 ·7H2 O, 0.2 g/L; acidic trace element solution, 0.5 mL/L, alkaline trace element solution, 0.2 mL/L [20]), resulting in a concentration of 105 − 108 cells/mL.
Fig. 1.
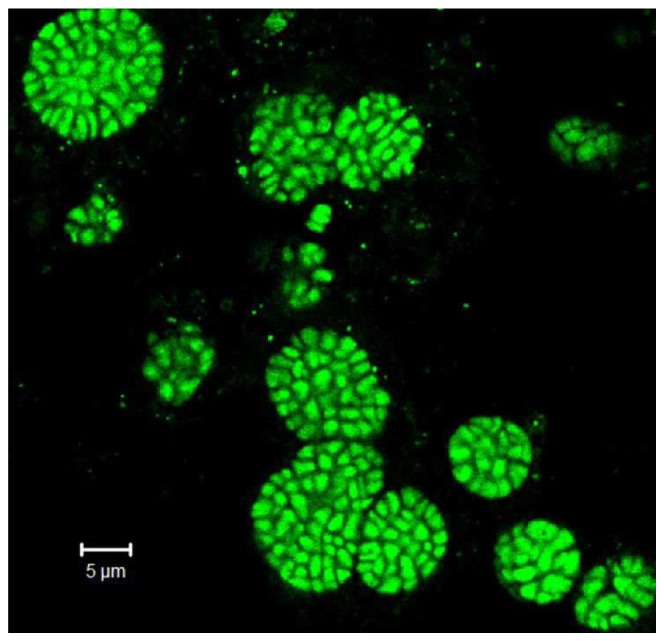
Enriched DAMO archaea culture (FISH image demonstrating that DAMO archaea typically form large clusters. Bioreactor microbial communities were hybridized with the DAMO archaea (Candidatus ‘Methanoperedens nitroreducens’) specific probe (S-*-Darch- 872-a-A-18 (5- GGCTCCACCCGTTGTAGT −3). Labeled cells were visualized on a confocal laser scanning microscope (Carl Zeiss, LSM512) with Ar-ion laser (488 nm) and two HeNe lasers (543 and 633 nm).
Microfluidic chip design and manufacture
The microfluidic chip is designed to operate asshown in Figure 2. The microfluidic cell sorter consists of four branches (length = 12 mm), the main channel (length = 8 mm), with two inlets and two outlets. The inlet bacterial flow and buffer flow come from inlet ① and ② respectively, the waste exits via outlet ③ , and the desired DAMO cells exit through outlet ④ . All channel widths are 100 μm wide and 65 μm high. The interface wall in the middle of the main channel is 40 μm wide, and was designed to minimise diffusion between the two laminar flows. Two gaps of 70 μm are utilised to minimise pressure fluctuations within the chip and enable transport from the heterogeneous sample stream to the buffer.
The microfluidic chip fabrication follows standard soft lithography techniques [22]. A computer- aided design (CAD) package was used to draw the channels, and this was transferred to a high resolution printer to fabricate a chrome mask. A 65 µm layer of photoresist (SU-8 3100) was spin-coated onto a silicon wafer, soft-baked, and followed by UV exposure through the chrome mask. The wafer was then hard-baked, and non-polymerised photoresist removed via washing. PDMS and curing agent were mixed in a ratio of 10:1, added to the silicon master, and left to cure in an oven at 85◦ C overnight. Following removal from the master, the PDMS was cut to the correct size and access holes punched. The fabricated PDMS channel and a coverslip were subjected to an oxygen plasma and subsequently pressed together to form a permanent bond.
System Setup
Key elements in our cell sorting system are shown in Fig. 2. The fibre laser (IPG Photonics, YLD-5) produces a continuous wave at wavelength of 1064 nm with a constant output power of 0.8 W. The laser beam is guided to the objective (Nikon 100 × oil immersion, numerical aperture NA = 1.3) through an optical path containing appropriate lenses, mirrors and dichroic mirrors (DM). We lower the power to 20 mW in the optical trap to minimize potential heating effects from the laser on the target cells, and lower the force exerted on them. The objective is mounted on a motorized stage along the Z-axis, and controlled by software developed in LabView. The CCD camera (Prosilica, GE680) is connected to the PC to visualise the sortingprocess. Syringes containing buffer and dispersed bacteria are loaded onto the syringe pump (Adelab, 36 Holland) and connected to the microfluidic chip via flexible tubing. The microfluidic chip is mounted on a manual, micrometer-controlled two-dimensional X-Y stage (micrometer accuracy is 1 µm) and translated such that the channels are within the field of view of the CCD. The focused laser beam enters the microfluidic chip through the coverslip, and the optical trap at its focus. Fluid switches enable channels to be effectively “blocked” (that is, the fluid bypasses the microfluidic chip and is redirected to waste containers).
Fig. 2.

The microfluidic channel structure and schematic cell sorting procedure (black circles denote the target DAMO cells, rods or curved filaments represent non-target cells). The optical trap, shown in red, collects a target DAMO cell and translates it through the gap into the buffer. It is then taken significantly downstream for collection.
Using standard 1 ml syringes, the syringe pump has a minimum flow rate of 0.46 µL/hour. Based on the cross-section of the microfluidic device, this corresponds to an average velocity of approximately 20 µm/s per input channel, and a Reynolds number of 2 × 10⁻³ . Laminar flow is therefore the only observed flow under our experimental conditions.
With reference to Fig. 3, the sorting and collecting procedures of DAMO cells are performed using the following routine.
Fig. 3.
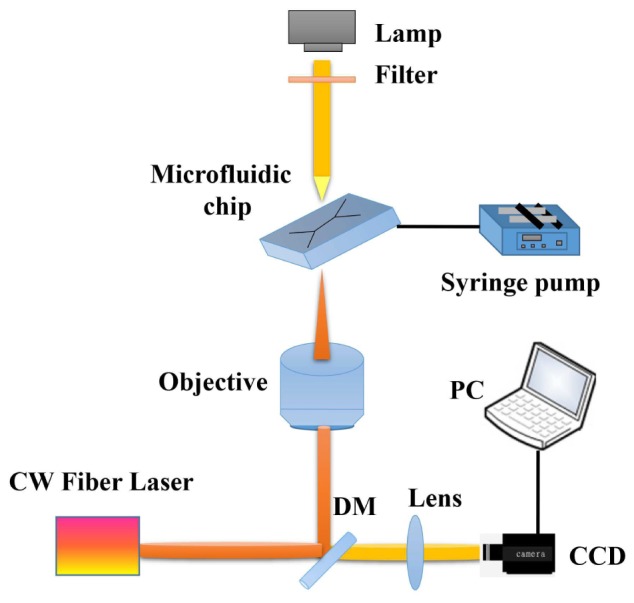
The key components of the experimental system. The laser beam passes through a series of relay optics and enters the objective, after which the it is focussed into the microfluidic chamber using a high-NA objective.
-
1.
The buffer solution in channel ② is pumped through channels ③ and ④ to ensure there are no air gaps or bacteria currently in the device.
-
2.
Outlet ④ is blocked, and inlet ① opened. This forces the extra buffer to flow through the two gaps in the device and prevents bacteria entering the buffer channel. The optical trap is positioned at the downstream gap to minimise the translation distance.
-
3.
A DAMO cell is identified based on user recognition, and captured in an optical trap. It is transferred through the gap and to the exit port of channel ④ , well away from pressure gradients associated with the buffer fluid flow. The maximum flow rate for this step, based on our used laser power, was 0.5 μL/minute in order to keep the DAMO cell in the optical trap.
-
4.
Inlet ① is closed, and any remaining bacteria washed into the waste stream.
-
5.
Outlet ④ is re-opened and the separated DAMO cell is collected in a sterilised container ready for single-cell culturing.
DAMO cultivation reactor
The trapped cell was incubated at 35◦ C in a custom-made mini- reactor (Fig. 4) which was sealed with a rubber stopper. The mini-reactor had a workingvolume of 100 mL, separated into two compartments with each compartment having 50 mL. Compartment A is used to store the growth medium, while compartment B is set to grow DAMO cells. A selectively permeable membrane is fixed between these two compartments. Thus, fresh medium can diffuse between the two compartments, whereas the DAMO cells in compartment A cannot flow into compartment B. Mineral medium consisting of NaNO3 0.3 g/L, KH2 PO4 0.05 g/L, CaCl2 ·H2 O 0.3 g/L, MgSO4 ·7H2 O 0.2 g/L, FeSO4 0.00625 g/L, an acid trace element solution (added at 0.5 mL/L) and an alkaline trace element solution (added at 0.2 mL/L) was added into the container [20]). To provide methane to act as the electron donor for DAMO archaea, a mixed gas (5% N2, 90% CH4 and 5% CO2) was flushed for 30 minutes into the headspace of the sterilised reactor (100 mL). Methane consumption was regularly monitored through detecting methane concentration in the headspace using previously reported methods [20]). The cultivation reactor operated for 420 days after seeding the sorted DAMO cells into compartment B.
Fig. 4.
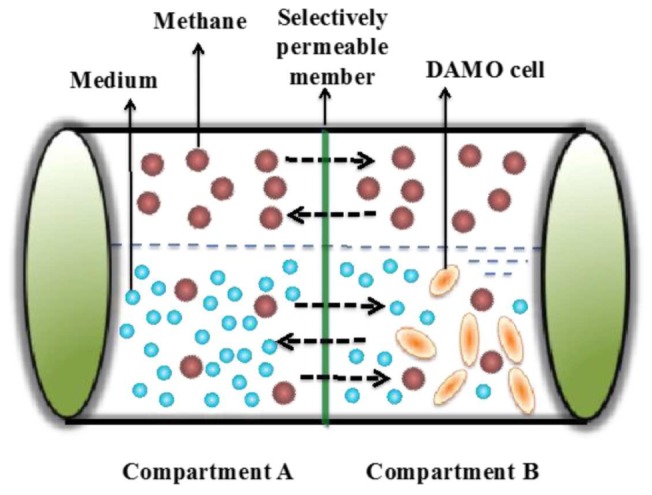
The schematic diagram of DAMO cultivation container with two compartments.
3. Results and discussion
Figure 5 presents images showing the trapping of the DAMO cell in the microfluidic chip and its transfer from the microbe channel into the collecting channel. The target cell is identified by the operator as it flows through the solution, Fig. 5(a), and is optically trapped, Fig. 5(b). It is moved transversely in the flow, crossing the gap and entering the buffer channel, Fig. 5(c)-5(h). Subsequent frames show transport along the buffer channel. The detritus seen in the lower section of Fig. 5(g)-5(h) is most likely to be PDMS transferred during the microfluidic chip fabrication.
Fig. 5.

Images of the trapping and transfer the DAMO cell in the microfluidic chip. The DAMO cell is flowing in the main bacteria channel and is optically trapped (a and b). Then it is moved transversely from one side of the gap to the other, and then into the pure buffer solution (c-h). The spot at the bottom of (g) and (h) is likely to be PDMS detritus - it was present before the addition of buffer or bacteria.
When a target cell is trapped and moved by the optical tweezer in a microfluidic channel, there are two types of forces acting on the cell: the fluid drag force and the optical trapping force. According to Stokes’ law [23], the fluid drag force can be calculated by Fd = 6πη Rυ, where η is the fluid viscosity, R is the cell radius and υ is the fluid velocity. For a DAMO cell with an average radius of 1.5 µm in a microfluidic channel where the flow rate of 20 µm/s, the drag force is 0.505 pN if the water viscosity of 0.8937 × 10⁻³ Ns/m2 at 25 ◦ C was considered.The optical trapping force as a function of the displacement in the optical trap can be calculated by using T-matrix method [24,25]. We can estimate the minimum optical trapping power that required to trap and move the target cells as the drag force. The maximum sorting rate is limited by two factors. Firstly, only relatively slow particle velocities (< 20 µm/s) in the microfluidic channels can be measured with video methods. This is primarily due to the time it takes for the cell to traverse the screen, and allow the operator to position the optical trap to intercept the cell. Secondly, to prevent optical damage to the cells, the power of the optical trap has been greatly reduced. This placed further limits on the maximum flow rate as the optical trapping force must be greater than the fluid’s drag force acting on the particle. Future improvements could entail computer recognition of target cells, automated stage translation such that the optical trap intercepts the flowing cell [18], or the inclusion of beam shaping techniques and advanced user interfaces [26–29]. In addition, a combination of Raman spectra technique and optical tweezers could be also used to refine out method [30].
After inoculation, gasous methane was regularly measured. The initial methane consumption was not observed during the first four months. After 120 days cultivation, the DAMO activity was observed in terms of the consumption of methane. The culture sample was collected from compartment B for microscopic observation on Day 345. According to 100 × oil microscopic observation, some typical DAMO archaea cell were found as tetradococci-like or sarcina-like clusters (Fig. 6). Although no other forms of cells were observed in the collected sample, it is too difficult to show the purity of DAMO archaea in terms of microscopic observation. The incubation experiment is continuously ongoing and the purity of DAMO archaea will be further confirmed by further sequencing analysis. The total number of DAMO archaea would be 1.05 × 10⁶ after the cultivation of 420 days, assuming the doubling time of DAMO archaea is 20 days [31]. Based on the methane profile versus time (Fig. 7), the average cellular methane oxidation rate was approximately 4.5 pmol/cell/d. The rate is 4 orders of magnitude higher than the value obtained in an enriched DAMO bacteria (0.2 fmol CH4 /cell/d) based on cell counts and a cellular methane oxidation rate [32], and about 4-5 orders of magnitude higher than the potential DAMO rates determined in natural ecosystems [33]. Here, it is assumed that the methane consumption was exclusively consumed by the DAMO archaea growth and metabolism.
Fig. 6.
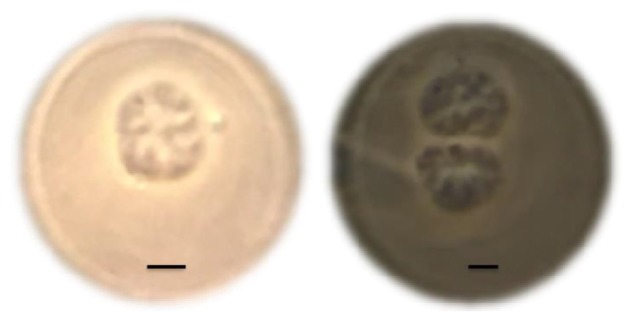
Microscope images of DAMO archaea cells after 345 days of cultivation. DAMO archaea cells grow as irregular cocci 1-3 µm in diameter and are found as tetradococci-like or sarcina-like clusters. Scale bar = 1 µm. No other forms of bacteria were observed in the solution.
Fig. 7.
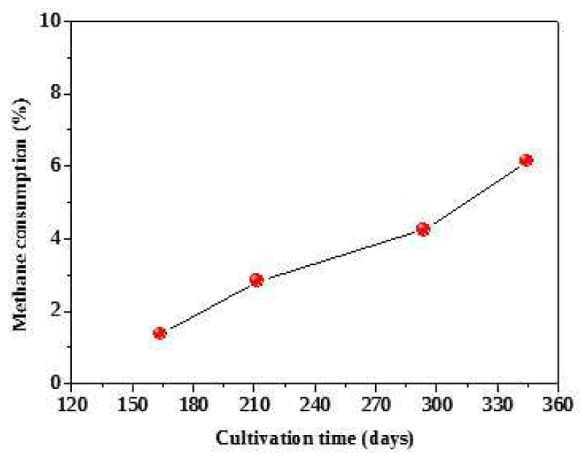
Methane accumulated consumption profile in the DAMO cultivation reactor.
4. Conclusions
Anaerobic methane oxidation coupled to denitrification can be mediated by DAMO archaea (Candidatus ‘Methanoperedens nitroreducens’). This study developed a method to cultivate this un-isolated culture by utilising optical tweezers within a microfluidic chamber. Optical tweezers are used to move a single trapped cell from an enriched DAMO culture. The microfluidic system enabled to move the target cell into the culture container without contaminations. After long-term cultivation, we can observe the methane consumption and DAMO archaea within the cultivation chamber, indicating that viability has been maintained. Our results show that the technique is highly-appropriate for cultures where purity is essential, particularly for slow-growing microorganisms. Further sequencing experiments are required to prove the purity of DAMO archaea.
Acknowledgments
This work was performed in part at the Queensland node of the Australian National Fabrication Facility and at the Micromanipulation group, School of Mathematics and Physics. We acknowledge partial support of the Australian Research Council through project DP120100163.
References and links
- 1.Stocker T. F., Qin D., Plattner G.-K., Tignor M., Allen S. K., Boschung J., Nauels A., Xia Y., Bex V., Midgley P. M., “Climate change 2013: The physical science basis,” Intergovernmental Panel on Climate Change, Working Group I Contribution to the IPCC Fifth Assessment Report (AR5) (Cambridge Univ Press, New York: ) (2013). [Google Scholar]
- 2.Knittel K., Boetius A., “Anaerobic oxidation of methane: progress with an unknown process,” Annu. Rev. Microbiol. 63(1), 311–334 (2009). 10.1146/annurev.micro.61.080706.093130 [DOI] [PubMed] [Google Scholar]
- 3.Haroon M. F., Hu S., Shi Y., Imelfort M., Keller J., Hugenholtz P., Yuan Z., Tyson G. W., “Anaerobic oxidation of methane coupled to nitrate reduction in a novel archaeal lineage,” Nature 500(7464), 567–570 (2013). 10.1038/nature12375 [DOI] [PubMed] [Google Scholar]
- 4.Raghoebarsing A. A., Pol A., van de Pas-Schoonen K. T., Smolders A. J. P., Ettwig K. F., Rijpstra W. I. C., Schouten S., Damsté J. S. S., Op den Camp H. J. M., Jetten M. S. M., Strous M., “A microbial consortium couples anaerobic methane oxidation to denitrification,” Nature 440(7086), 918–921 (2006). 10.1038/nature04617 [DOI] [PubMed] [Google Scholar]
- 5.Ettwig K. F., Butler M. K., Le Paslier D., Pelletier E., Mangenot S., Kuypers M. M. M., Schreiber F., Dutilh B. E., Zedelius J., de Beer D., Gloerich J., Wessels H. J., van Alen T., Luesken F., Wu M. L., van de Pas-Schoonen K. T., Op den Camp H. J., Janssen-Megens E. M., Francoijs K. J., Stunnenberg H., Weissenbach J., Jetten M. S. M., Strous M., “Nitrite-driven anaerobic methane oxidation by oxygenic bacteria,” Nature 464(7288), 543–548 (2010). 10.1038/nature08883 [DOI] [PubMed] [Google Scholar]
- 6.Nawy T., “Single-cell sequencing,” Nat. Methods 11(1), 18 (2013). 10.1038/nmeth.2771 [DOI] [PubMed] [Google Scholar]
- 7.Landry Z. C., Giovanonni S. J., Quake S. R., Blainey P. C., “Optofluidic cell selection from complex microbial communities for single-genome analysis,” Methods Enzymol. 531, 61–90 (2013). [DOI] [PMC free article] [PubMed] [Google Scholar]
- 8.Higuchi S., Hayashi T., Hori I., Shibata N., Sakamoto H., Agata K., “Characterization and categorization of fluorescence activated cell sorted planarian stem cells by ultrastructural analysis,” Dev. Growth Differ. 49(7), 571–581 (2007). 10.1111/j.1440-169X.2007.00947.x [DOI] [PubMed] [Google Scholar]
- 9.Biesemann C., Grønborg M., Luquet E., Wichert S. P., Bernard V., Bungers S. R., Cooper B., Varoqueaux F., Li L., Byrne J. A., Urlaub H., Jahn O., Brose N., Herzog E., “Proteomic screening of glutamatergic mouse brain synaptosomes isolated by fluorescence activated sorting,” EMBO J. 33(2), 157–170 (2014). 10.1002/embj.201386120 [DOI] [PMC free article] [PubMed] [Google Scholar]
- 10.Gassei K., Ehmcke J., Schlatt S., “Efficient enrichment of undifferentiated GFR alpha 1(+) spermatogonia from immature rat testis by magnetic activated cell sorting,” Cell Tissue Res. 337(1), 177–183 (2009). 10.1007/s00441-009-0799-5 [DOI] [PubMed] [Google Scholar]
- 11.Fong C. Y., Peh G. S. L., Gauthaman K., Bongso A., “Separation of SSEA-4 and TRA-1-60 labelled undifferentiated human embryonic stem cells from a heterogeneous cell population using magnetic-activated cell sorting (MACS) and fluorescence-activated cell sorting (FACS),” Stem Cell Rev. 5(1), 72–80 (2009). 10.1007/s12015-009-9054-4 [DOI] [PubMed] [Google Scholar]
- 12.Ashkin A., Dziedzic J. M., Bjorkholm J. E., Chu S., “Observation of a single-beam gradient force optical trap for dielectric particles,” Opt. Lett. 11(5), 288–290 (1986). 10.1364/OL.11.000288 [DOI] [PubMed] [Google Scholar]
- 13.König K., Liang H., Berns M. W., Tromberg B. J., “Cell damage by near-IR microbeams,” Nature 377(6544), 20–21 (1995). 10.1038/377020a0 [DOI] [PubMed] [Google Scholar]
- 14.MacDonald M. P., Spalding G. C., Dholakia K., “Microfluidic sorting in an optical lattice,” Nature 426(6965), 421–424 (2003). 10.1038/nature02144 [DOI] [PubMed] [Google Scholar]
- 15.Sia S. K., Whitesides G. M., “Microfluidic devices fabricated in poly(dimethylsiloxane) for biological studies,” Electrophoresis 24(21), 3563–3576 (2003). 10.1002/elps.200305584 [DOI] [PubMed] [Google Scholar]
- 16.Cho S. K., Moon H. J., Kim C. J., “Creating, transporting, cutting, and merging liquid droplets by electrowetting- based actuation for digital microfluidic circuits,” J. Microelectromech. Syst. 12(1), 70–80 (2003). 10.1109/JMEMS.2002.807467 [DOI] [Google Scholar]
- 17.Perroud T. D., Kaiser J. N., Sy J. C., Lane T. W., Branda C. S., Singh A. K., Patel K. D., “Microfluidic-based cell sorting of Francisella tularensis infected macrophages using optical forces,” Anal. Chem. 80(16), 6365–6372 (2008). 10.1021/ac8007779 [DOI] [PubMed] [Google Scholar]
- 18.Wang X., Chen S., Kong M., Wang Z., Costa K. D., Li R. A., Sun D., “Enhanced cell sorting and manipulation with combined optical tweezer and microfluidic chip technologies,” Lab Chip 11(21), 3656–3662 (2011). 10.1039/c1lc20653b [DOI] [PubMed] [Google Scholar]
- 19.Guck J., Schinkinger S., Lincoln B., Wottawah F., Ebert S., Romeyke M., Lenz D., Erickson H. M., Ananthakrishnan R., Mitchell D., Käs J., Ulvick S., Bilby C., “Optical deformability as an inherent cell marker for testing malignant transformation and metastatic competence,” Biophys. J. 88(5), 3689–3698 (2005). 10.1529/biophysj.104.045476 [DOI] [PMC free article] [PubMed] [Google Scholar]
- 20.Hu S., Zeng R. J., Keller J., Lant P. A., Yuan Z., “Effect of nitrate and nitrite on the selection of microorganisms in the denitrifying anaerobic methane oxidation process,” Environ. Microbiol. Rep. 3(3), 315–319 (2011). 10.1111/j.1758-2229.2010.00227.x [DOI] [PubMed] [Google Scholar]
- 21.Amann R. I., Krumholz L., Stahl D. A., “Fluorescent-oligonucleotide probing of whole cells for determinative, phylogenetic, and environmental studies in microbiology,” J. Bacteriol. 172(2), 762–770 (1990). 10.1128/jb.172.2.762-770.1990 [DOI] [PMC free article] [PubMed] [Google Scholar]
- 22.Love J. C., Anderson J. R., Whitesides G. M., “Fabrication of three-dimensional microfluidic systems by soft lithography,” MRS Bull. 26(07), 523–528 (2001). 10.1557/mrs2001.124 [DOI] [Google Scholar]
- 23.Svoboda K., Block S. M., “Biological applications of optical forces,” Annu. Rev. Biophys. Biomol. Struct. 23(1), 247–285 (1994). 10.1146/annurev.bb.23.060194.001335 [DOI] [PubMed] [Google Scholar]
- 24.Nieminen T. A., Loke V. L., Stilgoe A. B., Knöner G., Brańczyk A. M., Heckenberg N. R., Rubinsztein-Dunlop H., “Optical tweezers computational toolbox,” J. Opt. A, Pure Appl. Opt. 9(8), S196–S203 (2007). 10.1088/1464-4258/9/8/S12 [DOI] [Google Scholar]
- 25.Qi X., Nieminen T. A., Stilgoe A. B., Loke V. L., Rubinsztein-Dunlop H., “Comparison of T-matrix calculation methods for scattering by cylinders in optical tweezers,” Opt. Lett. 39(16), 4827–4830 (2014). 10.1364/OL.39.004827 [DOI] [PubMed] [Google Scholar]
- 26.McDonald C., McPherson M., McDougall C., McGloin D., “Holohands: games console interface for controlling holographic optical manipulation,” J. Opt. 15(3), 035708 (2013). 10.1088/2040-8978/15/3/035708 [DOI] [Google Scholar]
- 27.Perch-Nielsen I., Palima D., Dam J. S., Glückstad J., “Parallel particle identification and separation for active optical sorting,” J. Opt. A, Pure Appl. Opt. 11(3), 034013 (2009). 10.1088/1464-4258/11/3/034013 [DOI] [Google Scholar]
- 28.Grieve J. A., Ulcinas A., Subramanian S., Gibson G. M., Padgett M. J., Carberry D. M., Miles M. J., “Hands-on with optical tweezers: a multitouch interface for holographic optical trapping,” Opt. Express 17(5), 3595–3602 (2009). 10.1364/OE.17.003595 [DOI] [PubMed] [Google Scholar]
- 29.Muhiddin C., Phillips D. B., Miles M. J., Picco L., Carberry D. M., “Kinect 4 ... holographic optical tweezers,” J. Opt. 15(7), 075302 (2013). 10.1088/2040-8978/15/7/075302 [DOI] [Google Scholar]
- 30.Xie C., Chen D., Li Y. Q., “Raman sorting and identification of single living micro-organisms with optical tweezers,” Opt. Lett. 30(14), 1800–1802 (2005). 10.1364/OL.30.001800 [DOI] [PubMed] [Google Scholar]
- 31.Chen X., Guo J., Shi Y., Hu S., Yuan Z., Ni B.-J., “Modeling of simultaneous anaerobic methane and ammonium oxidation in a membrane biofilm reactor,” Environ. Sci. Technol. 48(16), 9540–9547 (2014). 10.1021/es502608s [DOI] [PubMed] [Google Scholar]
- 32.Ettwig K. F., van Alen T., van de Pas-Schoonen K. T., Jetten M. S., Strous M., “Enrichment and molecular detection of denitrifying methanotrophic bacteria of the NC10 phylum,” Appl. Environ. Microbiol. 75(11), 3656–3662 (2009). 10.1128/AEM.00067-09 [DOI] [PMC free article] [PubMed] [Google Scholar]
- 33.Deutzmann J. S., Stief P., Brandes J., Schink B., “Anaerobic methane oxidation coupled to denitrification is the dominant methane sink in a deep lake,” Proc. Natl. Acad. Sci. U.S.A. 111(51), 18273–18278 (2014). 10.1073/pnas.1411617111 [DOI] [PMC free article] [PubMed] [Google Scholar]