Abstract
Automated detection and grading of angiographic high-risk features in diabetic retinopathy can potentially enhance screening and clinical care. We have previously identified capillary dilation in angiograms of the deep plexus in optical coherence tomography angiography as a feature associated with severe diabetic retinopathy. In this study, we present an automated algorithm that uses hybrid contrast to distinguish angiograms with dilated capillaries from healthy controls and then applies saliency measurement to map the extent of the dilated capillary networks. The proposed algorithm agreed well with human grading.
OCIS codes: (110.4500) Optical coherence tomography, (170.3880) Medical and biological imaging, (100.0100) Image processing, (100.2960) Image analysis, (170.4470) Ophthalmology
1. Introduction
Optical coherence tomography angiography (OCTA) produces 3-dimensional (3D) angiograms of the human retina with capillary-level resolution by measuring signal decorrelation or variance caused by red blood cells in consecutive cross-sectional images (B-frames) taken at the same location [1–5]. Unlike fluorescein angiography, the standard for ocular angiography, OCTA is noninvasive, rapidly acquired, 3D, and amenable to automated analysis.
Projection artifacts, however, which are caused by moving blood cells in the more superficial vessels, hinder the clear visualization of deeper plexuses. This has limited the ability of conventional OCTA to evaluate retinal vasculature in deeper plexuses. The depth-resolution of OCTA has recently been improved with the projection-resolved (PR) OCTA algorithm, which produces clearer images of deeper retinal plexuses by resolving the ambiguity between real flow signal and projection artifacts [6].
In diabetic retinopathy (DR), the ability to observe individual capillary networks may enable earlier detection of microvasculopathy and a better understanding of the pathophysiologic mechanisms. We previously showed that applying PR-OCTA to visualize the individual layers, the sensitivity of detecting DR and determining its severity with automated algorithms can be improved [7].
A feature that was strongly associated with severe DR was dilated capillaries in the deep retinal plexuses [7]. However, manual grading of this feature is tedious and unlikely to be used by clinicians in everyday practice. Automated detection of this feature could enhance clinical practice and be useful for screening treatment-threshold DR.
In this study, we present and validate an automated detection algorithm based on contrast and saliency methods to distinguish dilated capillaries from normal capillaries, and then quantify the extent of dilated capillaries on deep capillary plexus (DCP) angiograms.
2. Methods
2.1 OCTA data acquisition and processing
Participants were recruited at the Casey Eye Institute of the Oregon Health & Science University (OHSU) in accordance to an OHSU Institutional Review Board approved protocol. This study complied with the tenets of the Declaration of Helsinki. Written informed consent was obtained from all participants after explanation of the nature and possible consequences of the study.
Two 3 × 3 mm scans (1 x-fast and 1 y-fast) with 2 mm depth were sequentially obtained in one eye of each participants within a visit using a commercial spectral domain OCT system (RTVue-XR; Optovue, Fremont, CA) with a center wavelength 840 nm, a full-width half maximum bandwidth of 45 nm, and an axial scan rate of 70 kHz [1]. In the fast transverse scanning direction, 304 axial scans were sampled to obtain a single 3 mm B-scan. Two repeated B-scans were captured at a fixed position before proceeding to the next location. A total of 304 locations along a 3 mm distance in the slow transverse direction were sampled to form a 3D data cube. All 608 B-scans in each data cube were acquired in 2.9 seconds.
Flow signal was detected by using the split-spectrum amplitude-decorrelation angiography (SSADA) algorithm [10, 11]. Motion artifacts were removed by aligning and merging the x and y-fast scan volumes [2, 12]. Projection artifacts were suppressed by the projection-resolved OCTA (PR-OCTA) algorithm [6]. A directional graph search algorithm identified structural boundaries [13]. The DCP angiograms were created by the en face projection of the OCTA slab which contained the outer 50% of inner nuclear layer (INL) and whole outer plexiform layer with a minimum thickness of 37 microns.
2.2 Algorithm overview
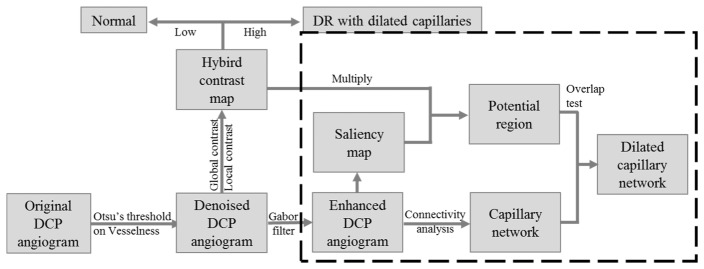
The algorithm developed in this work for detection of dilated capillaries is composed of four major steps: vesselness-based denoising, hybrid-contrast-based diagnosis, contrast-and-saliency-based detection, and connectivity-based vessel grading. (Fig. 1)
Fig. 1.
Overview of the developed dilated capillaries detection algorithm. DCP: deep capillary plexus.
First, the background noise is removed using a vesselness filter. Next, a hybrid contrast ratio map that combines global and local contrast is generated, differentiating DR eyes with dilated capillaries from normal eyes. Then the DCP angiograms of DR eyes are enhanced by Gabor filter and regions with high saliency and contrast are recognized as potential dilated capillaries region. Finally, connected capillary networks that reside on the potential dilated capillaries region are graded as dilated capillaries. The following sections describe the above steps in detail.
2.3 Vesselness-based denoising
Vesselness filters have been proven to be successful in enhancing vascular structures in OCTA [14–16]. We have applied it here to remove the background noise. We first measured vesselness, or the likelihood of a pixel belonging to a vessel, by assessing how “tubular” the structure in its vicinity is [17, 18]. For each pixel, the anisotropy (Rb) and structure (S) were calculated from the eigenvalues (λ1 ≤ λ2) of its Hessian matrix as:
| (1) |
| (2) |
Then, the vesselness V was calculated by:
| (3) |
Where β1 = 1 pixel and β2 = 10 pixels are sensitivity constants. Vesselness is low if there is a low intensity change in the vicinity of a pixel (no vessel structure) or the intensity change is large in almost all directions (large anisotropy). Pixels with vesselness less than Otsu’s threshold [19] were determined as noise and removed from the DCP angiogram.
2.4 Hybrid-contrast based diagnosis
Previous experiments of OCTA on microfluidic flow phantoms demonstrated that the decorrelation values were related to both blood flow velocity and channel width [8]. If the velocity is held constant, the flow signal is solely dependent on channel width. In the DCP, which is ordinarily composed of a uniform network of capillaries [9], we assume that abnormally high flow signal is due to the increased channel width. We can then identify dilated capillaries by the flow signal without having to measure the vessel caliber [20], which is difficult to measure given the current transverse resolution of OCTA (15-20µm). In this step, we combined two contrast analyses to identify angiograms with dilated capillaries and locate potential regions with dilated capillaries.
2.4.1 Global contrast
The global contrast [21] preserves the distinctiveness of flow signal intensity by measuring the ratio between the intensity of a given pixel and the average intensity of the angiogram.
| (4) |
where GC is the global contrast matrix; I is the signal intensity on DCP angiogram.
2.4.2 Local contrast based on center-surround mechanism
The local contrast investigates the rarity of an image region with respect to its immediate vicinity [22]. The most obvious dilated capillaries have high local contrast. We defined the local contrast:
| (5) |
where wc is the average intensity within a central circle at (x, y) with a diameter of 60 µm, while ws is the average intensity of the surrounding ring with an inner diameter of 60 µm and outer diameter of 130 µm.
2.4.3 Hybrid contrast
When applied alone, global contrast frequently detects normal branching capillaries on control eyes as dilated capillaries. Local contrast, when applied alone, detects isolated capillary segments as dilated capillaries. The hybrid contrast ratio, which is the product of global and local contrast ratios, can avoid these false positive errors.
2.4.4 Differentiating dilated capillaries from normal
The angiograms with maximum hybrid contrast ratio greater than the empirically derived threshold of 0.3 are identified as those with dilated capillaries.
2.5 Contrast-and-saliency-based detection
The hybrid contrast ratio identifies potential regions with dilated capillaries but cannot identify their specific location. The saliency model (RARE2012), while it is unreliable in distinguishing eyes with dilated capillaries from normal eyes, can effectively localize the regions with dilated capillaries based on brightness, orientation, and position in eyes with known dilated capillaries [23]. We used the RARE2012 model to derive a saliency map, which we then multiplied to the hybrid contrast ratio. We extracted the potential regions of dilated capillaries by applying Otsu’s threshold.
2.6 Connectivity-based capillary grading
The enhanced DCP angiograms were divided into different vascular networks according to connectivity. If the vascular network has an intersection with the potential region, the vascular network was considered as dilated capillaries.
2.7 Evaluation metrics
An experienced masked grader qualitatively examined the en face DCP angiograms [7]. The dilated capillaries were localized using a modified Early Treatment of Diabetic Retinopathy Study (ETDRS) grid [24], dividing the 3 × 3 mm angiogram into a central 500 micron circle, and the remaining area into superior, inferior, nasal, and temporal quadrants. The grid was centered at the center of the image. The grader determined whether dilated capillaries were present or absent in each quadrant in a binary fashion.
The agreement between our automated algorithm and manual grading was evaluated, in term of accuracy (Acc), sensitivity (Se), specificity (Sp) [25]. These metrics are defined as follows:
| (6) |
| (7) |
| (8) |
where tp, tn, fp and fn indicate the true positive (the number of correctly identified dilated capillaries sector), true negative (the number of correctly identified normal vessel sector), false positive (the number of incorrectly identified dilated capillaries sector), and false negative(the number of incorrectly identified normal vessel sector).
3. Results
Eyes from 10 healthy volunteers and 10 participants with DR with dilated capillaries were imaged. One eye from each participant was randomly selected for the study.
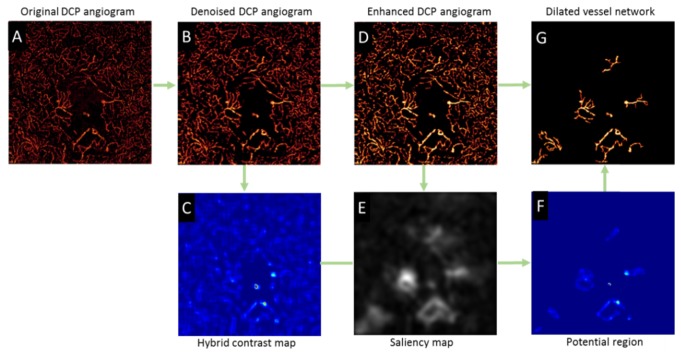
Figure 2 illustrates how each step of the algorithm processes the original DCP angiogram (Fig. 2(A)). The vesselness filter first suppressed (Fig. 2(B)) the background noise. By thresholding the hybrid contrast ratio map (Fig. 2(C)), we determined that the angiogram is from a DR eye with dilated capillaries. Next, the denoised DCP angiogram is further enhanced by applying a Gabor filter (Fig. 2(D)). Then, a saliency model detected the dilated capillaries regions. The saliency calculation was performed at multiple scales [26] and combined into a single saliency map (Fig. 2(E)). The potential regions (Fig. 2(F)) were more distinctly identified by multiplying the hybrid contrast ratio map by the saliency map. Finally, the dilated vascular network (Fig. 2(G)) was extracted from the enhanced DCP image based on connectivity.
Fig. 2.
Illustration of detecting dilated capillaries by the proposed techniques. (A) Original en face deep capillary plexus (DCP) angiogram. (B) Denoised DCP angiogram. (C) Hybrid contrast ratio map combining global contrast and local contrast. (D) Enhanced DCP angiogram by Gabor filtering. (E) Saliency map. (F) The potential regions of dilated capillaries detected by incorporating the saliency and contrast ratio maps. (G) Extracted dilated capillaries.
Figure 3 shows 4 DCP angiograms each of normal and severe DR eyes with dilated capillaries paired with their hybrid contrast maps. Figure 4 shows that the maximum hybrid contrast ratios can distinguish normal DCP angiograms from those with dilated capillaries, using a fixed threshold of 0.3.
Fig. 3.
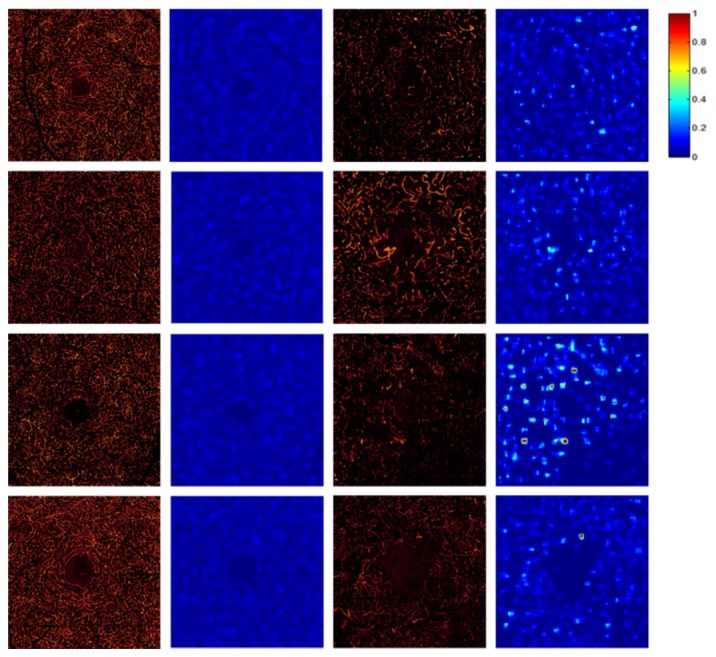
The comparison of DCP angiograms and their hybrid contrast ratio maps between healthy participants and DR participants with dilated capillaries. The first column shows examples of DCP angiograms with normal vessels. The second column shows the corresponding hybrid contrast ratio maps. The third column shows DCP angiograms with dilated capillaries. The fourth column shows the corresponding hybrid contrast ratio maps.
Fig. 4.
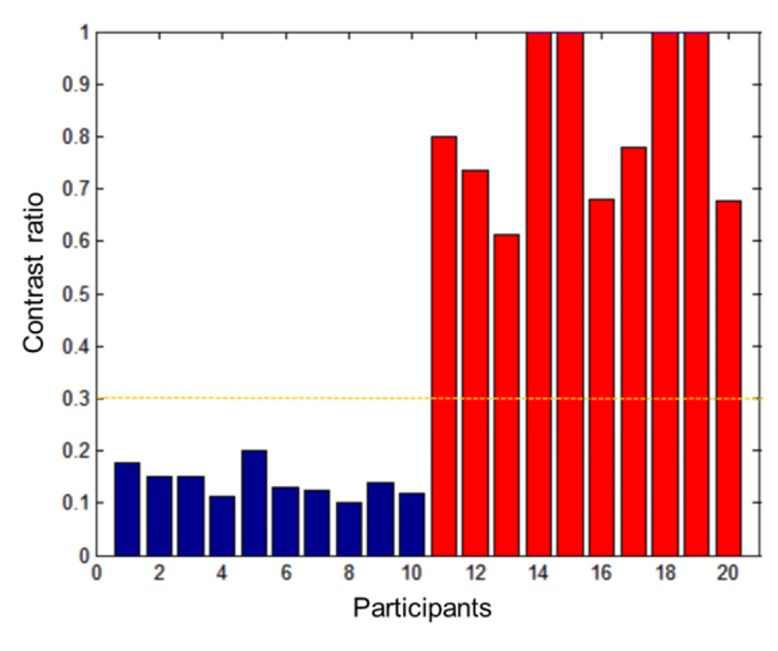
The plot of maximum hybrid contrast ratio in one scan of each participant. The cutoff of 0.3 can completely separate the healthy eyes (blue bars) and the DR eyes with dilated capillaries (red bars).
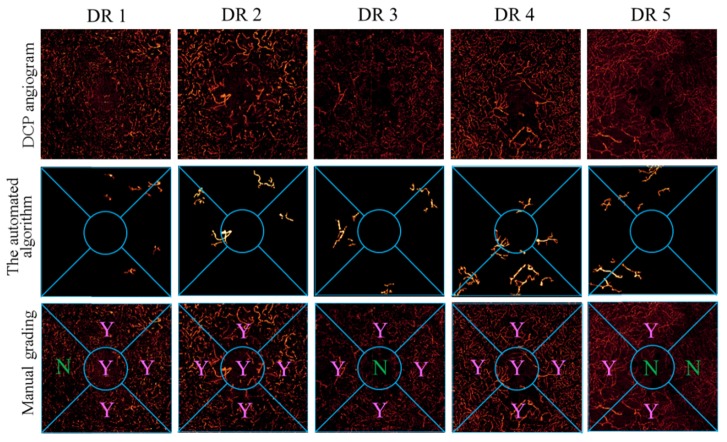
The results from the automated algorithm were compared with the results from expert grading. Five representative cases are shown in Fig. 5. All DR cases in this study showed dilated capillaries in the DCP angiogram. The proposed algorithm agreed well with human grading in sector by sector comparison. The detection accuracy was 0.92 (95% CI: 0.80-0.97); the detection sensitivity was 0.95 (95% CI: 0.80-0.99); and the detection specificity was 0.85 (95% CI: 0.54-0.97).
Fig. 5.
Comparison of detection of dilated capillaries between the automated algorithm and human grading. The top row shows the DCP angiograms. The second row shows the dilated capillaries that were extracted by the proposed algorithm. The bottom row shows the results of human grading.
4. Discussion and conclusion
We have proposed an algorithm for detection of dilated capillaries in DCP, which is correlated with severe DR. The vesselness filter removed the background noise. A hybrid contrast ratio map was used to distinguish eyes with dilated capillaries from normal eyes. The contrast ratio map and saliency map were used to locate the regions with dilated capillaries. Morphologic operations were applied to identify the continuous extent of dilated capillaries. This algorithm identified dilated capillaries with 0.92 diagnostic accuracy compared to human grading.
Projection artifacts from large superficial vessels project high flow signals onto the DPC angiograms and can result in false positive detection of dilated capillaries. The removal of these artifacts using PR-OCTA was a critical step for accurate detection of dilated capillaries in the DCP.
Due to the variation of image quality in real world data, significant variation in the absolute signal strength of DCP angiogram was present. For example, the angiogram of the third DR case in Fig. 5 is significantly dimmer than others. The proposed algorithm in this study performed well regardless of low image quality. Further studies are needed to evaluate the performance of the algorithm on scans with signal strength variation due to vignetting and defocusing, etc.
Although this algorithm identified dilated capillaries effectively in the study eyes, it may not perform as well in angiograms that consist mostly of dilated vessels due to the lack of saliency against normal vessels. For example, the algorithm failed to detect some regions in the second DR case in Fig. 5. To avoid the false negative error caused by this issue, one potential solution is to acquire scans with a larger field of view and allow more normal vessels to be included in the processing region.
This study is limited by the lack of the eyes of DR without dilated capillaries. In a future study, it would be useful to investigate the correlation between automatically detected dilated capillary area and the severity of DR. Furthermore, longitudinal studies to monitor the dilated capillaries or track its change in response to treatment would also be valuable. In summary, this novel algorithm can automatically detect dilated capillaries in retinal deep plexus in DR with good accuracy compared to human grading.
Acknowledgements
Financial interests: Oregon Health & Science University (OHSU), David Huang and Yali Jia, have a significant financial interest in Optovue, Inc. David Huang also has a financial interest in Carl Zeiss Meditec. These potential conflicts of interest have been reviewed and managed by OHSU.
Funding
This work was supported by grant DP3 DK104397, R01 EY024544, R01 EY023285, P30 EY010572 from the National Institutes of Health (Bethesda, MD), and by unrestricted departmental funding from Research to Prevent Blindness (New York, NY).
References and links
- 1.Jia Y., Bailey S. T., Hwang T. S., McClintic S. M., Gao S. S., Pennesi M. E., Flaxel C. J., Lauer A. K., Wilson D. J., Hornegger J., Fujimoto J. G., Huang D., “Quantitative optical coherence tomography angiography of vascular abnormalities in the living human eye,” Proc. Natl. Acad. Sci. U.S.A. 112(18), E2395–E2402 (2015). 10.1073/pnas.1500185112 [DOI] [PMC free article] [PubMed] [Google Scholar]
- 2.Jia Y., Bailey S. T., Wilson D. J., Tan O., Klein M. L., Flaxel C. J., Potsaid B., Liu J. J., Lu C. D., Kraus M. F., Fujimoto J. G., Huang D., “Quantitative optical coherence tomography angiography of choroidal neovascularization in age-related macular degeneration,” Ophthalmology 121(7), 1435–1444 (2014). 10.1016/j.ophtha.2014.01.034 [DOI] [PMC free article] [PubMed] [Google Scholar]
- 3.Hwang T. S., Jia Y., Gao S. S., Bailey S. T., Lauer A. K., Flaxel C. J., Wilson D. J., Huang D., “Optical coherence tomography angiography features of diabetic retinopathy,” Retina 35(11), 2371–2376 (2015). 10.1097/IAE.0000000000000716 [DOI] [PMC free article] [PubMed] [Google Scholar]
- 4.Hwang T. S., Gao S. S., Liu L., Lauer A. K., Bailey S. T., Flaxel C. J., Wilson D. J., Huang D., Jia Y., “Automated quantification of capillary nonperfusion using optical coherence tomography angiography in diabetic retinopathy,” JAMA Ophthalmol. 134(4), 367–373 (2016). 10.1001/jamaophthalmol.2015.5658 [DOI] [PMC free article] [PubMed] [Google Scholar]
- 5.Jia Y., Wei E., Wang X., Zhang X., Morrison J. C., Parikh M., Lombardi L. H., Gattey D. M., Armour R. L., Edmunds B., Kraus M. F., Fujimoto J. G., Huang D., “Optical coherence tomography angiography of optic disc perfusion in glaucoma,” Ophthalmology 121(7), 1322–1332 (2014). 10.1016/j.ophtha.2014.01.021 [DOI] [PMC free article] [PubMed] [Google Scholar]
- 6.Zhang M., Hwang T. S., Campbell J. P., Bailey S. T., Wilson D. J., Huang D., Jia Y., “Projection-resolved optical coherence tomographic angiography,” Biomed. Opt. Express 7(3), 816–828 (2016). 10.1364/BOE.7.000816 [DOI] [PMC free article] [PubMed] [Google Scholar]
- 7.Hwang T. S., Zhang M., Bhavsar K., Zhang X., Campbell J. P., Lin P., Bailey S. T., Flaxel C. J., Lauer A. K., Wilson D. J., Huang D., Jia Y., “Visualization of 3 Distinct Retinal Plexuses by Projection-Resolved Optical Coherence Tomography Angiography in Diabetic Retinopathy,” JAMA Ophthalmol. 134(12), 1411–1419 (2016). 10.1001/jamaophthalmol.2016.4272 [DOI] [PMC free article] [PubMed] [Google Scholar]
- 8.Su J. P., Chandwani R., Gao S. S., Pechauer A. D., Zhang M., Wang J., Jia Y., Huang D., Liu G., “Calibration of optical coherence tomography angiography with a microfluidic chip,” J. Biomed. Opt. 21(8), 086015 (2016). 10.1117/1.JBO.21.8.086015 [DOI] [PMC free article] [PubMed] [Google Scholar]
- 9.Chan G., Balaratnasingam C., Yu P. K., Morgan W. H., McAllister I. L., Cringle S. J., Yu D.-Y., “Quantitative Morphometry of Perifoveal Capillary Networks in the Human Retina,” Invest. Ophthalmol. Vis. Sci. 53(9), 5502–5514 (2012). 10.1167/iovs.12-10265 [DOI] [PubMed] [Google Scholar]
- 10.Jia Y., Tan O., Tokayer J., Potsaid B., Wang Y., Liu J. J., Kraus M. F., Subhash H., Fujimoto J. G., Hornegger J., Huang D., “Split-spectrum amplitude-decorrelation angiography with optical coherence tomography,” Opt. Express 20(4), 4710–4725 (2012). 10.1364/OE.20.004710 [DOI] [PMC free article] [PubMed] [Google Scholar]
- 11.Gao S. S., Liu G., Huang D., Jia Y., “Optimization of the split-spectrum amplitude-decorrelation angiography algorithm on a spectral optical coherence tomography system,” Opt. Lett. 40(10), 2305–2308 (2015). 10.1364/OL.40.002305 [DOI] [PMC free article] [PubMed] [Google Scholar]
- 12.Kraus M. F., Potsaid B., Mayer M. A., Bock R., Baumann B., Liu J. J., Hornegger J., Fujimoto J. G., “Motion correction in optical coherence tomography volumes on a per A-scan basis using orthogonal scan patterns,” Biomed. Opt. Express 3(6), 1182–1199 (2012). 10.1364/BOE.3.001182 [DOI] [PMC free article] [PubMed] [Google Scholar]
- 13.Zhang M., Wang J., Pechauer A. D., Hwang T. S., Gao S. S., Liu L., Liu L., Bailey S. T., Wilson D. J., Huang D., Jia Y., “Advanced image processing for optical coherence tomographic angiography of macular diseases,” Biomed. Opt. Express 6(12), 4661–4675 (2015). 10.1364/BOE.6.004661 [DOI] [PMC free article] [PubMed] [Google Scholar]
- 14.Yousefi S., Liu T., Wang R. K., “Segmentation and quantification of blood vessels for OCT-based micro-angiograms using hybrid shape/intensity compounding,” Microvasc. Res. 97, 37–46 (2015). 10.1016/j.mvr.2014.09.007 [DOI] [PMC free article] [PubMed] [Google Scholar]
- 15.Camino A., Zhang M., Dongye C., Pechauer A. D., Hwang T. S., Bailey S. T., Lujan B., Wilson D. J., Huang D., Jia Y., “Automated registration and enhanced processing of clinical optical coherence tomography angiography,” Quant. Imaging Med. Surg. 6(4), 391–401 (2016). 10.21037/qims.2016.07.02 [DOI] [PMC free article] [PubMed] [Google Scholar]
- 16.Zang P., Liu G., Zhang M., Dongye C., Wang J., Pechauer A. D., Hwang T. S., Wilson D. J., Huang D., Li D., Jia Y., “Automated motion correction using parallel-strip registration for wide-field en face OCT angiogram,” Biomed. Opt. Express 7(7), 2823–2836 (2016). 10.1364/BOE.7.002823 [DOI] [PMC free article] [PubMed] [Google Scholar]
- 17.Frangi A. F., Niessen W. J., Vincken K. L., Viergever M. A., “Multiscale vessel enhancement filtering,” in Medical Image Computing and Computer-Assisted Interventation—MICCAI’98(Springer, 1998), pp. 130–137. [Google Scholar]
- 18.Su R., Sun C., Zhang C., Pham T. D., “A new method for linear feature and junction enhancement in 2D images based on morphological operation, oriented anisotropic Gaussian function and Hessian information,” Pattern Recognit. 47(10), 3193–3208 (2014). 10.1016/j.patcog.2014.04.024 [DOI] [Google Scholar]
- 19.Otsu N., “A Threshold Selection Method from Gray-Level Histograms,” IEEE Trans. Syst. Man Cybern. 9(1), 62–66 (1979). 10.1109/TSMC.1979.4310076 [DOI] [Google Scholar]
- 20.Chu Z., Lin J., Gao C., Xin C., Zhang Q., Chen C.-L., Roisman L., Gregori G., Rosenfeld P. J., Wang R. K., “Quantitative assessment of the retinal microvasculature using optical coherence tomography angiography,” J. Biomed. Opt. 21(6), 066008 (2016). 10.1117/1.JBO.21.6.066008 [DOI] [PMC free article] [PubMed] [Google Scholar]
- 21.H.-H. Yeh and C.-S. Chen, “From rareness to compactness: Contrast-aware image saliency detection,” in Image Processing (ICIP), 2012 19th IEEE International Conference on(IEEE, 2012), pp. 1077–1080. 10.1109/ICIP.2012.6467050 [DOI] [Google Scholar]
- 22.Itti L., Koch C., Niebur E., “A model of saliency-based visual attention for rapid scene analysis,” IEEE Trans. Pattern Anal. Mach. Intell. 20(11), 1254–1259 (1998). 10.1109/34.730558 [DOI] [Google Scholar]
- 23.Riche N., Mancas M., Duvinage M., Mibulumukini M., Gosselin B., Dutoit T., “RARE2012: A multi-scale rarity-based saliency detection with its comparative statistical analysis,” Signal Process. Image Commun. 28(6), 642–658 (2013). 10.1016/j.image.2013.03.009 [DOI] [Google Scholar]
- 24.Early Treatment Diabetic Retinopathy Study Research Group , “Classification of diabetic retinopathy from fluorescein angiograms. ETDRS report number 11,” Ophthalmology 98(5 Suppl), 807–822 (1991). 10.1016/S0161-6420(13)38013-0 [DOI] [PubMed] [Google Scholar]
- 25.Altman D. G., Practical Statistics for Medical Research (CRC press, 1990). [Google Scholar]
- 26.Liu L., Gao S. S., Bailey S. T., Huang D., Li D., Jia Y., “Automated choroidal neovascularization detection algorithm for optical coherence tomography angiography,” Biomed. Opt. Express 6(9), 3564–3576 (2015). 10.1364/BOE.6.003564 [DOI] [PMC free article] [PubMed] [Google Scholar]


