

Abstract
Key points
Age significantly modifies the relationship between aortic pulse wave velocity and telomere length.
The differential relationships observed between aortic pulse wave velocity and telomere length in younger and older individuals suggest that the links between cellular and vascular ageing reflect a complex interaction between genetic and environmental factors acting over the life‐course.
Abstract
Ageing is associated with marked large artery stiffening. Telomere shortening, a marker of cellular ageing, is linked with arterial stiffening. However, the results of existing studies are inconsistent, possibly because of the confounding influence of variable exposure to cardiovascular risk factors. Therefore, we investigated the relationship between telomere length (TL) and aortic stiffness in well‐characterized, younger and older healthy adults, who were pre‐selected on the basis of having either low or high aortic pulse wave velocity (aPWV), a robust measure of aortic stiffness. Demographic, haemodynamic and biochemical data were drawn from participants in the Anglo‐Cardiff Collaborative Trial. Two age groups with an equal sex ratio were examined: those aged <30 years (younger) or >50 years (older). Separately for each age group and sex, DNA samples representing the highest (n = 125) and lowest (n = 125) extremes of aPWV (adjusted for blood pressure) were selected for analysis of leukocyte TL. Ultimately, this yielded complete phenotypic data on 904 individuals. In younger subjects, TL was significantly shorter in those with high aPWV vs. those with low aPWV (P = 0.017). By contrast, in older subjects, TL was significantly longer in those with high aPWV (P = 0.001). Age significantly modified the relationship between aPWV and TL (P < 0.001). Differential relationships are observed between aPWV and TL, with an inverse association in younger individuals and a positive association in older individuals. The links between cellular and vascular ageing reflect a complex interaction between genetic and environmental factors acting over the life‐course.
Keywords: ageing, aortic stiffness, telomere Length
Key points
Age significantly modifies the relationship between aortic pulse wave velocity and telomere length.
The differential relationships observed between aortic pulse wave velocity and telomere length in younger and older individuals suggest that the links between cellular and vascular ageing reflect a complex interaction between genetic and environmental factors acting over the life‐course.
Abbreviations
- aPWV
aortic pulse wave velocity
- BMI
body mass index
- CRP
C‐reactive protein
- CV
cardiovascular
- HDL
high‐density lipoprotein
- MAP
mean arterial pressure
- T/S
telomere/standard
- TL
telomere length
Introduction
With ageing, large arteries stiffen as a consequence of elastin degradation and/or vascular remodelling (London, 2001; Yasmin et al. 2005), which manifests as an increase in aortic pulse wave velocity (aPWV) throughout life (McEniery et al. 2005). Therefore, aPWV has become a widely accepted measure of vascular age. Traditional cardiovascular (CV) risk factors (e.g. total cholesterol, glucose, physical inactivity) and inflammation are associated with increased aPWV (Mora et al. 2007; McEniery et al. 2008; McDonnell et al. 2013) and aPWV is now recognized as an important, independent determinant of CV disease progression (Safar et al. 2003) and events (Ben‐Shlomo et al. 2014). However, although the severity and life‐course of exposure to CV risk factors increase over time, these factors do not account for all of the risk associated with vascular ageing, suggesting that other mechanisms must be involved.
In recent years, shortening of telomeric DNA has been linked with biological ageing (Samani & van der Harst, 2008; Huzen et al. 2010). Telomeres are specialized DNA protein complexes located at both ends of each chromosome and function as chromosomal caps preventing genetic instability and cellular senescence (Karlseder et al. 2002; Artandi, 2006). With increasing age and number of cell divisions, progressive shortening of telomere length (TL) leads to a point of cellular senescence, suggesting that TL provides a measure of cellular age (Blasco, 2005). Two recent meta‐analyses have demonstrated that telomere shortening is related to CV (Haycock et al. 2014) and metabolic outcomes (D'Mello et al. 2015), although there was significant heterogeneity in observations within these studies. Interestingly, previous studies have also reported significant cross‐sectional associations between TL and measures of vascular stiffness (Benetos et al. 2001; Nawrot et al. 2010; Wang et al. 2011) and a recent longitudinal study illustrated that a faster rate of telomere shortening was associated with increased carotid intima‐media thickness, independent of traditional CV risk factors (Masi et al. 2014), leading to the hypothesis that telomere shortening provides a cellular and genetic link to vascular ageing. However, observational studies conducted mostly in middle‐aged and older adults have shown weak or no relationship between TL and chronological age, vascular stiffness or CV disease (Tentolouris et al. 2007; De Meyer et al. 2012; Morgan et al. 2014).
In the present study, we explored the relationship between TL and aortic stiffness in two distinct groups of healthy individuals; those aged less than 30 years and those over 50 years, who were pre‐selected on the basis of having aPWV in the lower or upper extremes for their age group and sex. We hypothesized that higher aPWV is associated with shorter TL in healthy individuals.
Methods
Study population
Data on men and women, where complete information concerning demographic, haemodynamic and biochemical characteristics were available, were drawn from the Anglo‐Cardiff Collaborative Trial (McEniery et al. 2005), which consists of approximately 4500 individuals with detailed phenotypic data. Two age groups were examined: those aged <30 years (younger) or >50 years (older). Because aPWV is closely related to the mean arterial pressure (MAP; higher MAP = higher aPWV), aPWV was adjusted for MAP using linear univariate regression models, separately for each age group and sex, after determining that analyses based on linear models were the most appropriate for each group. This approach ensured that we examined associations between TL and intrinsic aortic stiffness, rather than simply selecting samples for TL analysis based on a proxy for blood pressure. Samples were then selected on the basis of the MAP‐adjusted aPWV of an individual being located in either ‘extreme’ of the aPWV distribution (i.e. upper or lower 15%), which equated to the highest (n = 125) and lowest (n = 125) aPWV values for each age‐group and sex. This yielded samples from 1000 healthy individuals, who were free from CV disease and medication, and who had undertaken a detailed lifestyle and medical history questionnaire (Fig. 1). The study complied with the Declaration of Helsinki and ethical approval was obtained from the Local Research Ethics Committees, with written informed consent being provided by all participants.
Figure 1. Group stratification and classification.
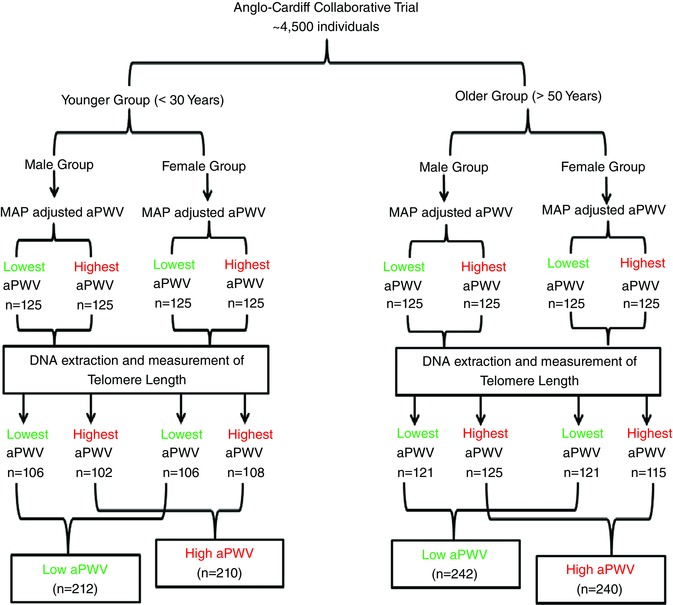
[Color figure can be viewed at wileyonlinelibrary.com]
Protocol
Height and weight were assessed and a medical history questionnaire, including details of medication was completed. Following 15 min of supine rest, brachial blood pressure and carotid and femoral artery pressure waveforms were recorded, and aPWV determined. Blood samples (20 mL) were then drawn from the antecubital fossa. Serum, plasma and buffy coat samples were then obtained and stored at −80 °C for subsequent analyses. Cholesterol, triglycerides, glucose and C‐reactive protein (CRP) were determined using a standard methodology in an accredited laboratory.
Haemodynamic measurements
Brachial blood pressure was measured with the participant resting supine, using a validated semi‐automated oscillometric device (HEM‐705CP; Omron Corporation, Kyoto, Japan), in accordance with the British Hypertension Society guidelines (O'Brien et al. 1996). All measurements were taken in duplicate and mean values were used in the subsequent analyses. aPWV was measured using the SphygmoCor system (Atcor Medical, Sydney, Australia) by sequentially recording ECG‐gated carotid and femoral artery waveforms, as previously described in detail (Wilkinson et al. 1998). Path length for the determination of aPWV was measured, using a tape measure, as the surface distance between the supra‐sternal notch and femoral site minus the distance between the supra‐sternal notch and carotid site.
DNA extraction, quantification and assessment of TL
DNA was extracted from the buffy coats using a commercially available GeneCatcher kit (Invitrogen, Paisley, UK) and then quantified and checked for purity using a Nanodrop ND‐1000 spectrophotometer (Labtech, Uckfield, UK). DNA quality was assessed by the absorbance ratio at 260 and 280 nm, and only samples with a ratio between 1.8 and 1.9 were included in the study. In addition, the integrity of the DNA samples was confirmed by gel electrophoresis in 50 randomly selected samples. Leukocyte relative mean TL was measured as the telomere/standard (T/S) ratio in triplicate by a monochrome multiplex quantitative PCR assay, using a Bio‐Rad CFX96™ RT‐PCR detection system (Bio‐Rad, Hemel Hempstead, UK) as described previously (Steptoe et al. 2011). TL is expressed as the ratio of the telomeric DNA signal to the signal of the single copy gene β‐globin, used as an internal standard (T/S ratio) (Cawthon, 2009). There was very little variability between the triplicate readings (<2%) in samples from the two study groups, confirming the good reliability of the quantitative PCR assays.
Statistical analysis
All data were analysed using SPSS, version 20.0 (IBM Corp., Armonk, NY, USA). Two‐way ANOVA (age × aPWV) was used to investigate the relationship between aPWV and haemodynamic and biochemical variables, including the T/S ratio. A test for interaction was used to determine whether age modified any of these associations, with planned contrasts used to examine differences between aPWV groups for younger and older individuals, respectively. A modified Bonferroni correction was applied to adjust for multiple comparisons. Pearson correlation coefficients were used to determine bivariate correlations between variables. Finally, within each age group, multiple regression analyses based on the enter method were performed to determine those parameters remaining independently associated with aPWV, after including variables traditionally known to confound measurements of aPWV (McEniery et al. 2010). Linear models were chosen after establishing that these provided similar associations with age compared to non‐linear approaches. Log‐transformed T/S ratio values were used for all analyses because the T/S ratio was non‐normally distributed. Unless otherwise stated, the results are expressed as the mean ± SD. P < 0.05 was considered statistically significant.
Results
In total, 96 samples were excluded from the analysis because of poor quality or insufficient DNA to enable accurate detection of TL, yielding 422 young participants (212 with low aPWV and 210 with high aPWV) and 482 older participants (242 with low aPWV and 240 with high aPWV) in whom complete data were available (Fig. 1).
Anthropometric characteristics
Anthropometric characteristics are presented in Table 1. In the younger participants, only weight and body mass index (BMI) were significantly higher in those with high vs. low aPWV (P = 0.013 and P = 0.016, respectively). However, in older participants, weight, BMI, smoking status and pack years were all significantly higher in those with high vs. low aPWV (P < 0.001, P = 0.001, P = 0.026 and P = 0.002, respectively). Age significantly modified the relationship between aPWV and smoking pack years (P = 0.017).
Table 1.
Comparisons and interactions between demographic, haemodynamic and biochemical variables for low and high aPWV groups in younger and older individuals
| Younger | Older | |||||
|---|---|---|---|---|---|---|
| Low | High | Low | High | Overall ANOVA | Interaction | |
| Parameter | aPWV | aPWV | aPWV | aPWV | P value | P value |
| n | 212 | 210 | 242 | 240 | ||
| Age (years) | 20 ± 4 | 20 ± 2 | 68 ± 7 | 67 ± 7 | <0.001 | 0.060 |
| Sex (% male) | 49 | 49 | 50 | 50 | 0.983 | 0.869 |
| Height (m) | 1.7 ± 0.1 | 1.7 ± 0.1 | 1.7 ± 0.1 | 1.7 ± 0.1 | <0.001 | 0.904 |
| Weight (kg) | 67.3 ± 13.6 | 70.5 ± 13.4* | 72.1 ± 14.1 | 76.7 ± 14.5*** | <0.001 | 0.436 |
| BMI (kg m–2) | 22.7 ± 3.4 | 23.5 ± 3.5* | 25.9 ± 4.2 | 27.1 ± 4.5** | <0.001 | 0.336 |
| Smokers (%) | 10.1 ± 30.1 | 15.0 ± 35.8 | 8.6 ± 26.5 | 13.7 ± 34.5* | <0.001 | 0.776 |
| Smokers (pack years) | 1.0 ± 3.1 | 1.4 ± 3.3 | 4.1 ± 8.0 | 6.7 ± 10.2** | <0.001 | 0.017 |
| Brachial SBP (mmHg) | 116 ± 13 | 115 ± 13 | 139 ± 17 | 140 ± 20 | <0.001 | 0.324 |
| Brachial DBP (mmHg) | 68 ± 8 | 68 ± 8 | 81 ± 9 | 78 ± 9** | <0.001 | 0.051 |
| Brachial PP (mmHg) | 49 ± 12 | 48 ± 11 | 58 ± 13 | 62 ± 15** | <0.001 | 0.010 |
| Brachial MAP (mmHg) | 82 ± 9 | 81 ± 9 | 102 ± 11 | 100 ± 13 | <0.001 | 0.717 |
| HR (beats min–1) | 67 ± 12 | 68 ± 12* | 64 ± 9 | 70 ± 10*** | <0.001 | 0.001 |
| aPWV (m s–1) | 4.6 ± 0.4 | 6.8 ± 0.8*** | 7.3 ± 1.2 | 12.4 ± 2.2*** | <0.001 | <0.001 |
| Adj aPWV (m s–1) | 4.6 ± 0.4 | 6.9 ± 0.5*** | 6.7 ± 0.8 | 12.1 ± 1.6*** | <0.001 | <0.001 |
| Total cholesterol (mmol l–1) | 3.94 ± 0.83 | 4.16 ± 0.88** | 5.65 ± 1.11 | 5.54 ± 1.08 | <0.001 | 0.011 |
| HDL (mmol l–1) | 1.40 ± 0.40 | 1.49 ± 0.40* | 1.61 ± 0.39 | 1.49 ± 0.43** | <0.001 | <0.001 |
| LDL (mmol l–1) | 2.16 ± 0.70 | 2.23 ± 0.76 | 3.49 ± 0.92 | 3.35 ± 0.94 | <0.001 | 0.059 |
| Triglycerides (mmol l–1) | 0.96 ± 0.67 | 1.10 ± 0.07 | 1.29 ± 0.64 | 1.49 ± 0.43*** | <0.001 | 0.001 |
| Glucose (mmol l–1) | 4.81 ± 0.97 | 4.78 ± 1.68 | 5.09 ± 2.86 | 5.17 ± 1.38 | 0.067 | 0.656 |
| CRP (mg l–1) | 2.25 ± 3.45 | 2.27 ± 2.83 | 2.67 ± 3.91 | 4.17 ± 6.05** | 0.001 | 0.169 |
| Log‐transformed T/S ratio | 0.100 ± 0.118 | 0.076 ± 0.086* | 0.012 ± 0.111 | 0.052 ± 0.099*** | <0.001 | <0.001 |
SBP, systolic blood pressure; DBP, diastolic blood pressure; PP, pulse pressure; Adj aPWV, aortic pulse wave velocity adjusted for mean arterial pressure; LDL, low‐density lipoprotein. Overall ANOVA represents the results of two‐way ANOVA. Interaction represents the age × aPWV interaction term. * P < 0.05, ** P < 0.01 and *** P < 0.001 vs. the Low aPWV group.
Haemodynamic indices
Haemodynamic indices are presented in Fig. 2 and Table 1. No significant differences were observed between younger participants with low vs. high aPWV. By contrast, in older participants, brachial diastolic blood pressure was significantly lower and pulse pressure and heart rate were significantly higher in those with high aPWV (P = 0.002, P = 0.004 and P < 0.001, respectively). Age significantly modified the relationship between aPWV and brachial pulse pressure and heart rate (P = 0.010 and 0.001, respectively).
Figure 2. Difference in T/S ratio between the Low and High aPWV groups.
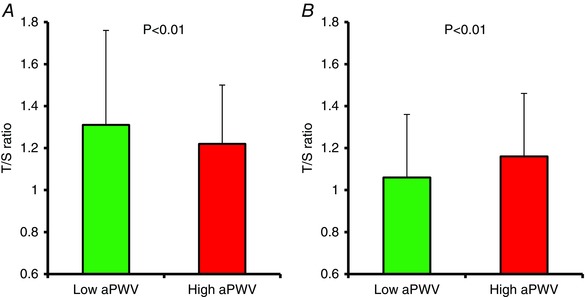
A, younger individuals. B, older individuals. [Color figure can be viewed at wileyonlinelibrary.com]
Biochemical indices
Total and high‐density lipoprotein (HDL) cholesterol were both significantly higher in younger participants with high aPWV vs. those with low aPWV (P = 0.007 and P = 0.018, respectively). By contrast, HDL was significantly lower (P = 0.002) and triglycerides and CRP significantly higher (P < 0.001 and P = 0.001, respectively) in older participants with high aPWV vs. those with low aPWV. Age significantly modified the relationship between aPWV and total cholesterol, HDL cholesterol and triglycerides (P = 0.011, P < 0.001 and P = 0.001, respectively).
Telomere length
As hypothesized, the T/S ratio was significantly lower in young participants with high aPWV vs. those with low aPWV (P = 0.017). By contrast, the T/S ratio was significantly higher in older participants with high aPWV vs. those with low aPWV (P < 0.001). Age significantly modified the relationship between aPWV and T/S ratio (P < 0.001). Treating the data as continuous variables, aPWV was inversely correlated with T/S ratio (r = −0.12, P = 0.013) in younger participants but positively correlated with T/S ratio in older participants (r = 0.20, P < 0.001). In multiple regression analyses, after entering traditional confounding factors, the T/S ratio remained independently associated with aPWV in both younger and older participants. However, the association remained inverse in younger participants (Table 2) but positive in older participants (Table 3).
Table 2.
Multiple regression analysis illustrating the parameters associated with aPWV in younger individuals
| Dependent variable: aPWV | Unstandardized β | SE | Standardized coefficients (β) | t | P value |
|---|---|---|---|---|---|
| Age | 0.073 | 0.240 | 0.147 | 2.997 | 0.003 |
| Sex | −0.221 | 0.121 | −0.089 | −1.822 | 0.069 |
| Mean arterial pressure | 0.019 | 0.008 | 0.135 | 2.557 | 0.011 |
| Heart rate | 0.013 | 0.005 | 0.126 | 2.472 | 0.014 |
| BMI | 0.035 | 0.019 | 0.094 | 1.895 | 0.059 |
| Smoking status | 0.194 | 0.106 | 0.087 | 1.822 | 0.069 |
| T/S ratio | −1.375 | 0.581 | −0.113 | −2.368 | 0.018 |
Table 3.
Multiple regression analysis illustrating the parameters associated with aPWV in older individuals
| Dependent variable: aPWV | Unstandardized β | SE | Standardized coefficients (β) | t | P value |
|---|---|---|---|---|---|
| Age | 0.088 | 0.019 | 0.199 | 4.702 | <0.001 |
| Sex | −0.287 | 0.276 | −0.046 | −1.217 | 0.299 |
| Mean arterial pressure | 0.048 | 0.011 | 0.181 | 4.158 | <0.001 |
| Heart rate | 0.087 | 0.013 | 0.284 | 6.557 | <0.001 |
| BMI | 0.091 | 0.031 | 0.128 | 2.912 | 0.004 |
| Smoking status | 0.161 | 0.148 | 0.048 | 1.090 | 0.276 |
| T/S ratio | 4.709 | 1.289 | 0.160 | 3.653 | <0.001 |
Discussion
The present study is the first to illustrate that age modifies the association between TL and aPWV in healthy individuals, with an inverse association present in younger individuals and a positive association present in older individuals. These data suggest that the links between cellular and vascular ageing reflect a complex interaction between genetic and environmental factors acting over the life‐course.
Our data are in agreement with the majority of published studies showing that shorter TL is associated with increased chronological age (Blasco, 2005). TL is also considered to be significantly affected by genetics, (Brouilette et al. 2008; Samani & van der Harst, 2008), together with psychosocial and environmental factors such as hostility (Brydon et al. 2012), educational attainment (Steptoe et al. 2011), sleep duration (Jackowska et al. 2011) and oxidative stress (Kiecolt‐Glaser et al. 2013; Tarry‐Adkins & Ozanne, 2014). Moreover, TL has been linked with both metabolic and CV outcomes in recent meta‐analyses (Haycock et al. 2014; D'Mello et al. 2015), albeit with significant heterogeneity between observations within these studies. Interestingly, recent data also suggest that both genetic and environmental factors affect large artery stiffness (McEniery et al. 2008; Yasmin & O'Shaughnessy, 2008; Mitchell et al. 2012; McDonnell et al. 2013) and a recent large meta‐analysis demonstrated that aPWV independently predicts stroke and CV outcomes (Ben‐Shlomo et al. 2014). However, the links between cellular and vascular ageing are not well understood, and merit further investigation.
A recent longitudinal study illustrated that a faster rate of telomere shortening is associated with increased carotid intima‐media thickness (Masi et al. 2014) in middle‐aged individuals, indicating that accelerated cellular ageing is associated with early atherosclerosis. Furthermore, cross‐sectional studies have shown that a shorter TL is associated with measures of vascular stiffness, including increased aPWV and reduced carotid distensibility (Benetos et al. 2001; Nawrot et al. 2010; Wang et al. 2011). However, other cross‐sectional studies have reported no association between TL and arterial stiffness in females (Benetos et al. 2001) and in diabetics (Tentolouris et al. 2007). Unfortunately, all of these studies contained relatively few subjects, with significant associations between TL and stiffness being reported in males only. Moreover, the studies included predominantly older adults, in whom the degree of life‐course exposure to cardiovascular risk factors probably differed significantly between individuals.
In the present study, we examined distinct groups of younger and older individuals, selected from the extremes of the aPWV distribution. This approach allowed us to explore the association between cellular and vascular ageing with sufficient power. However, we attempted to minimize the confounding influence of blood pressure on aPWV by selecting samples for analysis of TL based on aPWV values that had been adjusted for blood pressure. The significant, inverse association between aPWV and TL observed in younger individuals suggests that cellular and vascular ageing may be linked in these individuals, with TL remaining independently associated with aPWV in multiple regression analyses. Aortic stiffness is relatively homogeneous in younger individuals, with a smaller spread of values and a SD from the mean of approximately half that seen in individuals aged >50 years (McEniery et al. 2005). This homogeneity may reflect the limited exposure to cardiovascular and other risk factors in younger, compared to older, individuals. Nevertheless, meaningful differences in aPWV can still be observed in younger subjects, especially when extremes of the distribution are considered, as in the present study. Indeed, based on our data, a difference of 0.09 in T/S ratio was equivalent to a difference in vascular age of approximately 20 years, according to the spread of aPWV values for the whole group.
By contrast, although aortic stiffness is greater in older individuals, it is much more heterogeneous, which most probably reflects variations between individuals in life‐course environmental exposures, and their interaction with genetics and/or early life factors. As such, the positive association between TL and aPWV observed in older individuals in the present study argues against any direct link between cellular and vascular ageing in these individuals. Instead, it may be that associations between cellular and vascular ageing in certain individuals are influenced by exposure to common (or different) risk factors, or that different processes drive different biological markers of ageing in older individuals. Alternatively, recent data suggest that individuals with longer TL at younger ages tend to show a greater rate of TL shortening with age (Muezzinler et al. 2013; Weischer et al. 2014), which may account for some of our findings. Interestingly inter‐individual differences in TL are assumed to be established early in life (Daniali et al. 2013) and may partly determine individual trajectories of TL shortening over the life‐course. However, our data in older individuals are probably influenced by a healthy survivor effect. That is, individuals with high aPWV and short TL may have been selected out of the analysis because of the presence or a history of CV disease and events. Nevertheless, the current data in older individuals may explain, in part, the heterogeneity between TL and CV outcomes (Weischer et al. 2014; D'Mello et al. 2015) and cerebrovascular disease (Haycock et al. 2014) reported previously and raise the question of whether TL alone should be used as a marker of CV risk in older individuals because many factors decrease or even increase TL, independently of age.
Clearly any observed association between TL and aPWV in our data relies on the assumption that leukocyte TL reflects the TL of aortic tissue, which may not necessarily be the case. Indeed, a previous study based on post‐mortem tissue (Takubo et al. 2002) found no evidence of a cross‐sectional association between age and TL in myocardium or cerebral cortex (probably reflecting the post‐mitotic nature of these tissues), despite significant correlations in other tissues. Two comparatively small studies of aortic tissue biopsies have reported contradictory findings. In 51 individuals aged between 1 month and 80 years, there was a significant age‐associated reduction in aortic TL (Okuda et al. 2000). However, in a further study, TL of leukocytes and aortic tissue biopsies were significantly correlated, both in patients undergoing elective abdominal aortic aneurysm repair or controls without aortic disease at the time of cadaveric donation (Wilson et al. 2008). However, in this relatively small study population, there was no correlation between either aortic or leukocyte TL and age, although the age‐range of the study population was narrow.
The present study has some limitations. As a result of the cross‐sectional design, it was not possible to examine causal relationships or assess inter‐individual differences in the rate of TL shortening. Moreover, although we consider that our strategy of comparing TL between extremes of aPWV provided a robust approach for evaluating the relationship between cellular and vascular ageing, the use of extreme samples may increase the potential for sampling bias and could overestimate the strength of associations between variables (Salkind, 2010). Furthermore, in adjusting aPWV for differences in blood pressure, we cannot exclude the possibility that the pressure‐dependence of aPWV differs between younger and older individuals. Because of the retrospective nature of the study, it was not possible to measure telomerase activity, which may have been increased to protect the telomeres from oxidative stress, degradation and shortening, as has been suggested in other studies (Brydon et al. 2012; Kiecolt‐Glaser et al. 2013). Finally, any observed association between TL and aPWV in our data relies upon the assumption that leukocyte TL reflects TL within the aortic wall, which we were unable to confirm in the present study.
In conclusion, we have shown, for the first time, an inverse association between TL and aPWV in younger individuals but a positive association in older individuals. Therefore, our data illustrate that age significantly modifies the relationship between aPWV and TL in healthy individuals. These data suggest that links between cellular and vascular ageing reflect a complex interaction between genetic and environmental factors acting over the whole life‐course and that future studies should take account of this possibility. Future longitudinal studies are therefore required to better understand these factors throughout the life‐course of biological ageing and their implications in understanding CV risk.
Additional information
Competing interests
The authors declare that they have no competing interests.
Author contributions
All haemodynamic data were collected between Cardiff and Cambridge as part of the Anglo‐Cardiff Collaborative Trial. Blood samples were analysed in Addenbrooke's Hospital, University of Cambridge. Telomere samples were analysed in the Biomedical Sciences laboratory, Cardiff School of Health Sciences, Cardiff Metropolitan University. JRC and IBW contributed to the conception or design of the work. BMD, Y, LB, CME, IBW, JE and JRC contributed to the acquisition, analysis or interpretation of data. BMD, Y, LB, CME, IBW, JE and JRC drafted the work or revised it critically for important intellectual content. All authors have approved the final version of the manuscript and agree to be accountable for all aspects of the work in ensuring that questions related to the accuracy or integrity of any part of the work are appropriately investigated and resolved. All persons designated as authors qualify for authorship, and all those who qualify for authorship are listed.
Funding
Professor Ian B. Wilkinson is a British Heart Foundation Senior Fellow (FS/12/8/29377). Dr Yasmin is supported by the British Heart Foundation (FS/12/8/29377). This work was also supported by the National Institute for Health Research, Cambridge Biomedical Research Centre Award.
Acknowledgements
The ACCT Study Investigators are: John Cockcroft, Lisa Day, Stacey Hickson, Julia Howard, Kaisa Maki‐Petaja, Karen Miles, Maggie Munnery, Barry McDonnell, Carmel McEniery, Pawan Pusalkar, Christopher Retallick, James Sharman, Jane Smith, Jean Woodcock‐Smith, Ian Wilkinson and Yasmin. We also thank Gareth Edwards and Sarah Cleary for their technical support.
References
- Artandi SE (2006). Telomeres, telomerase, and human disease. N Engl J Med 355, 1195–1197. [DOI] [PubMed] [Google Scholar]
- Ben‐Shlomo Y, Spears M, Boustred C, May M, Anderson SG, Benjamin EJ, Boutouyrie P, Cameron J, Chen CH, Cruickshank JK, Hwang SJ, Lakatta EG, Laurent S, Maldonado J, Mitchell GF, Najjar SS, Newman AB, Ohishi M, Pannier B, Pereira T, Vasan RS, Shokawa T, Sutton‐Tyrell K, Verbeke F, Wang KL, Webb DJ, Hansen TW, Zoungas S, McEniery CM, Cockcroft JR & Wilkinson IB (2014). Aortic pulse wave velocity improves cardiovascular event prediction: an individual participant meta‐analysis of prospective observational data from 17,635 subjects. J Am Coll Cardiol 63, 636–646. [DOI] [PMC free article] [PubMed] [Google Scholar]
- Benetos A, Okuda K, Lajemi M, Kimura M, Thomas F, Skurnick J, Labat C, Bean K & Aviv A (2001). Telomere length as an indicator of biological aging: the gender effect and relation with pulse pressure and pulse wave velocity. Hypertension 37, 381–385. [DOI] [PubMed] [Google Scholar]
- Blasco MA (2005). Telomeres and human disease: ageing, cancer and beyond. Nat Rev Genet 6, 611–622. [DOI] [PubMed] [Google Scholar]
- Brouilette SW, Whittaker A, Stevens SE, van der Harst P, Goodall AH & Samani NJ (2008). Telomere length is shorter in healthy offspring of subjects with coronary artery disease: support for the telomere hypothesis. Heart 94, 422–425. [DOI] [PubMed] [Google Scholar]
- Brydon L, Lin J, Butcher L, Hamer M, Erusalimsky JD, Blackburn EH & Steptoe A (2012). Hostility and cellular aging in men from the Whitehall II cohort. Biol Psychiatry 71, 767–773. [DOI] [PMC free article] [PubMed] [Google Scholar]
- Cawthon RM (2009). Telomere length measurement by a novel monochrome multiplex quantitative PCR method. Nucleic Acids Res 37, e21. [DOI] [PMC free article] [PubMed] [Google Scholar]
- D'Mello MJ, Ross SA, Briel M, Anand SS, Gerstein H & Pare G (2015). The association between shortened leukocyte telomere length and cardio‐metabolic outcomes: a systematic review and meta‐analysis. Circ Cardiovasc Genet 1, 82–90. [DOI] [PubMed] [Google Scholar]
- Daniali L, Benetos A, Susser E, Kark JD, Labat C, Kimura M, Desai K, Granick M & Aviv A (2013). Telomeres shorten at equivalent rates in somatic tissues of adults. Nat Commun 4, 1597–1602. [DOI] [PMC free article] [PubMed] [Google Scholar]
- De Meyer T, Van Daele CM, De Buyzere ML, Denil S, De Bacquer D, Segers P, Cooman L, De Backer GG, Gillebert TC, Bekaert S & Rietzschel ER (2012). No shorter telomeres in subjects with a family history of cardiovascular disease in the Asklepios study. Arterioscler Thromb Vasc Biol 32, 3076–3081. [DOI] [PubMed] [Google Scholar]
- Haycock PC, Heydon EE, Kaptoge S, Butterworth AS, Thompson A & Willeit P (2014). Leucocyte telomere length and risk of cardiovascular disease: systematic review and meta‐analysis. BMJ 349, g4227. [DOI] [PMC free article] [PubMed] [Google Scholar]
- Huzen J, de Boer RA, van Veldhuisen DJ, van Gilst WH & van der Harst P (2010). The emerging role of telomere biology in cardiovascular disease. Front Biosci (Landmark Ed) 15, 35–45. [DOI] [PubMed] [Google Scholar]
- Jackowska M, Dockray S, Hendrickx H & Steptoe A (2011). Psychosocial factors and sleep efficiency: discrepancies between subjective and objective evaluations of sleep. Psychosom Med 73, 810–816. [DOI] [PubMed] [Google Scholar]
- Karlseder J, Smogorzewska A & de Lange T (2002). Senescence induced by altered telomere state, not telomere loss. Science 295, 2446–2449. [DOI] [PubMed] [Google Scholar]
- Kiecolt‐Glaser JK, Epel ES, Belury MA, Andridge R, Lin J, Glaser R, Malarkey WB, Hwang BS & Blackburn E (2013). Omega‐3 fatty acids, oxidative stress, and leukocyte telomere length: a randomized controlled trial. Brain Behav Immun 28, 16–24. [DOI] [PMC free article] [PubMed] [Google Scholar]
- London G (2001). Pathophysiology of cardiovascular damage in the early renal population. Nephrol Dial Transplant 16 Suppl 2, 3–6. [DOI] [PubMed] [Google Scholar]
- Masi S, D'Aiuto F, Martin‐Ruiz C, Kahn T, Wong A, Ghosh AK, Whincup P, Kuh D, Hughes A, von Zglinicki T, Hardy R & Deanfield JE (2014). Rate of telomere shortening and cardiovascular damage: a longitudinal study in the 1946 British Birth Cohort. Eur Heart J 35, 3296–3303. [DOI] [PMC free article] [PubMed] [Google Scholar]
- McDonnell BJ, Maki‐Petaja KM, Munnery M, Yasmin, Wilkinson IB , Cockcroft JR & McEniery CM (2013). Habitual exercise and blood pressure: age dependency and underlying mechanisms. Am J Hypertens 26, 334–341. [DOI] [PubMed] [Google Scholar]
- McEniery CM, Yasmin, Hall IR , Qasem A, Wilkinson IB & Cockcroft JR (2005). Normal vascular aging: differential effects on wave reflection and aortic pulse wave velocity: the Anglo‐Cardiff Collaborative Trial (ACCT). J Am Coll Cardiol 46, 1753–1760. [DOI] [PubMed] [Google Scholar]
- McEniery CM, Yasmin, Maki‐Petaja KM , McDonnell BJ, Munnery M, Hickson SS, Franklin SS, Cockcroft JR & Wilkinson IB (2010). The impact of cardiovascular risk factors on aortic stiffness and wave reflections depends on age: the Anglo‐Cardiff Collaborative Trial (ACCT III). Hypertension 56, 591–597. [DOI] [PubMed] [Google Scholar]
- McEniery CM, Yasmin, McDonnell B , Munnery M, Wallace SM, Rowe CV, Cockcroft JR & Wilkinson IB (2008). Central pressure: variability and impact of cardiovascular risk factors: the Anglo‐Cardiff Collaborative Trial II. Hypertension 51, 1476–1482. [DOI] [PubMed] [Google Scholar]
- Mitchell GF, Verwoert GC, Tarasov KV, Isaacs A, Smith AV, Yasmin, Rietzschel ER, Tanaka T, Liu Y, Parsa A, Najjar SS, O'Shaughnessy KM, Sigurdsson S, De Buyzere ML, Larson MG, Sie MP, Andrews JS, Post WS, Mattace‐Raso FU, McEniery CM, Eiriksdottir G, Segers P, Vasan RS, van Rijn MJ, Howard TD, McArdle PF, Dehghan A, Jewell ES, Newhouse SJ, Bekaert S, Hamburg NM, Newman AB, Hofman A, Scuteri A, De Bacquer D, Ikram MA, Psaty BM, Fuchsberger C, Olden M, Wain LV, Elliott P, Smith NL, Felix JF, Erdmann J, Vita JA, Sutton‐Tyrrell K, Sijbrands EJ, Sanna S, Launer LJ, De Meyer T, Johnson AD, Schut AF, Herrington DM, Rivadeneira F, Uda M, Wilkinson IB, Aspelund T, Gillebert TC, Van Bortel L, Benjamin EJ, Oostra BA, Ding J, Gibson Q, Uitterlinden AG, Abecasis GR, Cockcroft JR, Gudnason V, De Backer GG, Ferrucci L, Harris TB, Shuldiner AR, van Duijn CM, Levy D, Lakatta EG & Witteman JC (2012). Common genetic variation in the 3′‐BCL11B gene desert is associated with carotid‐femoral pulse wave velocity and excess cardiovascular disease risk: the AortaGen Consortium. Circ Cardiovasc Genet 5, 81–90. [DOI] [PMC free article] [PubMed] [Google Scholar]
- Mora S, Cook N, Buring JE, Ridker PM & Lee IM (2007). Physical activity and reduced risk of cardiovascular events: potential mediating mechanisms. Circulation 116, 2110–2118. [DOI] [PMC free article] [PubMed] [Google Scholar]
- Morgan RG, Ives SJ, Walker AE, Cawthon RM, Andtbacka RH, Noyes D, Lesniewski LA, Richardson RS & Donato AJ (2014). Role of arterial telomere dysfunction in hypertension: relative contributions of telomere shortening and telomere uncapping. J Hypertens 32, 1293–1299. [DOI] [PMC free article] [PubMed] [Google Scholar]
- Muezzinler A, Zaineddin AK & Brenner H (2013). A systematic review of leukocyte telomere length and age in adults. Ageing Res Rev 12, 509–519. [DOI] [PubMed] [Google Scholar]
- Nawrot TS, Staessen JA, Holvoet P, Struijker‐Boudier HA, Schiffers P, Van Bortel LM, Fagard RH, Gardner JP, Kimura M & Aviv A (2010). Telomere length and its associations with oxidized‐LDL, carotid artery distensibility and smoking. Front Biosci (Elite Ed) 2, 1164–1168. [DOI] [PubMed] [Google Scholar]
- Okuda K, Khan MY, Skurnick J, Kimura M, Aviv H & Aviv A (2000). Telomere attrition of the human abdominal aorta: relationships with age and atherosclerosis. Atherosclerosis 152, 391–398. [DOI] [PubMed] [Google Scholar]
- O'Brien E, Mee F, Atkins N & Thomas M (1996). Evaluation of three devices for self‐measurement of blood pressure according to the revised British Hypertension Society Protocol: the Omron HEM‐705CP, Philips HP5332, and Nissei DS‐175. Blood Press Monit 1, 55–61. [PubMed] [Google Scholar]
- Safar ME, Levy BI & Struijker‐Boudier H (2003). Current perspectives on arterial stiffness and pulse pressure in hypertension and cardiovascular diseases. Circulation 107, 2864–2869. [DOI] [PubMed] [Google Scholar]
- Salkind N (2010). Encyclopedia of Research Design, vol. 1 SAGE, Thousand Oaks, CA. [Google Scholar]
- Samani NJ & van der Harst P (2008). Biological ageing and cardiovascular disease. Heart 94, 537–539. [DOI] [PubMed] [Google Scholar]
- Steptoe A, Hamer M, Butcher L, Lin J, Brydon L, Kivimaki M, Marmot M, Blackburn E & Erusalimsky JD (2011). Educational attainment but not measures of current socioeconomic circumstances are associated with leukocyte telomere length in healthy older men and women. Brain Behav Immun 25, 1292–1298. [DOI] [PubMed] [Google Scholar]
- Takubo K, Izumiyama‐Shimomura N, Honma N, Sawabe M, Arai T, Kato M, Oshimura M & Nakamura K (2002). Telomere lengths are characteristic in each human individual. Exp Gerontol 37, 523–531. [DOI] [PubMed] [Google Scholar]
- Tarry‐Adkins JL & Ozanne SE (2014). The impact of early nutrition on the ageing trajectory. Proc Nutr Soc 73, 289–301. [DOI] [PubMed] [Google Scholar]
- Tentolouris N, Nzietchueng R, Cattan V, Poitevin G, Lacolley P, Papazafiropoulou A, Perrea D, Katsilambros N & Benetos A (2007). White blood cells telomere length is shorter in males with type 2 diabetes and microalbuminuria. Diabetes Care 30, 2909–2915. [DOI] [PubMed] [Google Scholar]
- Wang YY, Chen AF, Wang HZ, Xie LY, Sui KX & Zhang QY (2011). Association of shorter mean telomere length with large artery stiffness in patients with coronary heart disease. Aging Male 14, 27–32. [DOI] [PubMed] [Google Scholar]
- Weischer M, Bojesen SE & Nordestgaard BG (2014). Telomere shortening unrelated to smoking, body weight, physical activity, and alcohol intake: 4,576 general population individuals with repeat measurements 10 years apart. PLoS Genet 10, e1004191. [DOI] [PMC free article] [PubMed] [Google Scholar]
- Wilkinson IB, Fuchs SA, Jansen IM, Spratt JC, Murray GD, Cockcroft JR & Webb DJ (1998). Reproducibility of pulse wave velocity and augmentation index measured by pulse wave analysis. J Hypertens 16, 2079–2084. [DOI] [PubMed] [Google Scholar]
- Wilson WR, Herbert KE, Mistry Y, Stevens SE, Patel HR, Hastings RA, Thompson MM & Williams B (2008). Blood leucocyte telomere DNA content predicts vascular telomere DNA content in humans with and without vascular disease. Eur Heart J 29, 2689–2694. [DOI] [PubMed] [Google Scholar]
- Yasmin, McEniery CM , Wallace S, Dakham Z, Pulsalkar P, Maki‐Petaja K, Ashby MJ, Cockcroft JR & Wilkinson IB (2005). Matrix metalloproteinase‐9 (MMP‐9), MMP‐2, and serum elastase activity are associated with systolic hypertension and arterial stiffness. Arterioscler Thromb Vasc Biol 25, 372–378. [DOI] [PubMed] [Google Scholar]
- Yasmin & O'Shaughnessy KM (2008). Genetics of arterial structure and function: towards new biomarkers for aortic stiffness? Clin Sci (Lond) 114, 661–677. [DOI] [PubMed] [Google Scholar]