

Abstract
Key points
Canonical transient receptor potential (TRPC)3 and TRPC6 channels of vascular smooth muscle cells (VSMCs) mediate stretch‐ or agonist‐induced cationic fluxes, contributing to membrane potential and vascular tone.
Native TRPC3/C6 channels can form homo‐ or heterotetrameric complexes, which can hinder individual TRPC channel properties. The possibility that the differences in their association pattern may change their contribution to vascular tone in hypertension is unexplored.
Functional characterization of heterologously expressed channels showed that TRPC6‐containing complexes exhibited Pyr3/Pyr10‐sensitive currents, whereas TRPC3‐mediated currents were blocked by anti‐TRPC3 antibodies.
VSMCs from hypertensive (blood pressure high; BPH) mice have larger cationic basal currents insensitive to Pyr10 and sensitive to anti‐TRPC3 antibodies. Consistently, myography studies showed a larger Pyr3/10‐induced vasodilatation in BPN (blood pressure normal) mesenteric arteries.
We conclude that the increased TRPC3 channel expression in BPH VSMCs leads to changes in TRPC3/C6 heteromultimeric assembly, with a higher TRPC3 channel contribution favouring depolarization of hypertensive VSMCs.
Abstract
Increased vascular tone in essential hypertension involves a sustained rise in total peripheral resistance. A model has been proposed in which the combination of membrane depolarization and higher L‐type Ca2+ channel activity generates augmented Ca2+ influx into vascular smooth muscle cells (VSMCs), contraction and vasoconstriction. The search for culprit ion channels responsible for membrane depolarization has provided several candidates, including members of the canonical transient receptor potential (TRPC) family. TRPC3 and TRPC6 are diacylglycerol‐activated, non‐selective cationic channels contributing to stretch‐ or agonist‐induced depolarization. Conflicting information exists regarding changes in TRPC3/TRPC6 functional expression in hypertension. However, although TRPC3‐TRPC6 channels can heteromultimerize, the possibility that differences in their association pattern may change their functional contribution to vascular tone is largely unexplored. We probe this hypothesis using a model of essential hypertension (BPH mice; blood pressure high) and its normotensive control (BPN mice; blood pressure normal). First, non‐selective cationic currents through homo‐ and heterotetramers recorded from transfected Chinese hamster ovary cells indicated that TRPC currents were sensitive to the selective antagonist Pyr10 only when TRPC6 was present, whereas intracellular anti‐TRPC3 antibody selectively blocked TRPC3‐mediated currents. In mesenteric VSMCs, basal and agonist‐induced currents were more sensitive to Pyr3 and Pyr10 in BPN cells. Consistently, myography studies showed a larger Pyr3/10‐induced vasodilatation in BPN mesenteric arteries. mRNA and protein expression data supported changes in TRPC3 and TRPC6 proportions and assembly, with a higher TRPC3 channel contribution in BPH VSMCs that could favour cell depolarization. These differences in functional and pharmacological properties of TRPC3 and TRPC6 channels, depending on their assembly, could represent novel therapeutical opportunities.
Keywords: essential hypertension, TRP channels, vascular smooth muscle
Key points
Canonical transient receptor potential (TRPC)3 and TRPC6 channels of vascular smooth muscle cells (VSMCs) mediate stretch‐ or agonist‐induced cationic fluxes, contributing to membrane potential and vascular tone.
Native TRPC3/C6 channels can form homo‐ or heterotetrameric complexes, which can hinder individual TRPC channel properties. The possibility that the differences in their association pattern may change their contribution to vascular tone in hypertension is unexplored.
Functional characterization of heterologously expressed channels showed that TRPC6‐containing complexes exhibited Pyr3/Pyr10‐sensitive currents, whereas TRPC3‐mediated currents were blocked by anti‐TRPC3 antibodies.
VSMCs from hypertensive (blood pressure high; BPH) mice have larger cationic basal currents insensitive to Pyr10 and sensitive to anti‐TRPC3 antibodies. Consistently, myography studies showed a larger Pyr3/10‐induced vasodilatation in BPN (blood pressure normal) mesenteric arteries.
We conclude that the increased TRPC3 channel expression in BPH VSMCs leads to changes in TRPC3/C6 heteromultimeric assembly, with a higher TRPC3 channel contribution favouring depolarization of hypertensive VSMCs.
Abbreviations
- BPH
blood pressure high
- BPN
blood pressure normal
- CHO
Chinese hamster ovary
- DAG
diacylglycerol
- GFP
green fluorescent protein
- GPCR
G‐protein coupled receptors
- HS
hypotonic stimulus
- KO
knockout
- LTCC
L‐type Ca2+ channel
- PLA
proximity ligation assay
- ROCs
receptor operated channels
- SOCs
store‐operated channels
- RFP
red fluorescent protein
- RPB
modified radioimmunoprecipitation assay buffer
- SMDS
smooth muscle dissociation solution
- TRP
transient receptor potential
- TRPC channels
canonical transient receptor potential channels
- VSMCs
vascular smooth muscle cells
Introduction
Smooth muscle cells of blood vessels (vascular smooth muscle cells; VSMCs) act as critical determinants of blood pressure by modulating the vessel diameter and hence blood flow. Most importantly, vascular disease resulting in high blood pressure is among the most common causes of death and disability in the western world.
Ion channels initiate and regulate contraction and VSMC tone, modulating intracellular [Ca2+] levels. The identification of ion channel genes expressed in VSMCs has significantly improved our knowledge of the signalling pathways leading to VSMC contraction, as well as their possible contribution to pathophysiological conditions. Although L‐type, voltage‐dependent Ca2+ channel (LTCC) is the primary pathway for Ca2+ influx in VSMC, non‐selective cation channels have also been identified as important players in the regulation of vascular tone, either modulating membrane potential or providing a Ca2+ entry pathway independent of the activation of LTCCs (Albert & Large, 2006).
The molecular correlates of the non‐selective cation channels expressed in VSMCs are members of the transient receptor potential (TRP) family. TRP channels are activated by vasoconstrictors, by membrane stretch and by Ca2+ store depletion (Dietrich et al. 2006; Nilius & Honoré, 2012), and the canonical TRP (TRPC) family has been proposed as the molecular constituent of receptor‐ and stretch‐operated channels (ROCs and SOCs, respectively) that link the diacylglycerol (DAG) signalling cascade pathway to the activation of LTCCs. The seven TRPC family members can be classified into subfamilies on the basis of their amino acid similarity. Among them, the TRPC3/6/7 subfamily has been proposed as the DAG‐activated ROCs (Hofmann et al., 1999, 2002), although TRPC7 channels have not been found in the vasculature (Earley & Brayden, 2015).
Despite years of study characterizing the biophysical properties and the functional roles of TRPC3 and TRPC6 channels, surprisingly little is known regarding their contribution to vasoconstriction and vasorelaxation in arteries. Several reasons contribute to the paucity of these studies, including their lack of distinct biophysical properties and the shortage of selective pharmacological blockers. Moreover, the use of small interfering RNA approaches to study these channels in cultured VSMCs has provided information that is not easy to interpret in terms of the contribution of the channels to the regulation of VSMCs contractility because cultured VSMCs undergo phenotypic modulation and show lost contractile properties (Owens et al. 2004). In recent years, knockout (KO) animals and more selective pharmacological agents have provided better approaches for studying the contribution of these channels to vascular tone. However, no conclusive results could be obtained from TRPC3 and TRPC6 KO animals. Neither agonist‐induced, nor pressure‐evoked contraction was reduced in arteries from TRPC6‐KO mice because upregulation of TRPC3 channels provided a compensatory vasoconstrictor mechanism in these animals (Dietrich et al. 2005). Although these channels have been described in VSMCs from many arteries, as for TRPC3‐KO, the TRPC3‐deficient mice phenotype shows an impaired vasodilatation related to the lack of endothelial TRPC3 channels (Senadheera et al. 2012; Yeon et al. 2014). In any case, the combination of several of these approaches enables the distinction of the contributions of these two channels to vascular tone in different vascular beds. TRPC6 channels are linked to pressure‐induced (myogenic) vasoconstriction and can also be activated by a variety of G‐protein coupled receptors (GPCR) ligands (Mederos y Schnitzler et al. 2008; Gonzales et al. 2014; Earley & Brayden, 2015). However, the mechanisms linking stretch or mechanical stimuli to TRPC6 channels activation remain controversial. Although some studies suggest that TRPC6 channels could be intrinsically mechanosensitive (Wilson & Dryer, 2014), other laboratories conclude that TRPC6 channel gating in response to stretch is an indirect effect resulting from the mechanical activation of GPCR (Sharif‐Naeini et al. 2008; Gonzales et al. 2014). An interesting proposal that can solve this controversy sugggests that both mechanisms could be acting in a synergistic way, so that simultaneous receptor‐mediated and mechanical stimulation could amplify calcium influx through TRPC6 channels (Inoue et al. 2009). TRPC6 channel exhibits mechanosensitivity only after its receptor‐mediated activation via PLC/diacylglycerol and PLA2/ 20‐HETE pathways.
TRPC3 channels contribute to basal tone and to agonist‐induced vasoconstriction but do not appear to have a role in the myogenic response (Reading et al. 2005; Dietrich et al. 2006). However, these studies also show some discrepancies regarding the expression and the functional contribution of these channels in different preparations and leave several relevant questions unanswered. In particular, the characterization of the unique contributions of these two channels in pathophysiological contexts with an altered vascular tone has not been defined. An increased expression of TRPC3 channels in conduit arteries from hypertensive animals has been reported (Liu et al. 2009; Noorani et al. 2011), although their expression and functional contribution in VSMCs from resistance arteries remain a matter of debate (Reading et al. 2005; Adebiyi et al. 2012; Senadheera et al. 2012). Also, the upregulation of TRPC6 channels (with normal TRPC3 channel expression) has been described in mesenteric arteries in other hypertension models (Linde et al. 2012).
Aside from the different models and vascular beds used, these discrepancies can be related to the fact that the contribution of TRPC3 and TRPC6 channels in native VSMCs is dependent on their association as homo‐ or heterotetrameric complexes. Because TRPC3 and TRPC6 expression overlaps in most VSMC tissues and their physical interaction has been demonstrated (Hofmann et al. 2002; Beech et al. 2004; Shin et al. 2011), TRPC3/6 heterotetramers may be the molecular correlate of the native receptor‐operated non‐selective cationic influx in VSMCs. For this reason, the characterization of endogenous TRPC channels in native cell is challenged by the possibility of heteromultimeric associations that can hinder the contribution of an individual TRPC channel (Maruyama et al. 2006). In this regard, the possibility that differences in their association pattern may change their functional contribution to vascular tone is unexplored.
In the present study, we probe this hypothesis using a model of essential hypertension (BPH mice; blood pressure high) and its normotensive control (BPN mice; blood pressure normal) (Schlager & Sides, 1997). We observed changes in the expression of TRPC3 mRNA in mesenteric VSMCs from BPH animals, and we aimed to define its possible contribution to the hypertensive phenotype by determining the functional and pharmacological profile of TRPC3 and TRPC6 homo‐ and heterotetramers, combining studies in native VSMCs, in heterologous expression systems, and in whole arteries. The data obtained indicate that changes in TRPC3 channels expression determine differences in TRPC3 and TRPC6 proportions and assembly, leading to a higher TRPC3 channel contribution in BPH VSMCs that could favour cell depolarization in the hypertensive phenotype.
Methods
Ethical approval
All animal protocols were approved by the Institutional Care and Use Committee of the University of Valladolid, and are in accordance with the European Community guiding principles with respect to the care and use of animals (Directive 2010/63/UE).
Mice protocols
Colonies of BPH and BPN mice (Jackson Laboratories, Bar Harbor, ME, USA) were housed in the animal facility of the School of Medicine of Valladolid, under temperature‐controlledconditions (21 °C) and with unlimited access to water and food. Blood pressure was measured in awake mice with a tail‐cuff pressure meter (LSI Letica Scientific Instruments, Barcelona, Spain) as described previously (Tajada et al. 2012). BPN and BPH mice used in the present study were paired in terms of age, ranging from 16 to 58 weeks (average 36.2 ± 2.4 weeks for BPN and 34.6 ± 1.7 weeks for BPH). However, the weight of BPN animals was significantly larger that BPH mice of matching ages (29.33 ± 0.23 g for BPN vs. 24.37 ± 0.24 g for BPH, n = 69–80, P < 0.001), as described previously (Moreno‐Domínguez et al. 2009). Mice were deeply anaesthetized by isoflurane inhalation (5% at 2.5 l min−1 O2) and killed by decapitation. Mesenteric arteries were obtained as described previously (Moreno‐Domínguez et al. 2009). Briefly, arteries were carefully dissected and cleaned of connective and endothelial tissues in cold (4 °C) oxygenated (95% O2–5% CO2) smooth muscle dissociation solution (SMDS)–10 μm Ca2+ (120 mm NaCl, 4.2 mm KCl, 25 mm NaCHO3, 0.6 mm KH2PO4, 1.2 MgCl2 and 11 mm glucose, pH 7.4). Subsequently, arteries were either frozen at −80 °C for further RNA extraction or used directly for myography measurements or to obtain freshly dispersed VSMCs.
Chinese hamster ovary (CHO) cells culture and transfection
CHO cells were maintained in Dulbecco's modified Eagle's medium supplemented with 10% foetal bovine serum, penicillin‐streptomycin (100 U ml−1 each) and 2 mm L‐glutamine at 37 °C in a 5% CO2 humidified atmosphere. CHO cells were grown as a monolayer in poly‐L‐lysine‐coated coverslips prior to transiently transfection by using TransIT‐X2® System (Mirus, Madison, WI, USA) in accordance with the manufacturer's instructions. Cells were transfected with 1 μg of DNA of hTRPC3‐YFP (kindly provided by Dr Klaus Groschner, University of Graz, Austria), 1 μg of ratTRPC6‐green fluorescent protein (GFP) (a gift from Dr Jason Yuan, U of Arizona) or 0.5 μg of each. Cells were used 24–72 h after transfection.
RNA extraction
RNA extraction was carried out from 30–40 mesenteric arteries from five or six BPN and BPH mice (Cidad et al. 2010). After cleaning of connective, adipose and endothelial tissues, total RNA from arteries was isolated with a MELT™ Total RNA Isolation System Kit (Ambion, Inc., Thermo Fisher Scientific, Waltham, MA USA) in accordance with the manufacturer's instructions. After DNAse I (Ambion, Inc.; Thermo Fisher Scientific) treatment, 500–750 ng of RNA was used for the reverse transcription reaction (2.5 U μl−1 MuLvRT, 1 U μl−1 RNase inhibitor, 2.5 μm random hexamers, 1 × PCR buffer, 5 mm MgCl2 and 4 mm mixed dNTPs; Applied Biosystems, Thermo Fisher Scientific) at 42 °C for 60 min to obtain cDNA. Real‐time PCR was carried out using TaqMan Low‐Density Arrays (Applied Biosystems; Thermo Fisher Scientific) and an ABI Prism 7900HT sequence detection system (Applied Biosystems) at the Genomic Service of the CNIC (Madrid, Spain). Data were analysed with the threshold cycle (Ct) relative quantification method (ΔΔCt) (Livak & Schmittgen, 2001). We analysed two different housekeeping genes: ribosomal protein 18 s (RP18s) and Gapdh. RP18s is included in the arrays such that is also an internal control of the reaction. By contrast, Gapdh serves as an external control because its expression is determined from the same samples in an independent reaction. Because the data obtained with the two housekeeping genes showed no significant differences in expression between BPN and BPH samples, expression data were normalized by the level of ribosomal RNA 18S transcript. The relative abundance of the genes was calculated from 2(–ΔCt), where ΔCt = CtChannel‐Ct18S. Differences between BPN and BPH samples were calculated from 2(–ΔΔCt), where ΔΔCt = ΔCtBPH – ΔCtBPN. In this way, the levels of mRNA in BPH samples are expressed as changes relative to BPN: 2(–ΔΔCt) = 1 will indicate the absence of changes between both preparations; increased expression is denoted by a 2(−ΔΔCt) > 1; and decreases are indicated by 2(–ΔΔCt) < 1. A more intuitive expression can be obtained when changes are expressed as log 2(–ΔΔCt) (Fig. 1): positive values indictate a higher expression in BPH mice, whereas negative values indicate a lower expression compared to BPN mice.
Figure 1. mRNA profile of TRPC channels in BPN and BPH VSMCs.
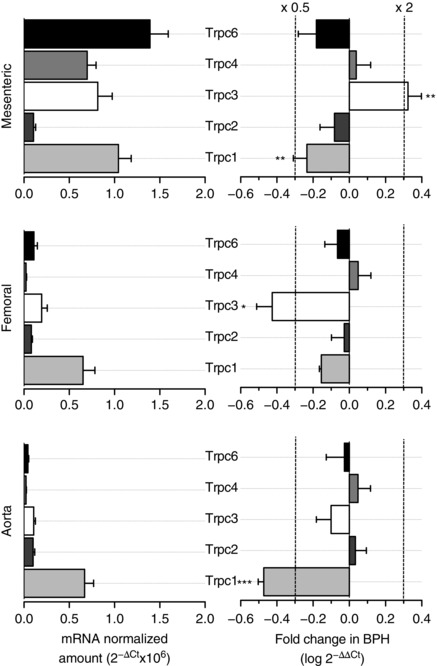
Left: relative abundance of TRPC family channels in VSMC from BPN mesenteric, femoral and aorta arteries normalized by the amount of RP18S. Data are expressed as 2−ΔCt, where ΔCt = Ctchannel – Ct18S. Right: showing, for each vascular bed, the changes in TRPC channels expression in BPH arteries using BPN arteries as the calibrator. Differences are expressed as log (2−ΔΔCt) where ΔΔCt = ΔCtBPH – ΔCtBPN. With the log scale, a value of 0 represents no change, increases in expression are depicted as positive changes, and decreased expression appears as a negative value. For reference, the values of a two‐fold increase or a two‐fold decrease are indicated by the dotted lines. Each bar is the mean ± SEM, n = 6–10 values from at least three independent experiments. All through the figures * P < 0.05; ** P < 0.01; *** P < 0.001.
Myography measurements
Segments of third‐order mesenteric arteries were mounted in a pressure myograph system (Danish Myo Technology, Aarhus, Denmark). The arteries were cannulated between two borosilicate glass pipettes and fixed with nylon filaments at both ends. Then, the artery segment was air bubbled to remove endothelial tissue and filled with physiological saline solution (120 mm NaCl, 2.5 mm CaCl2, 1.17 mm MgSO4, 5 mm KCl, 1.18 mm Na2HPO4, 25 mm NaHCO3, 1 mm EDTA, 10 mm glucose, pH 7.4 adjusted with 5% CO2–95% air), which was maintained throughout the duration of the experiment. The arteries were pressurized to 70 mmHg in physiological saline solution and incubated at 37 °C for at least 20 min to equilibrate before starting the measurements. The viability of mesenteric arteries was evaluated by their ability to constrict in response to phenylephrine, and the endothelium denudation was confirmed in control experiments by the absence of dilatation in response to 10 μm ACh. Data regarding the external diameter were collected with a CCD camera placed in an inverted microscope (Danish Myo Technology) and were analysed using MyoView software (Danish Myo Technology). The vasodilatory effect of the Pyr compounds was tested in phenylephrine (5–10 μm) precontracted arteries. At the end of each experiment, vessels were superfused with a solution containing 10 μm nifedipine to determine the maximal vessel diameter upon relaxation. Dose–response curves of chemical agents were calculated with the formula 100 × (D – D Phe)/(D Nif – D Phe) and fitted by either one or two Hill functions.
VSMC isolation
Fresh VSMC cells were obtained after two sequential enzymatic incubations at 37 °C of second‐ and third‐order mesenteric arteries in accordance with previously described methods (Moreno‐Domínguez et al. 2009; Tajada et al. 2012). The first digestion was carried out in SMDS‐Ca2+‐free solution containing 0.8 mg ml−1 papain (Worthington Biochemical Corp., Lakewood, NJ, USA), 1 mg ml−1 BSA (Sigma‐Aldrich, St Louis, MO, USA) and 1 mg ml−1 dithiothreitol (Sigma‐Aldrich) and the second one was performed in SMDS‐10 μm Ca2+ supplemented with 0.6 mg ml−1 collagenase F (Sigma‐Aldrich) and 1 mg ml−1 BSA. Subsequently, the tissues were washed three or four times in SMDS‐10 μm Ca2+ and were mechanically dissociated with a wide‐bore glass pipette to obtain freshly isolated VSMC cells. Single cells were maintained at 4 °C until patch clamp recordings or protein expression assays.
Protein expression assays
Protein expression in VSMC and CHO cells was studied by immunocytochemistry and immunoprecipitation assays, as well as by a proximity ligation assay (PLA). For the immunocytochemistry assay, transfected CHO cells plated on poly‐lysine coated coverslips were fixed with 4 % paraformaldehyde in PBS for 15 min, permeabilized in PBTx (PBS, 0.1% Triton X‐100) and blocked with PBTx with 1% of BSA for 10 min. Then, cells were incubated first with the primary antibody: rabbit anti‐TRPC3 (4.5 μg ml−1; ACC‐016; Alomone Labs, Jerusalem, Israel) or rabbit anti‐TRPC6 (4.5 μg ml−1; ACC‐017; Alomone) and then with the secondary antibody: Alexa 594 goat anti‐rabbit (dilution 1:1000; Molecular Probes, Carlsbad, CA, USA), both in blocking solution. The nuclei were labelled with Hoechst 33342 (dilution 1:2000; Life Technologies, Grand Island, NY, USA) and coverslips were mounted with Vectashield (Vector Laboratories, Inc., Burlingame, CA, USA).
For the immunoprecipitation assay, cell lysate from transfected CHO cells was collected in modified radioimmunoprecipitation assay buffer (MRB) (150 mm NaCl, 50 mm Tris, pH 8, 1% NP‐40 and 0.2% sodium deoxycholate, pH 7.4 adjusted with NaOH) with Proteases Inhibitor Cocktail (Roche, Basel, Switzerland). Then, the cell lysate was incubated at 4 °C with gentle shaking for 2–3 h with the GFP‐Trap_A beads in accordance with the manufacturer´s instructions (Chromotek, Planegg‐Martinsried, Germany) and, after washing three times with MRB buffer and with high NaCl‐MRB buffer (750 mm), samples were maintained at −20 °C until analysis by western blotting. For immunoblot analysis, protein samples were diluted in XT Reducing Agent and XT Sample Buffer (Bio‐Rad, Hercules, CA, USA) and incubated at 95 °C for 5 min. They were then separated by SDS‐PAGE on 10% polyacrylamide gels and transferred onto nitrocellulose membrane, which was then blocked with 5 % non‐fat dry milk in 0.1 % Tween 20 in Tris‐buffered saline for 1 h. Membranes were incubated with the primary antibodies in blocking solution: rabbit anti‐TRPC3 (4.5 μg ml−1; Alomone) or rabbit anti‐TRPC6 (4.5 μg ml−1; Alomone), at 4 °C overnight. Next, membranes were incubated with the secondary antibody: horseradish peroxidase‐conjugated anti‐rabbit IgG (dilution 1:20000; Dako, Glostrup, Denmark) for 1 h. Protein signals were detected using a VersaDoc 4000 Image System (Bio‐Rad) with chemiluminescence reagents (SuperSignal West Femto Maximum Sensitivity Substrate; Pierce, Rockford, IL, USA).
Protein association in native VSMC cells was explored with PLA technology using the Duolink® In Situ kit (Sigma‐Aldrich) in accordance with the manufacturer´s instructions. Briefly, freshly isolated native cells were incubated in 12 mm diameter dishes at 37 °C in a 5% CO2 humidified atmosphere for 1 h prior to be fixed with 4 % paraformaldehyde in PBS. After washing, cells were permeabilized with 0.2% Triton x‐100 in PBS and blocked with the kit´s blocking solution at 37 °C for 1 h. Then, cells were incubated with different combinations of first intracellular antibodies: rabbit anti‐TRPC3 (1 μg ml−1; Alomone), goat anti‐TRPC3 (1 μg ml−1; NBP1‐70352; Novus Biologicals, Littleton, CO, USA), rabbit anti‐TRPC6 (1 μg ml−1; Alomone) and goat‐anti‐TRPC6 (1 μg ml−1; NBP1‐00142; Novus Biologicals) at room temperature overnight. Cells were then labelled with Doulink® In Situ PLA probes: anti‐goat PLUS and anti‐rabbit MINUS for 1 h at 37 °C and, subsequently, ligation and amplification reactions were carried out in accordance with the manufacturer ´s instructions. Samples were mounted with Vectashield with DAPI to stain the nuclei and maintained at 4°C until visualization at the appropriate wavelengths using an SP5 confocal microscope (Leica Microsystems, Wetzlar, Germany). Control experiments employed only one primary antibody.
Electrophysiological recordings
Electrophysiological measurements were carried out at room temperature (20–25°C) using a whole‐cell configuration of the patch clamp technique. CHO transfected cells were perfused with a bath solution (Standarde solution) containing (in mm) 141 NaCl, 1.8 CaCl2, 1.2 MgCl2, 4.7 KCl, 10 glucose an d10 Hepes, pH 7.4 (NaOH). For recordings of freshly isolated VSMCs, we used a TRP external solution containing (in mm) 141 NaCl, 1.8 CaCl2, 1.2 MgCl2, 5 CsCl, 10 glucose, 10 Hepes, 0.005 nicardipine, 0.1 DIDS and 0.1 niflumic acid (pH 7.4 with NaOH). Borosilicate glass patch pipettes of 3–10 MΩ of resistance were filled with an internal solution (TRP internal solution) containing (mm) 10 CsCl, 110 Cs aspartate, 10 NaCl, 3.2 CaCl2, 10 Hepes, 10 BAPTA, 2 MgATP, pH 7.2 (with CsOH) and with an estimated free [Ca2+] of 100 nm. When indicated, rabbit anti‐TRPC3 or TRPC6 or rat anti‐red fluorescent protein (RFP) (Chromotek) antibodies were included at a final concentration of 4 μg ml−1. Current–voltage relationships were obtained with 1 s ramp protocols from −150 mV to +80 mV from a holding potential of −10 mV, under control conditions or in the presence of the different activators or blockers. A 70% Standarde solution was applied as hypotonic stimulus (HS). For the experiments with intracellularly applied antibodies, the access resistance (Ra) and the membrane capacitance (Cap) were continuously monitored and recorded by applying the membrane test algorithms of Clampex 10 software (Axon Instruments, Foster City, CA, USA) throughout the experiment. Only cells with GΩ seal values and stable Ra and Cap values were considered for analysis. Data were acquired using an Axopatch 200A patch clamp amplifier (Axon Instruments), at a frequency of 5 kHz and filtered at 2 kHz. Recordings were digitized with a Digidata 1200 interface using Clampex 10 software. Electrophysiological data analyses were carried out using Clampfit 10 software (Molecular Devices, Sunnyvale, CA, USA) and with Origin 7 software (OriginLab Corporation, Northampton, MA, USA).
Statistical analysis
Statistical analyses were performed with R software (R Foundation for Statistical Computing, Vienna, Austria). Pooled data are expressed as the mean ± SEM. For the electrophysiology, myography and PLA, statistical comparisons between groups of data were carried out using a two‐tailed Student's t test for unpaired data. P < 0.05 was considered statistically different.
In the case of the quantitative PCR data, a Student's t test for independent samples was used in the case of normal distributions (i.e. a Saphyro‐Wilks test with P > 0.05). If this was not the case, a pairwise Mann–Whitney–Wilcoxon test (i.e. a non‐parametric test) was applied to determine whether the differences between groups of data were statistically significant.
Results
We analysed the expression profile of TRPC channels in mesenteric, femoral and aorta VSMCs from BPN and BPH mice. The genes explored included all members of the TRPC family, as well as several control genes, such as calponin as a control for VSMCs, endothelial nitric oxide synthase as a control for endothelial cell contamination and ribosomal protein 18S (RP18S) as an endogenous control for the quantitative PCR. We explored both the relative abundance of the channel genes expressed in the normotensive VSMCs and the changes observed in BPH animals. The data are summarized in Fig. 1. We found mRNA expression of all TRPC channels but TRPC5 and TRPC7 (Fig. 1, left). Changes in expression upon hypertension (Fig. 1, right) are expressed as log2(–ΔΔCt) so that positive values represent increased levels of expression compared with BPN, whereas negative values represent decreased expression (see Methods). In all cases, TRPC mRNA channel expression was higher in resistance (mesenteric) than in conduit (femoral or aorta) arteries, and significant differences in TRPC1 and TRPC3 expression were found in hypertensive mice. Expression of TRPC1 was decreased in mesenteric and aorta from BPH, whereas TRPC3 levels were higher in mesenteric and smaller in femoral.
Because TRPC expression was higher in resistance arteries, which functionally contribute more to blood pressure, and the increased TRPC3 expression was unique to mesenteric VSMCs from hypertensive mice, we decided to investigate the possible contribution of TRPC3 channels to the hypertensive phenotype using several pyrazole compounds (i.e. Pyr3, Pyr6 and Pyr10). Although Pyr3 and Pyr10 have been proposed as selective blockers of the DAG‐activated TRPC channels, and particularly TRPC3, Pyr6 appears to exhibit a greater potency as inhibitor of Orai‐mediated Ca2+ entry (Schleifer et al. 2012).
First, we tested the effect of these compounds on vessel tone performing pressure myography experiments in endothelium‐denuded mesenteric arteries from BPN and BPH mice (Fig. 2). Pressurized arteries were pre‐contracted with phenylephrine, and the application of 10 μm nifedipine (an LTCC blocker) at the end of each experiment was used to determine the maximum diameter. Bath application of Pyr3 elicited a dose‐dependent vasodilator response in mesenteric arteries (Fig. 2 A) and smaller concentrations were needed to see a response in BPN. The same differences were observed with Pyr10. The whole dose–response curves are depicted in Fig. 2 B. In both cases, BPN arteries have an apparent high‐affinity component, which is responsible for ∼30% of the total response that was not present in BPH vessels. By contrast, the vasodilator effect of Pyr6 was less potent and there were no differences between BPN and BPH arteries (Fig. 2 B). These data indicate that both Pyr3 and Pyr10 at concentrations ≤10 μm have a larger vasodilator effect in BPN arteries. It is reasonable to speculate that the high‐affinity component represents the literature described specific blockage of TRPC3 channels, whereas the low affinity component, which is responsible for the full vasodilatation, is a result of some unspecific blockage. Therefore, these results would suggest that TRPC3 channels have a larger functional role in BPN arteries.
Figure 2. Effects of Pyr compounds on the vascular tone in BPN and BPH mesenteric arteries.
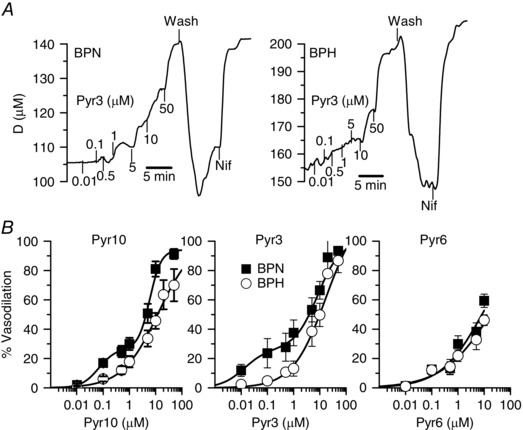
A, representative examples of the effect of Pyr3 application at the indicated concentrations (in μm) on the external diameter of a BPN (left) and a BPH artery (right). In both cases, the arteries were pressurized to 70 mmHg and pre‐contracted with bath application of 5 μm phenylephrine (Phe). Increased concentrations of Pyr3 were applied in the continuous presence of Phe. At the end of the experiment 10 μm nifedipine (Nif) was applied to determine the maximal diameter. B, dose–response effect of Pyr10, Pyr3 and Pyr6 in BPN (filled squares) and BPH (open circles) arteries. Data are normalized to the maximal diameter values obtained in the presence of nifedipine and expressed as percentage of relaxation (mean ± SEM; 5–9 arteries in each group). Data are fitted to Hill functions with apparent K d values between 6 and 20 μm. For Pyr3 and Pyr10, the fitting of BPN data includes an additional high‐affinity component representing 25% of the response and with apparent K d values of 10 and 60 nm, respectively.
The effects of TRPC3 blockers were clearly not anticipated by the mRNA expression studies depicted in Fig. 1. Several hypotheses, including the absence of correlation between mRNA and protein changes, or differences in the blocking effect of Pyr3/10 compounds depending on the subunit composition of the TRPC tetramers, could explain this discrepancy. We decided to explore this possibility by characterizing the effect of Pyr10 on the non‐selective cationic currents recorded in CHO cells expressing TRPC3, TRPC6 or TRPC3/6 channels. Currents of variable amplitude could be elicited in all experimental groups, as well as in mock‐transfected CHO cells, in response to depolarizing ramps from −150 to +80 mV. Figure 3 A shows the average current density obtained at −150 and +80 mV in all the experimental groups, together with representative examples of the currents obtained in TRPC3‐, TRPC6‐ and TRPC3/6‐transfected cells before and during the application of 10 μm Pyr10. The subtracted, Pyr10‐sensitive currents are also shown. TRPC3‐transfected cells had bigger currents than TRPC6‐, and TRPC3/TRPC6‐transfected cells showed an intermediate behaviour. Regarding the effect of Pyr10, the data showed that only currents from CHO cells expressing TRPC6 channels (alone or together with TRPC3) were sensitive to Pyr10. Average current densities at +80 and −150 mV, under control conditions or in the presence of Pyr10 (10 μm), are shown in Fig. 3 B.
Figure 3. Functional contribution of TRPC3 and TRPC6 channels to basal and stretch‐activated, non‐selective cationic currents in CHO cells.
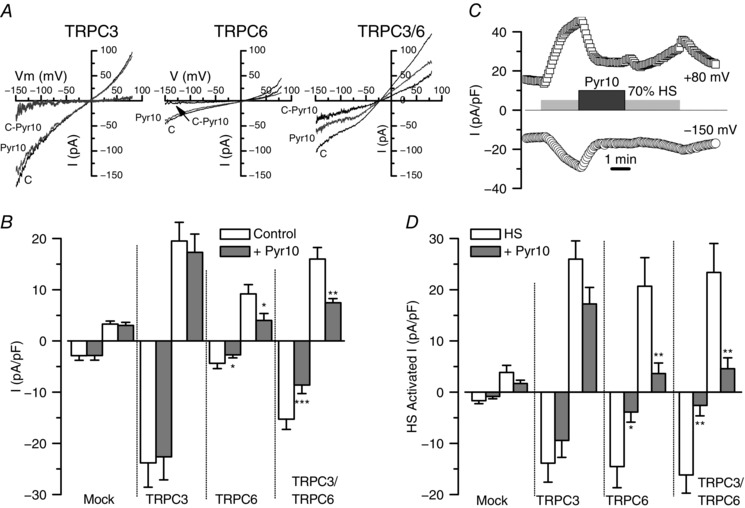
A, representative examples of the traces recorded in the whole‐cell configuration from unstimulated CHO cells transfected with TRPC3, TRPC6 and TRPC3/6 channels using ramp protocols from −150 mV to +80 mV. The effect of the application of Pyr10 (10 μm) in each case and the subtracted (C‐Pyr), Pyr‐10 sensitive current are also represented in the plots. B, lower bars plot shows average current densities (pA/pF) measured at −150 mV and +80 mV for each condition, as well as for untransfected CHO cells. Data are the mean ± SEM of seven to 23 cells in each condition. C, example of the experimental protocol used to explore the effect of Pyr10 on stretch‐activated currents in a CHO cell transfected with TRPC3/6. The plot shows the time course of the current density recorded at −150 mV and +80 mV together with the time of application of the different stimuli. D, summary of Pyr10 effects on stretch‐activated currents under all of the conditions explored. Bar plot shows average current densities elicited by application of a hypotonic solution (HS, 70% Standarde solution) and the inhibitory effect of Pyr10 (10 μm). Data are the mean ± SEM; 13–22 cells in each group.
Because TRPC3 and TRPC6 mediated currents can be activated by several GPCR as well as by pressure‐induced membrane stretch (Gonzales et al. 2014; Wilson & Dryer, 2014), we aimed to test the effect of Pyr10 on currents activated by some of these stimuli. To simulate a membrane stretch, we used a hypotonic stimulus (70% Standarde solution, HS) to activate the channels in CHO transfected cells. A typical experiment is depicted in Fig. 3 C and the summary data obtained are shown in Fig. 3 D. Application of HS elicited a reversible increase in the TRPC‐mediated currents that was similar in the three conditions studied (TRPC3‐, TRPC6‐ and TRPC3/6‐transfected cells) and significantly much larger than that in mock‐transfected CHO cells. These HS‐induced currents, as found with basal currents, could be significantly inhibited by 10 μm Pyr10 only when TRPC6 channels were expressed.
These data suggest that Pyr10 blocks TRPC6 channels, and not TRPC3 (as reported previously), either as homo‐ or heteromultimers with other TRPC channels. The presence of heteromultimers between TRPC3 and TRPC6 channels in TRPC3/6‐transfected cells was tested by co‐immunoprecipitation experiments. Figure 4 A shows immunocytochemical staining of TRPC3‐ and TRPC6‐ transfected cells with specific antibodies against TRPC3 and TRPC6 channels. The specificity of both antibodies, as well as the proper trafficking of the expressed proteins, is evident. Figure 4 B shows a typical co‐immunoprecipitation experiment, where TRPC6 or TRPC3 immunolabelling could be detected after immunoprecipitation of TRPC3/6‐transfected cells using GFP‐Trap beads to bind TRPC3‐YFP fusion protein. Altogether, these sets of experiments indicate that Pyr10‐sensitivity could be used as a tool to test the functional contribution of either TRPC6 or TRPC6 heteromultimers to ROC in native cells.
Figure 4. Use of antibodies to determine functional contribution, location and association of TRPC3 and TRPC6 channels in CHO cells.
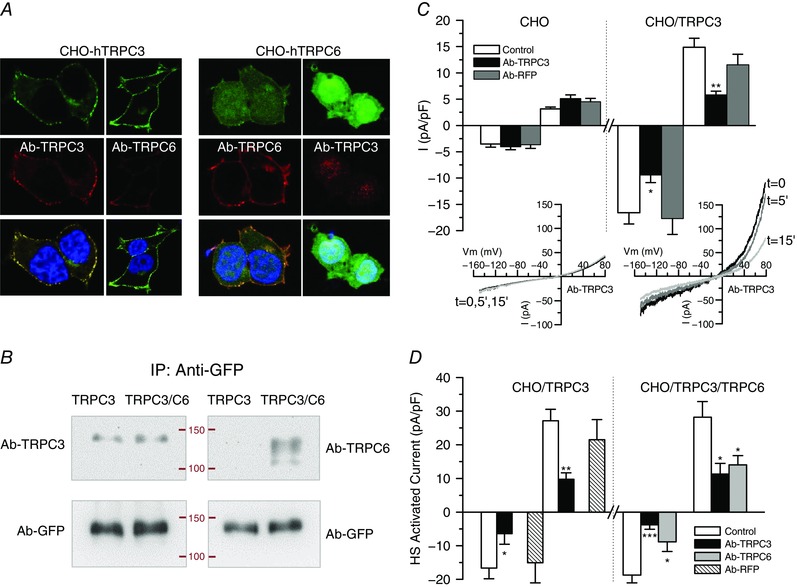
A, representative confocal images of immunolabelling with anti‐TRPC3 and anti‐TRPC6 of CHO cells transfected with TRPC3 (left) or TRPC6 (right). Immunostaining was predominant at the cell membrane and shows a good correlation with GFP‐labelling for TRPC3 (a fusion protein). No cross‐reactivity was observed in either case. B, TRPC3‐GFP or TRPC3‐GFP/TRPC6 cotransfected cells were immunoprecipitated with anti‐GFP‐trap and immunoblotted with GFP antibody (as a load control) or with anti‐TRPC3 or anti‐TRPC6 antibody. Labelling with anti‐TRPC6 was detected on the cotransfected cells, demonstrating heteromultimeric association. Data are representative of two independent experiments. C, blocking effect of intracellularly applied antibodies on the cationic currents observed in transfected CHO cells. Average basal current density at −150 mV (open bars) and +80 mV (dashed bars) was obtained from whole‐cell ramps applied every 5 s to control untransfected CHO cells and to cells transfected with TRPC3. The plots show the current density after 5–10 min of recording in control pipette solution or in the presence of the indicated antibodies. Each bar is the mean ± SEM of nine to 14 cells from at least four different experiments. The inset shows the current traces obtained at the indicated times in an untransfected CHO cell (left) or in a TRPC3‐transfected CHO cell (right) with anti‐TRPC3 antibody in the pipette solution. * p < 0.05; ** p < 0.01 compared to CHO/TRPC3 control cells. D, the same protocol was used to explore the blocking effect of anti‐TRPC3 or anti‐TRPC6 on stretch‐activated currents elicited from TRPC3 and TRPC3/C6 transfected cells upon exposure to the hypotonic solution (HS). The effects were calculated by subtracting basal, unstimulated currents and after 5–10 min of recording in control conditions or in the presence of the indicated antibodies. Data are the mean ± SEM, n = 8–10 cells.
Because we lack a pharmacological tool to determine the presence and contribution of TRPC3 channels, we aimed to explore the blocking effect of intracellularly applied antibodies (Fig. 4 C). Control experiments were carried out in non‐transfected CHO cells using anti‐TRPC3 or an indifferent antibody (against RFP; anti‐RFP). No changes in the current amplitude could be observed in any case up to 10 min when recording on the whole‐cell configuration of the patch clamp technique. Current amplitude of recordings from TRPC3‐transfected cells was also stable up to 10 min when no antibody or anti‐RFP antibody was added in the pipette solution, although a significant reduction was observed when dialysing the cell with anti‐TRPC3. We confirmed that this blocking effect of anti‐TRPC3 (or anti‐TRPC6) was specific by exploring the antibodies effects on the HS‐activated current (Fig. 4 D). In TRPC3/C6‐transfected cells, both antibodies led to a significant reduction of the current density, whereas only anti‐TRPC3 (but not anti‐RFP) inhibited HS activated currents in TRPC3‐transfected cells.
All of the results presented so far provide support for the hypotheses that differences in Pyr10 sensitivity of BPN and BPH arteries could be a result of changes in the composition of the TRPC heteromultimers. Therefore, we aimed to obtain some insights on the subunit composition of the native TRPC channels in BPN and BPH VSMCs. We used the PLA assay technique to identify close associations between two TRPC3 subunits, two TRPC6 or one TRPC3 and one TRPC6 subunits. Figure 5A shows representative images obtained with this technique for each of the three combinations explored and in the two different cells studied (BPN and BPH VSMCs). Labelling with two different TRPC3 antibodies (C3‐C3 combination), or dual labelling for TRPC3 and TRPC6 (C3‐C6), produced significantly higher numbers of puncta per cell and total labelled area in BPH than in BPN cells. By contrast, labelling with two TRPC6 antibodies was significantly smaller in BPH cells. Average values of all the described combinations are depicted in the bar graph on the right of Fig. 5 A. The possible associations detected for each combination (considering just one tetramer) are depicted in the scheme of Fig. 5 B. The charts shown on the right group the data corresponding to the C3‐C3 or C6‐C6 combinations, representing the percentage of heteromultimers with more than a TRPC3 or TRPC6 subunit, respectively. Although more complex interpretations are possible, these data suggest that, in the hypertensive phenotype, there is a change in the composition of the TRPC3/6 tetramers, with a greater contribution of TRPC3 channels in the BPH cells.
Figure 5. Differences in TRPC assembly in BPN and BPH mesenteric VSMCs.
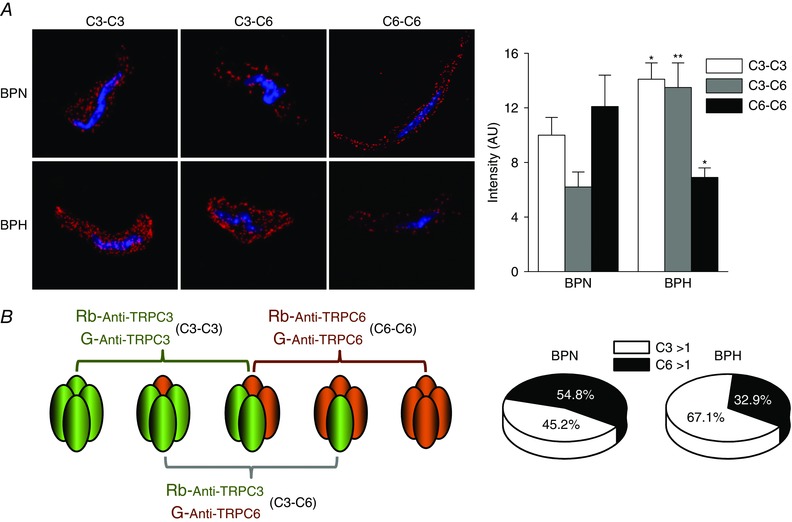
A, representative confocal images of the puncta density distribution using the PLA assay in BPN (upper) and BPH (lower) native VSMC cells. The bars plot shows the averaged density of puncta obtained in the three conditions represented in (A) for BPN and BPH cells. Data are the mean ± SEM; 36–64 cells in each group from four independent experiments. * p < 0.05, ** p < 0.01 compared to the same condition in BPN. B, scheme of the possible associations between C3‐C3, C6‐C6 and/or C3‐C6 subunits that can be recognized with each combination of antibodies used for the PLA assay. Following this scheme, the chart illustrates an interpretation of the data, considering 100% as the sum of the intensity of C3‐C3 and C6‐C6 groups and assuming that the C3‐C6 group will be included in both. Accordingly, the C3‐C3 group will contain associations with more than one C3 subunit (C3 > 1) and C6‐C6 those with more than one C6 subunit (C6 > 1).
We explored the functional correlate of these differences by analysing basal and receptor‐activated cationic currents in freshly isolated VSMCs from BPN and BPH mice. Current amplitude at −150 mV was significantly larger in BPH cells (Fig. 6 B). This difference remains when expressed it as current density (−8.1 ± 0.5 pA/pF in BPH vs. −6.4 ± 0.7 pA/pF in BPN) despite the larger size of BPH cells (16.9 ± 0.6 pF in BPH vs. 13.9 ± 0.5 pF in BPN) (Moreno‐Domínguez et al. 2009). In addition to differences in current size, there also were differences in Pyr10 and Pyr3 sensitivity, with the BPH cells being less sensitive to the drugs (Fig. 6 A and B). These data suggest a decreased contribution of TRPC6 channels to the non‐selective cationic conductance of BPH mesenteric VSMCs. Both results (i.e. the larger currents and the decrease of TRPC6 contribution) are compatible with a larger expression of TRPC3 channels in BPH cells. To confirm this, we explored the effect of intracellularly applied anti‐TRPC3 antibodies on BPN and BPH cationic currents (Fig. 6 C). Examples are shown of the time course of the current amplitudes at +80 and −150 mV in BPH cells in the presence of anti‐RFP antibody (control; Fig. 6 C, left) or anti‐TRPC3 antibody in the pipette solution (Fig. 6 C, right), up to 10–12 min of recording. We monitored the stability of the recording conditions by checking cell capacitance and access resistance (data not shown) and holding current at −10 mV. The initial current amplitude was reduced by 25% after 5 min and by 39% after 10 min of recording when anti‐TRPC3 was intracellularly applied, whereas no significant changes could be observed in control cells, either with an anti‐RFP antibody or in the absence of antibodies. Average data obtained in VSMCs from BPN and BPH mice are depicted in Fig. 6 D. The effect of anti‐TRPC3 antibodies was only significant in BPH cells, again suggesting a greater contribution of TRPC3‐containing channels to cationic currents in BPH VSMCs.
Figure 6. Characterization of basal cationic currents in BPH and BPN mesenteric VSMCs and effects of anti‐TRPC3 antibody.
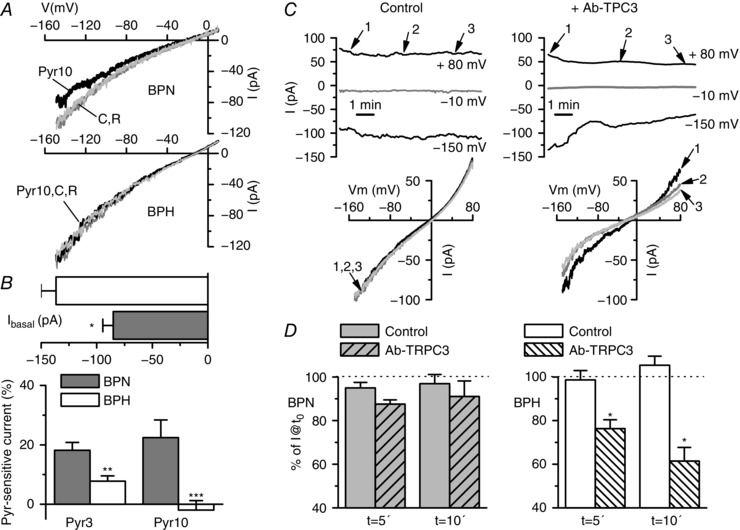
A, basal cationic currents were obtained by voltage ramps in the presence of TRP external solution. The figure shows representative examples of current–voltage traces obtained in a BPN and a BPH mesenteric VSMC in control conditions (C), in the presence of 10 μm Pyr10 and after washout of the blocker (R). B, upper bar plot showing the current amplitude at −150 mV for both BPN and BPH cells (mean ± SEM, 40–60 cells in each group). The lower plot shows the average fraction of the Pyr3‐ or Pyr10‐sensitive current at −150 mV in BPN (grey bars) or BPH cells (white bars). Each bar is the mean ± SEM of 10 cells (for Pyr3) and 23 cells (for Pyr10). C, representative examples of the time course of the currents elicited by voltage ramps in a BPH cell recorded with anti‐RFP (left) or with anti‐TRPC3 antibody (4 μg ml−1) in the pipette solution (right). The plots show the current amplitude at −150 mV, +80 mV and at the holding potential (−10 mV, grey line). The time course of the cell capacitance and the access resistance were obtained simultaneously (not shown). Examples of the actual traces obtained with the ramp protocol at the time points of 0, 5 and 10 min (points 1, 2 and 3 in the graphs) are also depicted (bottom). D, average current amplitude at 5 and 10 min is represented as a fraction of the initial current amplitude both in control cells (solid bars) and in anti‐TRPC3 treated cells (striped bars), for BPH (left plot) and BPN mesenteric VSMCs (right plot). Each bar is the mean ± SEM of seven to 14 cells in each group. For the control group, untreated cells and cells with anti‐RFP antibody in the pipette solution were pooled together.
Finally, we also explored the amplitude of native currents in BPN and BPH VSMCs activated by several well defined agonists such as ATP (30 μm), UTP (50 μm) and phenylephrine (Phe 10 μm), as well as the DAG‐permeable analogue OAG (100 μm) and also the blocking effects of Pry3 and/or Pyr10 (10 μm). Figure 7 A shows the summary data. With the exception of UTP responses, which were significantly smaller in BPH VSMCs, the amplitude of the cationic currents elicited by all the other stimuli was not different between BPN and BPH cells. However, both preparations showed a remarkable difference when comparing the blocking effect of Pyr3/Pyr10 compounds. Although, in BPN cells, these drugs fully abolished the current activated by all the agonist studied, there is a fraction of this current that is not sensitive to Pyr3 (black bars) and/or Pyr10 (grey bars) in BPH cells. For example, in the case of ATP stimulation, although Pyr3/10 block almost completely the ATP‐activated current in BPN VSMCs, the Pyr3/10‐sensitive current represents only ∼60% of this current in BPH VSMCs (Fig. 7 A, right). Representative examples of the time course of the current amplitude at −100 mV and +40 mV in response to ATP alone or in combination with Pyr3 are shown in Fig. 7 B (for a BPN cell) and Fig. 7 C (a BPH cell).
Figure 7. Effect of Pyr blockers on agonist‐activated cationic currents in native VSMCs.
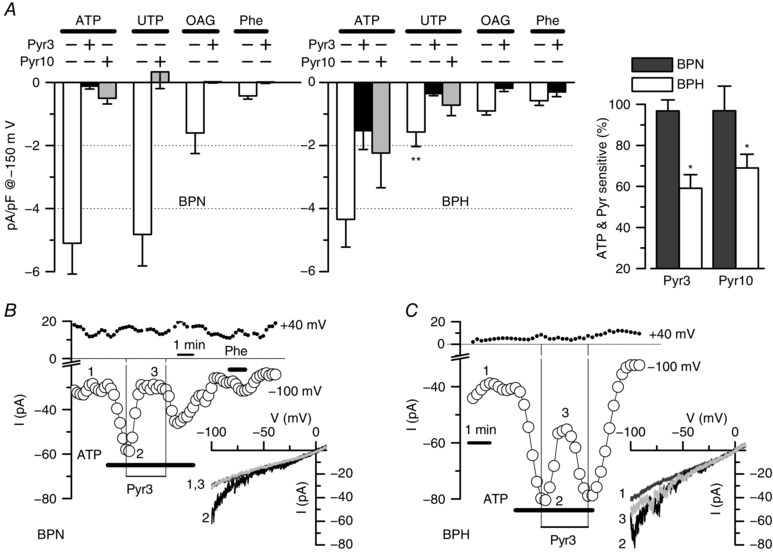
A, summary data showing the current density at −150 mV of the current activated in the presence of ATP (30 μm), UTP (50 μm), OAG (100 μm) and phenylephrine (Phe, 30 μm) alone or in the presence of Pyr3 (10 μm) or Pyr 10 (10 μm) as indicated. Data were obtained from voltage ramps after subtracting basal, unstimulated currents. Data were obtained from BPN and BPH isolated mesenteric VSMCs. Blockers were applied in the presence of the agonists, and their effects were calculated after subtracting basal current as well. Agonist‐induced currents are the average from 17–36 cells in each group, whereas the effect of the blockers was tested in 6–14 cells in each group. ** p < 0.01 compared with UTP‐activated currents in BPN cells. The inset shows the fraction of the ATP‐activated current that can be blocked by Pyr3 or Pyr10 in BPN (black bars) and BPH cells (white bars). * p < 0.05 compared to UTP effect in BPN. B and C, representative examples of a BPN and a BPH cells that were stimulated with 30 μm ATP alone or with 10 μm Pyr3 as indicated in the graphs. The time course of the current amplitude at −100 mV (open circles) and +40 mV (filled circles) was obtained from voltage ramps applied every 5 s. Traces in control conditions (1) in the presence of ATP (2) or of ATP + Pyr3 (3) are shown in the inset. BPN cell was also challenged with 30 μm Phe as indicated.
Discussion
In the present study, we have explored the hypothesis that TRPC3 and TRPC6 channels expressed in VSMCs may have a differential contribution to the regulation of vascular tone, which could be relevant for the changes in vascular reactivity associated with essential hypertension. This possibility was supported by the initial observation indicating a higher mRNA expression of those channels in resistance arteries (mesenteric vs. femoral or aorta). Furthermore, the changes in the mRNA expression levels of these channels when comparing VSMCs from BPN and BPH vessels are clearly different in resistance and conduit arteries (Fig. 1). Although the importance of either TRPC6 or TRPC3 channels in the vascular system has been demonstrated clearly over recent years (Earley & Brayden, 2015), the novelty of the present study relies on exploring the hypothesis that changes in these two channels upon hypertension determine a different composition of homo‐ and heterotetramers with discernible biophysical, pharmacological and functional properties.
Combining several methodological approaches and using both heterologously expressed channels and native cells, we conclude that TRPC3 and TRPC6 in BPH and BPN VSMCs show a different pattern of association (Fig. 8). VSMCs from BPH cells have a larger fraction of TRPC3‐containing homo‐ and heterotetrameric channels with an increased basal activity, which can contribute to the more depolarized resting membrane potential observed in BPH VSMCs and to the increased vascular reactivity of BPH mesenteric arteries (Moreno‐Domínguez et al. 2009). The larger basal cationic currents at negative potentials observed in BPH VSMCs were more sensitive to blockade with intracellularly applied anti‐TRPC3 antibodies. The selectivity of this immunological blockade was confirmed in the heterologous system. In addition, BPH basal currents were less sensitive to Pyr10, which, in our hands, behaved as a selective blocker of TRPC6‐containing channels.
Figure 8. Diagram of the proposed changes in TRPC3/C6 composition upon hypertension.
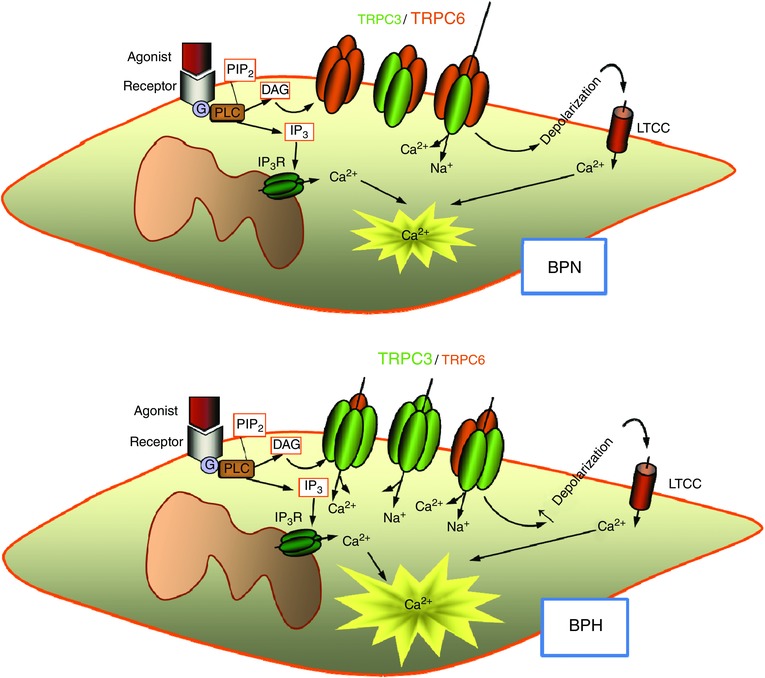
Homo‐ and heteromultimeric TRPC3/C6 channels contribute to basal cationic currents in VSMCs, thus modulating resting membrane potential and hence basal [Ca2+] concentration and cell excitability. BPN cells may have a dominant expression of TRPC6 channels, associated with either homo‐ or heterotetramers, which show strong inward rectification. This will result in low basal currents at values around the resting membrane potential. In BPH cells, the increased expression of TRPC3 channels determines a change in the properties of heteromultimers, which will have now a larger proportion of TRPC3 subunits. TRPC3 channels show weak rectification, which will determine an increased basal current at negative potential contributing to cell depolarization, raising the [Ca2+] concentration and increasing basal tone.
In this regard, our work redefines the meaning of the pharmacological tools available for the study of TRPC3/6 channels. We found that the novel pyrazole compounds recently described as selective blockers of TRPC3 (mainly Pyr10 and also Pyr3) showed an increased selectivity for TRPC6‐containing channels over TRPC3 homotetramers, in contrast to what has been described previously (Kiyonaka et al. 2009; Schleifer et al. 2012). Although the reported effect of these compounds on native TRPC3 channels (Kiyonaka et al. 2009; Koenig et al. 2013) could be compatible with the presence of TRPC3/6 heterotetramers, we do not have a clear explanation for the disparities observed in the recombinant system, although several differences in the preparation and the methodology of the study can be highlighted. We have performed our characterization using TRPC3 overexpression in CHO cells and we have determined both basal and stretch‐activated currents using electrophysiological techniques. By contrast, previous studies used TRPC3‐transfected HEK293 (and/or HEK293T) cells and channel activity was measured by determining Ca2+ entry upon stimulation of endogenous muscarinic receptors with carbachol (Kiyonaka et al. 2009; Schleifer et al. 2012). It is possible that changes in the associated proteins endogenously expressed in the different cell lines used and/or changes in the response to blockers related to the specific activation pathway could contribute to the observed discrepancies. Moreover, and possibly more importantly, although we had analysed the acute effects of Pyr compounds that were applied to the external solution in the presence of the stimulus (for stretch‐ or agonist‐activated currents), in these other studies, the effects of Pyr3 on TRPC3‐activated currents or TRPC3‐dependent Ca2+ entry are determined upon chronic pre‐treatment of the cells with Pyr3, which was always applied to the external solution previous to stimulation. Finally, the more detailed characterization of TRPC3 modulation (Kiyonaka et al. 2009) was carried out with Pyr3 because the more selective Pyr10 was not available at that time.
Some or several of these aspects may contribute to these largely unexpected differences on the sensitivity Pyr compounds of TRPC3 and TRPC6. In addition, our findings with the pharmacological blockade of TRPC3/6 channels could be reproduced both in heterologous and native systems with the use of blocking antibodies (Figs 4 and 6), providing an additional level of confidence to the results of the present study. This technique represents a powerful approach for the identification of the molecular correlates of native currents in the absence of more specific blockers, and also for defining the composition of heteromultimeric channel complexes (Sanchez et al. 2002; Moreno‐Domínguez et al. 2009). We have been particularly careful with this group of experiments with intracellularly applied antibodies, both in the selection of the technically acceptable experiments and in the use of a large number of controls, including control antibodies for transfected cells and TRPC3/6 antibodies for untransfected cells.
Finally, our conclusions from the functional characterization of the TRPC‐mediated cationic currents in native cells are supported by the results obtained with PLA. These studies indicated a larger proportion of TRPC3 subunits in BPH cells and a decreased expression of TRPC6. This observation is consistent with a larger number of TRPC3 homotetramers in these cells and/or heteromultimeric TRPC3/6 complexes with a larger proportion of TRPC3 subunits. Although these results would also be consistent with the formation of clusters of multimers containing only one TRPC3 subunit, based on the functional characterization of TRPC3/6 transfected cells, this latter possibility is doubtful.
TRPC channels show a high structural homology that favours the formation of heteromultimeric complexes, and this explains why the spectrum of biophysically and functionally distinct ROC or SOC exceeds what can be obtained with a single TRPC channel heterologously expressed. Because the composition of native TRPC complexes is poorly defined, the task of assigning a well‐defined molecular correlate to receptor‐activated cationic currents has proven difficult. Considering that many TRPC are often co‐expressed in the same cell (Hofmann et al. 2002), heteromultimerization in addition to homomultimerization represents an attractive possibility. The presence of heteromultimeric TRPC6/C7 channels in vascular smooth muscle has been demonstrated using both biochemical and functional approaches (Maruyama et al. 2006). Interestingly, heteromultimeric TRPC6/C7 channels exhibit one property (modulation of current amplitude by changes in extracellular [Ca2+]) that is distinct from homomultimeric TRPC6 or TRPC7, suggesting that these channel complexes are endowed with emergent properties. However, the evidence of TRPC subunit heteromultimerization was obtained using cultured A7r5 cells rather than native VSMCs. A better understanding of the mechanisms determining how TRPC subunits combine to form functional ion channel complexes is an essential prerequisite to evaluate their contribution to endogenous cation currents. In many cases, the studies using KO animals could help to define the role of the individual channels but, in the particular case of TRPC3 and TRPC6, these KO studies do not provide a unifying view of their individual role or the meaning of heteromultimeric associations. With respect to the innvestigation of mechanosensors, several studies using single, double and up to quadruple TRPC KOs conclude that TRPC functions involve combined activity of multiple TRPC proteins (Sexton et al. 2016). Although interfering with one single TRPC channels does not alter behavioural responses (Quick et al. 2012), double TRPC3/C6 KOs show sensory deficits that are augmented in quadruple KO (Sexton et al. 2016). These results indicate that TRPC3/C6 channels in sensory neurons show some functional redundancy. However, TRPC6 KO mice show a vascular phenotype as a result of a compensatory upregulation of VSMCs TRPC3 channels, which are not able to functionally replace TRPC6 channels (Dietrich et al. 2005), indicating that these two channels are not freely interchangeable and that they have distinct and non‐redundant roles in the control of vascular tone. Because of this compensatory up‐regulation of TRPC3 channels in VSMCs, the TRPC6 KO mice showed increased vascular reactivity and augmented mean blood pressure, which is in agreement with our present data. Importantly, our results confirm that the changes observed in the hypertensive animal accidentally created by Dietrich et al. (2005) when suppressing TRPC6 channels may be relevant to understand the mechanisms involved in the natural history of essential hypertension.
Finally, regarding TRPC3 channels, their expression has been reported to be upregulated in VSMCs in animal models of essential hypertension, such as the spontaneously hypertensive rat and the two‐kidney, two‐clip hypertensive rats (Liu et al. 2009; Wang et al. 2016). However, the study of concomitant changes in the expression of other TRPC channels has not received a systematic attention. There is only one recent report in which the role of upregulation of TRPC3 channels and downregulation of TRPC1 channels during hypertension and their contribution to changes in contractility is explored (Noorani et al. 2011), although these two changes are studied and explained independently, with no attempt to link them to a different proportion of heteromultimeric TRPC channels. In this context, the present study provides a new paradigm for interpreting and better understanding many of the previous studies regarding the role of TRPC channels in vascular physiology and their contribution to altered vascular tone.
Additional information
Competing interests
The authors declare that they have no competing interests.
Author contributions
MTPG and JRLL designed the work. IAM, PC and MTPG performed the experiments and carried out the analysis and interpretation of the data. MTPG and JRLL wrote the manuscript and all authors revised it critically for important intellectual content. All authors approved the final version of the manuscript. All the experiments were conducted in MTPG and JRLL laboratories at the University of Valladolid.
Funding
The present study was supported by grants from the Ministerio de Economía y Competitividad (MINECO), Instituto de Salud Carlos III (RIC, RD12/0042/0006, Red Heracles) and Programa Estatal de Investigación (BFU2013‐45867‐R to JRLL and MTPG). I A‐M is supported by the Junta de Castilla y León through the Fondo Social Europeo.
Acknowledgements
We thank Esperanza Alonso for excellent technical assistance and Drs Klaus Groschner (University of Graz) and Jason Yuan (University of Arizona) for their gift of TRPC3 and TRPC6 plasmids, respectively.
References
- Adebiyi A, Thomas‐Gatewood CM, Leo MD, Kidd MW, Neeb ZP & Jaggar JH (2012). An elevation in physical coupling of type 1 inositol 1,4,5‐trisphosphate (IP3) receptors to transient receptor potential 3 (TRPC3) channels constricts mesenteric arteries in genetic hypertension. Hypertension 60, 1213–1219. [DOI] [PMC free article] [PubMed] [Google Scholar]
- Albert AP & Large WA (2006). Signal transduction pathways and gating mechanisms of native TRP‐like cation channels in vascular myocytes. J Physiol 570, 45–51. [DOI] [PMC free article] [PubMed] [Google Scholar]
- Beech DJ, Muraki K & Flemming R (2004). Non‐selective cationic channels of smooth muscle and the mammalian homologues of Drosophila TRP. J Physiol 559, 685–706. [DOI] [PMC free article] [PubMed] [Google Scholar]
- Cidad P, Moreno‐Domínguez A, Novensá L, Roqué M, Barquín L, Heras M, Pérez‐García MT & López‐López JR (2010). Characterization of ion channels involved in the proliferative response of femoral artery smooth muscle cells. Arterioscler Thromb Vasc Biol 30, 1203–1211. [DOI] [PubMed] [Google Scholar]
- Dietrich A, Chubanov V, Kalwa H, Rost BR & Gudermann T (2006). Cation channels of the transient receptor potential superfamily: their role in physiological and pathophysiological processes of smooth muscle cells. Pharmacol Ther 112, 744–760. [DOI] [PubMed] [Google Scholar]
- Dietrich A, Mederos Y, Schnitzler M, Gollasch M, Gross V, Storch U, Dubrovska G, Obst M, Yildirim E, Salanova B, Kalwa H, et al (2005). Increased vascular smooth muscle contractility in TRPC6–/– mice. Mol Cell Biol 25, 6980. [DOI] [PMC free article] [PubMed] [Google Scholar]
- Earley S & Brayden JE (2015). Transient receptor potential channels in the vasculature. Physiol Rev 95, 645–690. [DOI] [PMC free article] [PubMed] [Google Scholar]
- Gonzales AL, Yang Y, Sullivan MN, Sanders L, Dabertrand F, Hill‐Eubanks DC, Nelson MT & Earley S (2014). A PLCg1‐dependent, force‐sensitive signaling network in the myogenic constriction of cerebral arteries. Sci Signal 7, ra49. [DOI] [PMC free article] [PubMed] [Google Scholar]
- Hofmann T, Obukhov AG, Schaefer M, Harteneck C, Gudermann T & Schultz G (1999). Direct activation of human TRPC6 and TRPC3 channels by diacylglycerol. Nature 397, 259–263. [DOI] [PubMed] [Google Scholar]
- Hofmann T, Schaefer M, Schultz G & Gudermann T (2002). Subunit composition of mammalian transient receptor potential channels in living cells. Proc Natl Acad Sci USA 99, 7461–7466. [DOI] [PMC free article] [PubMed] [Google Scholar]
- Inoue R, Jensen LJ, Jian Z, Shi J, Hai L, Lurie AI, Henriksen FH, Salomonsson M, Morita H, Kawarabayashi Y, Mori M, Mori Y & Ito Y (2009). Synergistic activation of vascular TRPC6 channel by receptor and mechanical stimulation via phospholipase C/Diacylglycerol and phospholipase A2/ω‐hydroxylase/ 20‐HETE pathways. Circ Res 104, 1399–1409. [DOI] [PubMed] [Google Scholar]
- Kiyonaka S et al (2009). Selective and direct inhibition of TRPC3 channels underlies biological activities of a pyrazole compound. Proc Natl Acad Sci USA 106, 5400–5405. [DOI] [PMC free article] [PubMed] [Google Scholar]
- Koenig S, Schernthaner M, Maechler H, Kappe CO, Glasnov TN, Hoefler G, Braune M, Wittchow E & Groschner K (2013). A TRPC3 blocker, ethyl‐1‐(4‐(2,3,3‐trichloroacrylamide)phenyl)‐5‐(trifluoromethyl)‐1H‐pyrazole‐4‐carboxylate (Pyr3), prevents stent‐induced arterial remodelings. J Pharmacol Exp Ther 344, 33–40. [DOI] [PubMed] [Google Scholar]
- Linde CI, Karashima E, Raina H, Zulian A, Wier WG, Hamlyn JM, Ferrari P, Blaustein MP & Golovina VA (2012). Increased arterial smooth muscle Ca2+ signaling, vasoconstriction, and myogenic reactivity in Milan hypertensive rats. Am J Physiol Heart Circ Physiol 302, H611–H620. [DOI] [PMC free article] [PubMed] [Google Scholar]
- Liu D, Yang D, He H, Chen X, Cao T, Feng X, Ma L, Luo Z, Wang L, Yan Z, Zhu Z & Tepel M (2009). Increased transient receptor potential canonical type 3 channels in vasculature from hypertensive rats. Hypertension 53, 70–76. [DOI] [PubMed] [Google Scholar]
- Livak KJ & Schmittgen TD (2001). Analysis of relative gene expression data using real‐time quantitative PCR and the 2^(‐ΔΔCT) method. Methods 25, 402–408. [DOI] [PubMed] [Google Scholar]
- Maruyama Y, Nakanishi Y, Walsh EJ, Wilson DP, Welsh DG & Cole WC (2006). Heteromultimeric TRPC6‐TRPC7 channels contribute to arginine vasopressin‐induced cation current of A7r5 vascular smooth muscle cells. Circ Res 98, 1520–1527. [DOI] [PubMed] [Google Scholar]
- Mederos Y, Schnitzler M, Storch U, Meibers S, Nurwakagari P, Breit A, Essin K, Gollasch M & Gudermann T (2008). Gq‐coupled receptors as mechanosensors mediating myogenic vasoconstriction. EMBO J 27, 3092–3103. [DOI] [PMC free article] [PubMed] [Google Scholar]
- Moreno‐Domínguez A, Cidad P, Miguel‐Velado E, López‐López JR & Pérez‐García MT (2009). De novo expression of Kv6.3 contributes to changes in vascular smooth muscle cell excitability in a hypertensive mice strain. J Physiol 587, 625–640. [DOI] [PMC free article] [PubMed] [Google Scholar]
- Nilius B & Honoré E (2012). Sensing pressure with ion channels. Trends Neurosci 35, 477–486. [DOI] [PubMed] [Google Scholar]
- Noorani MMZ, Noel RC & Marrelli SP (2011). Upregulated TRPC3 and downregulated TRPC1 channel expression during hypertension is associated with increased vascular contractility in rat. Front Physiol JUL, 1–9. [DOI] [PMC free article] [PubMed] [Google Scholar]
- Owens GK, Kumar MS & Wamhoff BR (2004). Molecular regulation of vascular smooth muscle cell differentiation in development and disease. Physiol Rev 84, 767–801. [DOI] [PubMed] [Google Scholar]
- Quick K et al (2012). TRPC3 and TRPC6 are essential for normal mechanotransduction in subsets of sensory neurons and cochlear hair cells. Open Biol 2, 120068. [DOI] [PMC free article] [PubMed] [Google Scholar]
- Reading SA, Earley S, Waldron BJ, Welsh DG & Brayden JE (2005). TRPC3 mediates pyrimidine receptor‐induced depolarization of cerebral arteries. Am J Physiol Hear Circ Physiol 288, H2055–H2061. [DOI] [PubMed] [Google Scholar]
- Sanchez D, Lopez‐Lopez JR, Perez‐Garcia MT, Sanz‐Alfayate G, Obeso A, Ganfornina MD & Gonzalez C (2002). Molecular identification of Kva subunits that contribute to the oxygen‐sensitive K+ current of chemoreceptor cells of the rabbit carotid body. J Physiol 542, 369–382. [DOI] [PMC free article] [PubMed] [Google Scholar]
- Schlager G & Sides J (1997). Characterization of hypertensive and hypotensive inbred strains of mice. Lab Anim Sci 47, 288–292. [PubMed] [Google Scholar]
- Schleifer H, Doleschal B, Lichtenegger M, Oppenrieder R, Derler I, Frischauf I, Glasnov TN, Kappe CO, Romanin C & Groschner K (2012). Novel pyrazole compounds for pharmacological discrimination between receptor‐operated and store‐operated Ca(2+) entry pathways. Br J Pharmacol 167, 1712–1722. [DOI] [PMC free article] [PubMed] [Google Scholar]
- Senadheera S, Kim Y, Grayson TH, Toemoe S, Kochukov MY, Abramowitz J, Housley GD, Bertrand RL, Chadha PS, Bertrand PP, Murphy TV, Tare M, Birnbaumer L, Marrelli SP & Sandow SL (2012). Transient receptor potential canonical type 3 channels facilitate endothelium‐derived hyperpolarization‐mediated resistance artery vasodilator activity. Cardiovasc Res 95, 439–447. [DOI] [PMC free article] [PubMed] [Google Scholar]
- Sexton JE, Desmonds T, Quick K, Taylor R, Abramowitz J, Forge A, Kros CJ, Birnbaumer L & Wood JN (2016). The contribution of TRPC1, TRPC3, TRPC5 and TRPC6 to touch and hearing. Neurosci Lett 610, 36–42. [DOI] [PMC free article] [PubMed] [Google Scholar]
- Sharif‐Naeini R, Dedman A, Folgering JHA, Duprat F, Patel A, Nilius B & Honor E (2008). TRP channels and mechanosensory transduction: Insights into the arterial myogenic response. Pflügers Arch Eur J Physiol 456, 529–540. [DOI] [PubMed] [Google Scholar]
- Shin YC, Shin SY, So I, Kwon D & Jeon JH (2011). TRIP database: a manually curated database of protein‐protein interactions for mammalian TRP channels. Nucleic Acids Res 39, 356–361. [DOI] [PMC free article] [PubMed] [Google Scholar]
- Tajada S, Cidad P, Moreno‐Domínguez A, Pérez‐García MT & López‐López JR (2012). High blood pressure associates with the remodelling of inward rectifier K+ channels in mice mesenteric vascular smooth muscle cells. J Physiol 590, 6075–6091. [DOI] [PMC free article] [PubMed] [Google Scholar]
- Wang M, Tang YB, Ma MM, Chen JH, Hu CP, Zhao SP, Peng DQ, Zhou JG, Guan YY & Zhang Z (2016). TRPC3 channel confers cerebrovascular remodelling during hypertension via transactivation of EGF receptor signalling. Cardiovasc Res 109, 34–43. [DOI] [PubMed] [Google Scholar]
- Wilson C & Dryer SE (2014). A mutation in TRPC6 channels abolishes their activation by hypoosmotic stretch but does not affect activation by diacylglycerol or G protein signaling cascades. Am J Physiol Renal Physiol 306, F1018–F1025. [DOI] [PubMed] [Google Scholar]
- Yeon S‐I, Kim JY, Yeon D‐S, Abramowitz J, Birnbaumer L, Muallem S & Lee Y‐H (2014). Transient receptor potential canonical type 3 channels control the vascular contractility of mouse mesenteric arteries. PLoS ONE 9, e110413. [DOI] [PMC free article] [PubMed] [Google Scholar]