Abstract
The antiandrogens, such as bicalutamide, targeting the androgen receptor (AR), are the main endocrine therapies for prostate cancer (PCa). But as drug resistance to antiandrogens emerges in advanced PCa, there presents a high medical need for exploitation of novel AR antagonists. In this work, the relationships between the molecular structures and antiandrogenic activities of a series of 7α-substituted dihydrotestosterone derivatives were investigated. The proposed MLR model obtained high predictive ability. The thoroughly validated QSAR model was used to virtually screen new dihydrotestosterones derivatives taken from PubChem, resulting in the finding of novel compounds CID_70128824, CID_70127147, and CID_70126881, whose in silico bioactivities are much higher than the published best one, even higher than bicalutamide. In addition, molecular docking, molecular dynamics (MD) simulations, and MM/GBSA have been employed to analyze and compare the binding modes between the novel compounds and AR. Through the analysis of the binding free energy and residue energy decomposition, we concluded that the newly discovered chemicals can in silico bind to AR with similar position and mechanism to the reported active compound and the van der Waals interaction is the main driving force during the binding process.
1. Introduction
According to the latest World Cancer Report 2014 [1], prostate cancer (PCa) has become the second most common cancer among men in the world. The morbidity rate of PCa has reached 15%, which is merely 1.7% lower than the leading lung cancer. It is reported that about 1100,000 people were diagnosed as new PCa patients in 2012 [2]. Additionally researchers pointed out that prostate cancer is not the privilege of men; women have similar prostate tissue, which also has the risk of cancer [3].
The androgen receptor (AR), a ligand inducible transcription factor in the nuclear hormone receptor super family [4], plays a critical role in the development and progress of PCa. Natural hormone testosterone (T) and dihydrotestosterone (DHT), known as androgens, are the endogenous ligands of AR. When bound to AR, androgens play significant roles in the sexual development, function, and musculoskeletal growth of male. The main mechanism of androgen action is to regulate the gene expression by means of binding to AR, changing the level of specific proteins in cells, and controlling cell behavior [5]. Therefore, a rational approach to cure PCa is the use of antiandrogens to prevent the interaction of T or DHT with AR.
At present, androgen receptor antagonists, such as bicalutamide and flutamide, are used as main hormone therapies for prostate cancer [6]. Although these antiandrogens exhibit good efficacy in many cases and comprise an important part of effective therapeutics [7–10], the emergence of recurrent and metastatic forms of castration-resistant PCa (CRPC) becomes a major challenge, with a median survival of only 1~2 years [11]. A possible reason is that these antiandrogens have partial agonistic activities at high concentration in vitro [12]. Therefore, the discovery of new AR antagonists with high antiandrogen activities is highly expected.
Here, in this study, to aid the research and development of steroidal antiandrogens, we investigated the relationships between a series of 7α-substituted dihydrotestosterone derivatives and corresponding antiandrogen activities. The vital features related to the bioactivities were explored, and a linear quantitative structure-activity relationship (QSAR) model was established according to OECD principles [13], using the QSARINS program [14, 15]. Then the QSAR model, thoroughly and strictly validated by various internal and external validation techniques, is used to virtually screen new dihydrotestosterones, without experimental bioactivities, downloaded from PubChem database [16]. Besides, molecular docking and molecular dynamics (MD) simulations are used to study the possible binding mode of compounds owning high in silico activities with androgen receptor. At last, the most active compounds with good binding affinities to AR, as highlighted by the Insubria graph [17], are proposed for experimental research group to test the antiandrogen activities in the future.
2. Materials and Methods
2.1. Data Set
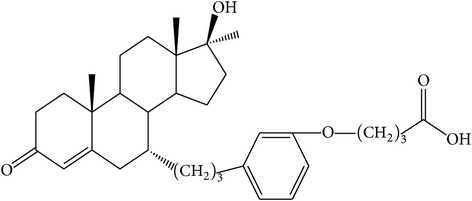
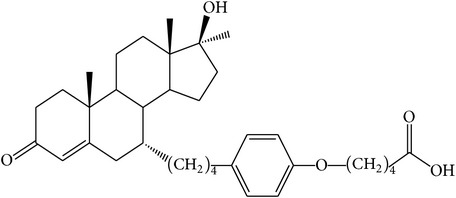
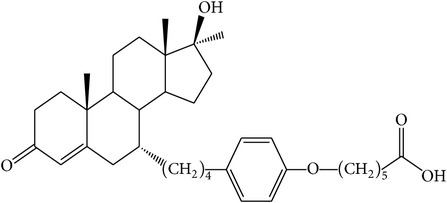
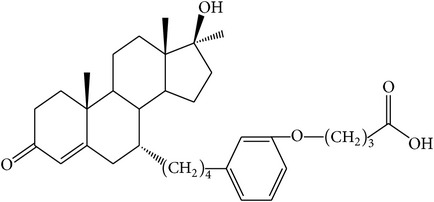
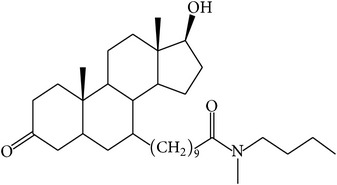
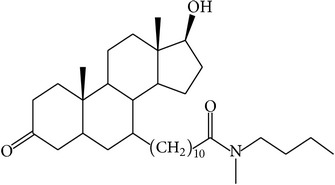
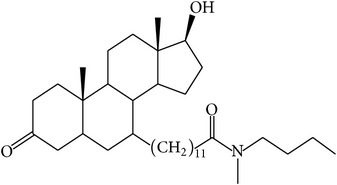
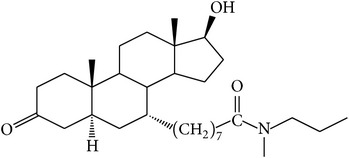
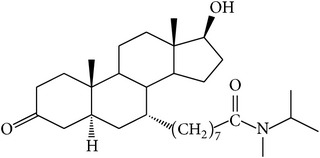
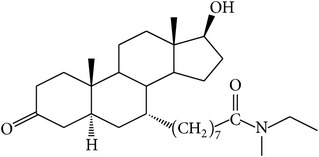
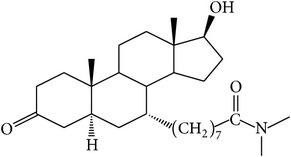
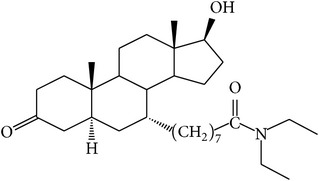
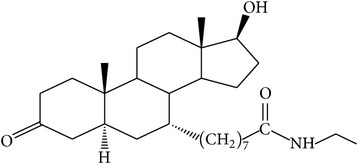
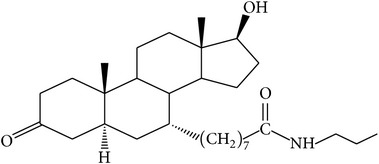
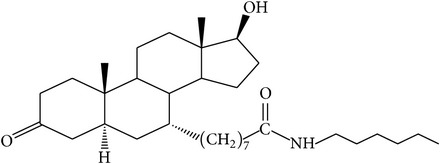
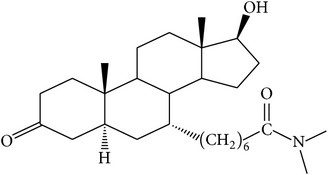
The success of any QSAR model depends on accurate and clean training data, proper representative descriptor selection methods, suitable statistical methods, and, most critically, both internal and external validation of resulting methods [18, 19]. Here, in this work, a set of 36 7α-substituted dihydrotestosterones derivatives were taken from literatures [20, 21]. The skeleton structure of these derivatives is shown in Figure 1, in which R group represents amine, carboxylic acids, and halogens, and so forth.
Figure 1.
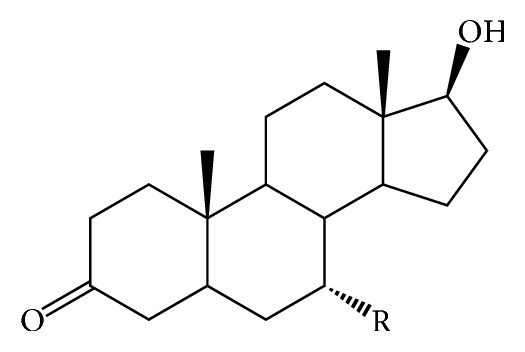
The skeleton structure of 7α-substituted dihydrotestosterones derivatives.
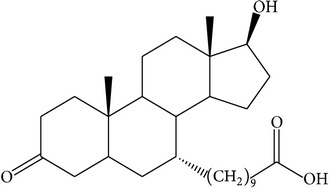
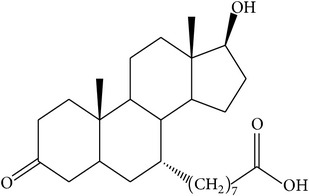
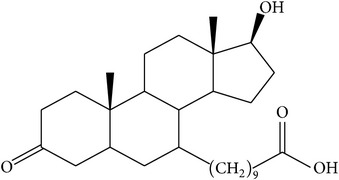
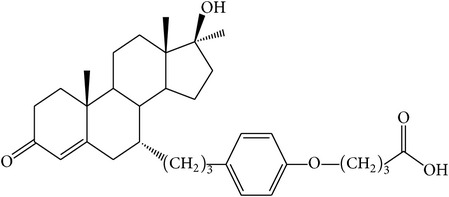
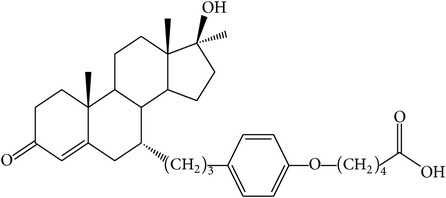
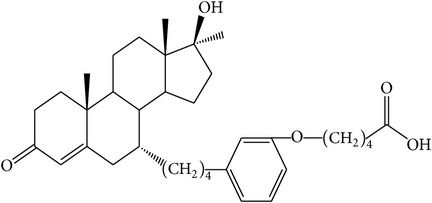
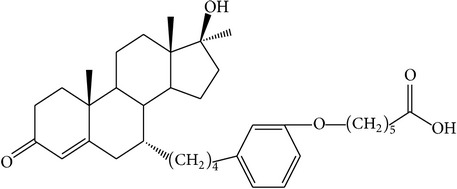
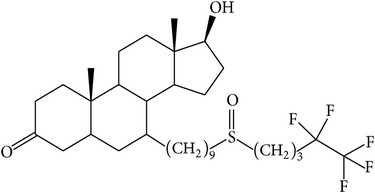
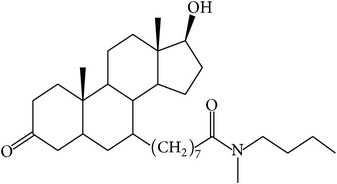
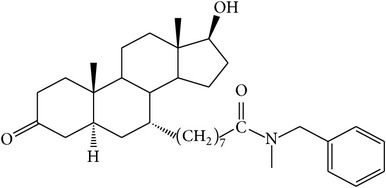
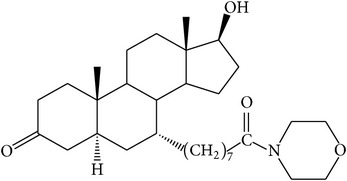
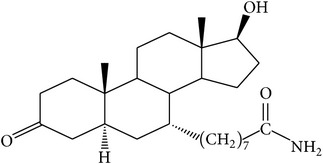
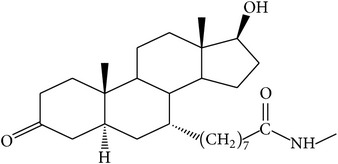
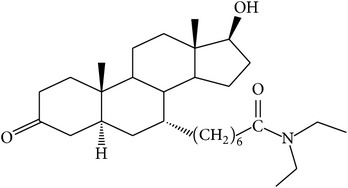
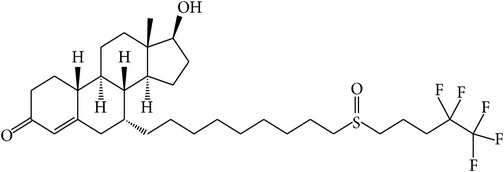
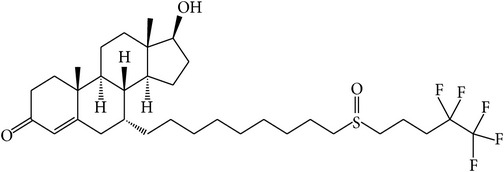
These molecules were divided into a training set and a prediction set according to the structure diversity in QSARINS. Finally, 29 compounds were included in the training set and 7 compounds were in the prediction set (prediction set a). The experimental values, half maximal inhibitory concentration (IC50) expressed in nM, were converted into negative logarithmic units marked as pIC50, which was used as dependent variables in the QSAR analyses. The studied molecular structures and corresponding antiandrogen activities were listed in Table 1.
Table 1.
The studied compounds and corresponding experimental and predicted pIC50 values.
| Number | Structure | Experimental pIC50 | Predicted pIC50 |
|---|---|---|---|
| 1a |
|
6.04 | 5.91 |
| 2a |
|
6.14 | 6.15 |
| 3a |
|
5.70 | 5.81 |
| 4 |

|
6.77 | 6.88 |
| 5 |
|
6.18 | 6.23 |
| 6a |
|
6.52 | 6.71 |
| 7 |
|
5.24 | 6.76 |
| 8 |

|
6.07 | 5.95 |
| 9 |
|
6.60 | 6.53 |
| 10 |
|
6.38 | 6.27 |
| 11 |
|
6.04 | 6.06 |
| 12a |
|
6.48 | 6.48 |
| 13 |
|
6.28 | 5.80 |
| 14 |
|
5.54 | 5.47 |
| 15 |
|
6.47 | 6.17 |
| 16 |

|
5.47 | 5.81 |
| 17a |
|
5.74 | 5.51 |
| 18 |
|
5.89 | 5.80 |
| 19 |
|
5.46 | 5.61 |
| 20 |
|
5.96 | 6.35 |
| 21a |
|
6.38 | 6.12 |
| 22 |
|
6.38 | 6.07 |
| 23 |
|
6.72 | 6.64 |
| 24 |
|
6.52 | 6.46 |
| 25 |
|
5.80 | 5.84 |
| 26 |
|
6.14 | 6.30 |
| 27 |

|
6.52 | 6.46 |
| 28 |

|
6.31 | 6.48 |
| 29 |
|
6.35 | 6.18 |
| 30 |
|
6.32 | 6.06 |
| 31 |
|
6.03 | 5.80 |
| 32 |
|
5.74 | 5.60 |
| 33 |

|
5.20 | 5.50 |
| 34 |
|
5.18 | 5.24 |
| 35 |
|
6.70 | 6.59 |
| 36 |
|
6.28 | 6.59 |
| 37b |
|
6.02 | 6.38 |
| 38b |
|
5.66 | 5.49 |
aThe prediction set a; bthe prediction set b (Bradbury et al., 2011).
2.2. Descriptors Calculation
To describe a molecule, the molecular structures were firstly sketched in HyperChem program [22] and then were optimized to the minimum energy conformation by using AM1 method. After minimization, we submit the structures to DRAGON 5.5 software [23] to calculate 2914 descriptors including zero-, one-, two-, and three-dimensional (0D, 1D, 2D, and 3D), charge descriptors, and molecular properties. The related theories of the molecular descriptors are provided by DRAGON software, and the calculation procedure is clarified in detail, in the Handbook of Molecular Descriptors [24].
In order to facilitate the successive feature selection process, the constant and near constant descriptors were removed. Besides, if pairwise correlation of two descriptors is larger than 0.98, the one showing the highest pairwise correlation with others will be excluded. Finally, 358 descriptors remained for the next variable selection process.
2.3. QSAR Model Generation
After descriptor calculation, genetic algorithm (GA) implemented in QSARINS software was used to select descriptors. The final model was built by using MLR method based on the selected descriptors, named GA-MLR. The first step of GA is to produce a set of solutions randomly which is called initial population. Each solution, a model based on the contained descriptors by using multiple linear regressions method, is called a chromosome. Subsequently, the fitness function, Friedman LOF, is used to evaluate the fitness of these individuals:
| (1) |
Here, SSE represents the sum of squares of errors, c is the number of basis function, d is the smoothness factor (default 0.5), p is the number of features in the model, and n is the number of samples for model construction. In the successful selection stage, the fittest individuals evolve to the next generation. Then crossover and mutation operators were performed to generate new individuals. Finally a new population is formed consisting of the fittest chromosomes. The above evolution continues until the stop conditions are satisfied. The related parameters that control the GA performance are list as follows: population size (200), maximum generations (10000), and mutation probability (0.05).
2.4. Model Validation
QSARINS is based on GA-MLR method and performed various tools to a rigorous internal and external validation, based on the different validation criteria, as well as for the check of model applicability domain.
The robustness and stability of the built model were validated by several statistical parameters, such as determination coefficient (R2), leave-one-out (LOO) cross-validation QLOO2, and root mean squared error (RMSE). Besides, leave-many-out (LMO) cross-validation method was also performed and QLMO2 was reported. Randomization technology, by reordering the independent variable, was used to exclude the possibility of the chance correlation. Generally, the correlation coefficient of the built QSAR model should exceed Y randomized generated model. After Y scrambling was carried out with iterations of 5,000, the average value of squared correlation coefficient of the randomized models R2 and QLOO2 was reported.
A good QSAR model should also have satisfactory predictive ability. The best way to evaluate the predictive ability of a model is its validation by new compounds, called prediction set, which do not participate in the process of model building. After the activities of the prediction set samples were predicted, the agreement between the experimental and predicted values was calculated as a measure of a QSAR model quality. Here we adopt several ways to calculate this agreement, QF12, QF22 [25], QF32 [26], and CCC [27–29].
All the above external validation parameters were calculated in the software QSARINS and were combined to evaluate the predictive ability of the proposed model.
2.5. Applicability Domain
To validate the practical applicability of a model to a new chemical, the applicability domain (AD), a theoretical domain which is defined by means of the selected descriptors in the process of modeling, should be defined properly. In this research, the AD was quantitatively assessed by the leverage approach [30, 31]. The leverage (hat, h) was calculated by hi = xi(XTX)xiT (i = 1,…, m), where xi was the descriptor row-vector of the query compound i and X was the n∗p matrix of the training set (p is the number of model descriptors). The limit of model domain was quantitatively defined by the leverage cutoff (h∗), set as 3(p + 1)/n. A leverage greater than h∗ means that the query was outside of the model structural AD, so the predictions were extrapolations of the model and could be less reliable. The AD for chemicals with experimental data was verified by the Williams plot, where the hat values versus the standardized residuals were plotted, while the AD for chemicals without experimental data, which were analyzed in the virtual screening, was verified by the Insubria graph where the hat values were plotted versus the predicted responses [14, 18].
2.6. Virtual Screening of Potent Steroidal Antiandrogens
To explore more 7α-substituted dihydrotestosterones and to find similar derivatives with high antiandrogen activities, the studied skeleton structure was used as a query to search PubChem database for new dihydrotestosterones, without experimental bioactivities. Then the established MLR model, after thoroughly being validated internally and externally, was used to predict the antiandrogenic activities of these new dihydrotestosterones, verifying the AD.
Besides, molecular docking was employed to investigate the possible interaction mechanisms of the samples owning high in silico antiandrogenic activities with AR. Particularly, comprehensively considering the docking speed and accuracy, LigandFit, which is commonly used as a flexible docking method executed in the commercial software Discovery Studio 2.5 [32], was applied into the progress of structure-based virtual screening. The protein structure of AR was firstly downloaded from RCSB Protein Data Bank [33] (PDB entry code: 1T65) and imported in docking process. All ligands and water molecules were removed at first, the charge and polar hydrogen atoms were added, and the incomplete residues were corrected.
2.7. Molecular Dynamics (MD) Simulations
The molecular dynamics (MD) simulations were carried out using the Amber 14 software package [34]. MD is a commonly used methodology in exploring the interaction between ligand and protein. We have investigated the interaction mechanisms of R-bicalutamide/S-1 with WT/W741L AR using molecular dynamics simulations [35]. The docked structures of AR (PDB ID: 1T65) with the reported most active compound number 4 and novel chemicals with high in silico activities were used as the initial structures for MD simulations. During the process of docking, taking into consideration the fact that these residues collide significantly with the compounds, Helix 12 of AR was removed in the model as executed in the literature [36].
All missing hydrogen atoms of the AR were added by the LEaP module of the Amber 14 package. To maintain the electroneutrality of all the studied complexes, the appropriate number of chloride counterions was added. Then each complex was immersed into a cubic periodic box of TIP3P water model [37] with at least 10 Å distance around the complex.
For the ligand, the GAFF parameter assignments [38] were made by using Antechamber program and the partial charges were assigned by using the AM1-BCC method [39].
Amber 14 package and the Amberff03 force field were used for all molecular dynamics simulations. Sander program was carried out for the energy minimization and equilibration protocol. First, energy minimization of four complexes was done through three stages, using the steepest descent method switched to a conjugate gradient every 2500 steps for a total of 5000 steps with a nonbonded cutoff of 10 Å. In the first stage, to enable the added TIP3P water molecules to adjust to their proper orientations, the AR and ligand were restrained with 5.0 kcal mol−1 Å−2. In the second stage, to enable the AR to find a better way of accommodating ligand, the protein backbone was restrained with 3.0 kcal mol−1 Å−2. In the third stage, the entire solvated system was minimized without any restraint. Additionally, gradual heating, density, and equilibration protocols were performed. During the 100 ps heating procedure, the system was gradually heated from 0 to 310 K, and then the density was at 310 K for 400 ps, and at last the equilibration was at 310 K for 400 ps.
Afterwards, four 20 ns production MD simulations were carried out with the PMEMD program without any restraints in the isothermal isobaric ensemble (NPT, P = 1 atm, T = 310 K) MD. The time step was set at 2 fs. 10 Å cutoff was applied to treat nonbonding interactions. During the simulations periodic boundary conditions were employed and all electrostatic interactions were calculated using the particle mesh Ewald (PME) method. The SHAKE algorithm was used to restrain all bond lengths containing hydrogen atoms. All of the coordinate trajectories were recorded every 2 ps throughout all MD runs. To analyze the energy and structure, a total of 500 snapshots of the simulated structures stripped in the last 2 ns stable MD production trajectory at 4 ps intervals were extracted.
2.8. Binding Free Energy Calculations
For each protein-ligand complex, the binding free energy was analyzed by the MM/GBSA method [40]. To compare the AR binding free energies with different ligands, MM/GBSA calculation was applied to the 500 snapshots extracted from the final 2 ns of the MD trajectories. The total free energy of binding free energy was composed of the following molecular species (complex):
| (2) |
where Gcomplex, Gprotein, and Gligand are the free energy of complex, receptor, and ligand, respectively. The free energy for each species (complex, ligand, or receptor) can be decomposed into a gas phase energy (ΔEMM), a solvation-free energy (ΔGsol), and an entropy term (TΔS).
| (3) |
where the ΔEMM is the sum of the internal energy of bonds, angle, and torsion (ΔEval), electrostatic interaction energy (ΔEele), and van der Waals interaction energy (ΔEvdw). ΔGsol is solvation-free energy and can be divided into two parts, the polar solvation-free energy (ΔGp) and the nonpolar solvation-free energy (ΔGnp). The polar solvation-free energy ΔGp is determined by generalized Born (GB) equation. The values of the dielectric constant for solute and solvent were set as 1 and 80. ΔGnp is the nonpolar solvation contribution and was calculated with constants 0.0072 kcal mol−1 Å−2 for surface tension proportionality constant γ and 0.92 kcal mol−1 Å−2 for the nonpolar free energy for a point solute β. SASA is the solvent accessible surface area and is determined by recursively approximating a sphere around each atom, starting from icosahedra (ICOSA method). TΔS is the entropy term, including the translational, rotational, and vibrational terms of the solute molecules.
2.9. Energy Decomposition
Furthermore, to obtain the contribution of each residue to the binding process, we performed binding free energy decomposition. The MM/GBSA approach was used to calculate the per-residue free energy decomposition, which is based on the same 500 snapshots we have extracted from the last 2 ns of the stable MD trajectory.
2.10. Normal Mode Calculation
Entropy was analyzed by normal mode with AMBER14 NMODE module. Due to the high computational cost in the entropy calculation, 50 snapshots were extracted from the last 2 ns trajectory of the simulation with 40 ps time intervals.
3. Results and Discussion
3.1. The Linear MLR Model
The training set samples, 29 compounds as listed in Table 1, were used to build QSAR model by using GA-MLR methods, and the remaining compounds were used to evaluate the predictive ability of the built model. GA provided a series of linear equations containing different descriptor combinations with different performance, but similarly satisfactory. An excellent QSAR model should have high fitting ability, high cross-validated QLOO2, high external predictive ability, and little difference between internal and external predictive ability.
Based on the above principles, a four-descriptor model was selected as the final model. The involved descriptors and corresponding physical-chemical meanings were listed in Table 2. The corresponding model equation and statistic parameters are listed as follows:
| (4) |
From the linear equation and statistic parameters, we could see that the fitting ability of the final model was relatively high with R2 of 0.760 and the final model was stable with QLOO2 of 0.656 and QLMO2 of 0.662. About the predictive ability of the final model, we could find that QF12 and QF22 have similar high values. Compared with QF12 and QF22, the value of QF32 was higher. Besides, the value of CCC was as high as 0.891, surpassing the threshold value of 0.85 as suggested in literature [29] for predictive model. Additionally, the RMSE values for the training set and prediction set were similarly very low. All these parameters indicated the higher external prediction ability of the final model. The interrelation coefficients of the selected descriptors were presented in the Table 3. It could be seen that the highest intercorrelation coefficient K was −0.61 between IC5 and HATS3e, which indicated that the used variables were independent. All results proved that the selected model was reliable, stable, and predictive.
Table 2.
The selected descriptors used to build QSAR model and corresponding meanings.
| Descriptor | Meaning | Descriptor type |
|---|---|---|
| IC5 | Information content index (neighborhood symmetry of 5-order) | Information indices |
| GATS5e | Geary autocorrelation, lag 5/weighted by atomic Sanderson electronegativities | 2D autocorrelations |
| DISPp | d COMMA2 value/weighted by atomic polarizabilities | Geometrical descriptors |
| HATS3u | Leverage-weighted autocorrelation of lag 3/unweighted | GETAWAY descriptors |
Table 3.
The correlation coefficients (K) of the selected descriptors in the model.
| IC5 | GATS5e | DISPp | HATS3u | |
|---|---|---|---|---|
| IC5 | 1 | |||
| GATS5e | 0.07 | 1 | ||
| DISPp | 0.25 | 0.36 | 1 | |
| HATS3u | −0.625 | 0.19 | −0.15 | 1 |
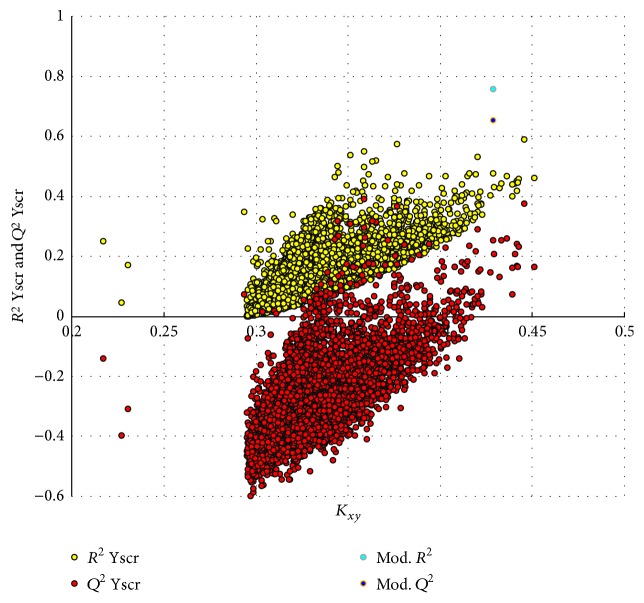
Y randomization technique was carried out with iterations of 5000 in QSARINS. Figure 2 showed the plot of R2 and Q2 values versus Kxy, automatically obtained in QSARINS. From Figure 2, we could find that the R2 and Q2 values of the final model were much higher than the models from scrambled Y-column, because the relationship between molecular structure and response was broken. This result indicated that the relationships between structures of 7α-substituted dihydrotestosterones and corresponding pIC50 values did exist in the proposed model, and it was really not obtained by chance.
Figure 2.
The distribution of R2 and Q2 of 5000 iterated Y-scrambled models in comparison to the proposed model performances.
The predicted pIC50 values by MLR model were listed in Table 1. Figure 3 was the scatter plot of the experimental versus the predicted pIC50 values. It was obvious that, in Figure 3, all predicted pIC50 values were close to the line y = x, which indicated that the linear model can accurately predict the antiandrogenic values of these derivatives.
Figure 3.
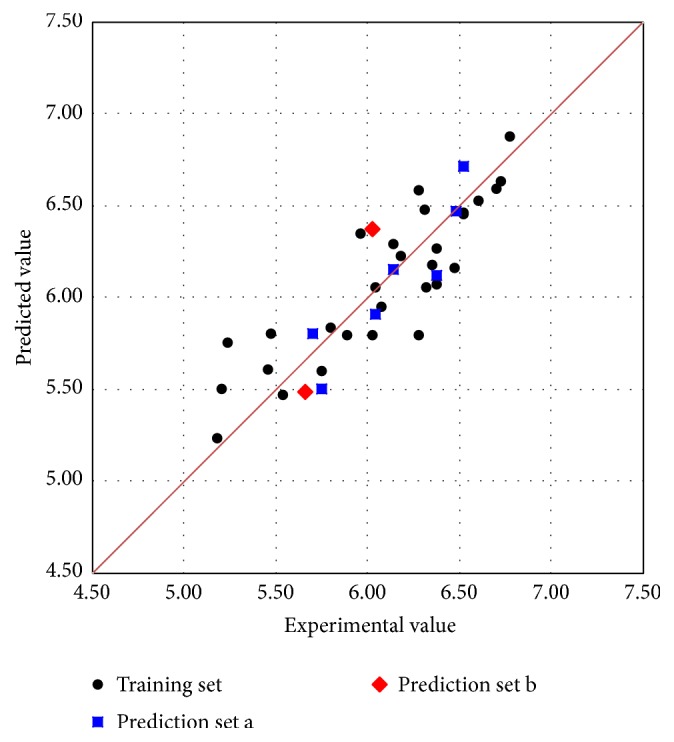
The scatter plot of the experimental versus the predicted pIC50 by MLR model.
The model applicability domain was evaluated by means of leverage analysis, namely, Williams plot, shown in Figure 4, in which the standardized residuals (σ) and leverage values (h) were plotted. In Figure 4, we could see that all compounds were inside the model structural applicability domain (h∗ = 0.517) and reasonably well predicted with standard residue smaller than 2.5σ.
Figure 4.
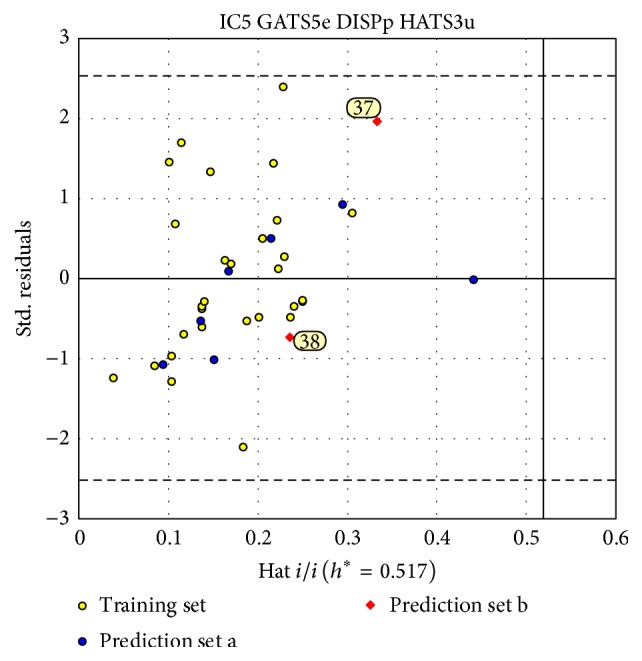
The Williams plot of final MLR model.
After the MLR model was built, we luckily found two new 7α-substituted dihydrotestosterones, showed in Table 1 (marked as “b,” prediction set b), with experimental antiandrogen activities from another published literature [41]. These two compounds were additionally used to validate our model. Both of them (numbered in the Williams plot of Figure 4) were located in the applicability domain of the MLR model with h value of 0.332 for compound 37 and 0.237 for compound 38. The predictions on them were quite near to their experimental values. In Figure 3, these two samples (in red) were very near to the line y = x. These results further indicated the high predictive ability of the proposed MLR model.
By interpreting the meaning of the descriptors used in the model, we could extract vital structural features, to some extent, responsible for the antiandrogenic activities of these steroidal derivatives. IC5 was calculated as the mean information content as follows: IC5 = −∑g−1Ag(Ag/nAT) · log2(Ag/nAT), where g runs over the equivalence classes, Ag was the cardinality of the gth equivalence class, and nAT was the total number of atoms. This index represented a measure of structural complexity per vertex. GATS5e belonged to 2D autocorrelations and was Geary autocorrelation, lag 5/weighted by atomic Sanderson electronegativities. This descriptor was favorable to the antiandrogen activities of these steroidal derivatives. DISPp, geometrical descriptors, indicated the displacement between the geometric center and the center of the polarizability, calculated with respect to the molecular principal axes. HATS3u is a GETAWAY descriptor [42], representing the leverage-weighted autocorrelation of lag 5/weighted by atomic polarizabilities. With the increase of these two descriptors, the bioactivities of the studied compounds decreased.
3.2. Virtual Screening
From PubChem database, we found 110 new 7α-substituted dihydrotestosterone derivatives, without experimental data. By exploring the leverage h values, 77.27% of them were located in the structural applicability domain of the proposed MLR model. Figure 5 is the Insubria graph of these dihydrotestosterones, the plot of leverage values versus predicted pIC50, which was proposed especially for exploring the unknown samples. In Figure 5, most chemicals are in the range of the hat cutoff (h∗ = 0.517). Inside the model AD, the most active compound is CID_70128824, which has in silico PIC50 of 7.37, higher than the reported most active compound number 4 (pIC50 = 6.77). Outside the model AD, we luckily obtained several samples with higher in silico activities, especially CID_70126881 and CID_70127147, which showed excellent in silico antiandrogen activities as high as 7.90 and 7.76, respectively, even higher than bicalutamide and hydroxyflutamide. The ID of these compounds and corresponding predicted pIC50 values are listed in Table 4. Though only these three compounds were highlighted here, other samples with high in silico activities, especially those located in the model structural AD, were also worthy of our attention.
Figure 5.
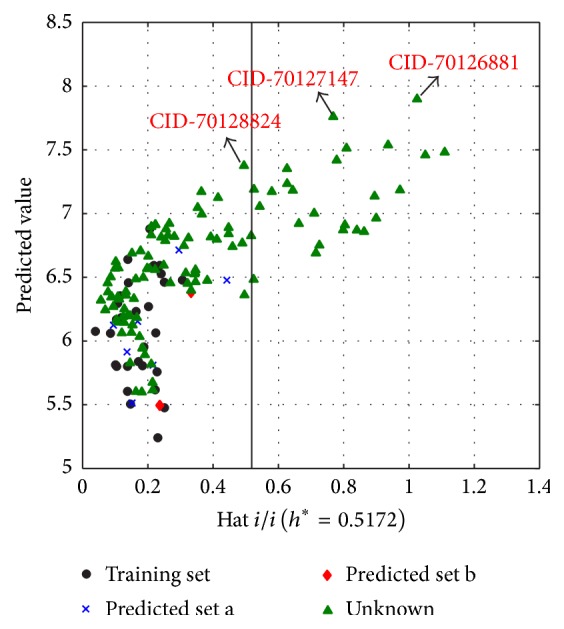
Insubria graph (plot of hat values versus predicted values for the complete compounds).
Table 4.
The 110 new compounds from PubChem database and corresponding predicted activities.
| Number | MolID | Pred | ADa |
|---|---|---|---|
| 1 | CID_44421999 | 6.32 | Y |
| 2 | CID_44422008 | 6.49 | Y |
| 3 | CID_44422014 | 6.53 | Y |
| 4 | CID_44422020 | 6.47 | Y |
| 5 | CID_44422031 | 6.34 | Y |
| 6 | CID_44422034 | 6.15 | Y |
| 7 | CID_44422037 | 6.14 | Y |
| 8 | CID_44422041 | 6.07 | Y |
| 9 | CID_44422043 | 5.82 | Y |
| 10 | CID_44422044 | 5.67 | Y |
| 11 | CID_44422045 | 5.62 | Y |
| 12 | CID_44422047 | 6.69 | N |
| 13 | CID_44422053 | 6.16 | Y |
| 14 | CID_44422054 | 6.91 | Y |
| 15 | CID_44422058 | 6.90 | Y |
| 16 | CID_44422064 | 6.12 | Y |
| 17 | CID_44422067 | 5.94 | Y |
| 18 | CID_44422075 | 6.25 | Y |
| 19 | CID_44422080 | 6.33 | Y |
| 20 | CID_44433644 | 6.53 | Y |
| 21 | CID_44433645 | 6.20 | Y |
| 22 | CID_67854257 | 7.51 | N |
| 23 | CID_69758112 | 6.69 | Y |
| 24 | CID_70126216 | 7.35 | N |
| 25 | CID_70126231 | 7.17 | Y |
| 26 | CID_70126247 | 6.91 | Y |
| 27 | CID_70126297 | 5.60 | Y |
| 28 | CID_70126298 | 5.83 | Y |
| 29 | CID_70126305 | 6.56 | Y |
| 30 | CID_70126327 | 7.42 | N |
| 31 | CID_70126491 | 6.40 | Y |
| 32 | CID_70126782 | 6.27 | Y |
| 33 | CID_70126784 | 6.24 | Y |
| 34 | CID_70126798 | 6.48 | N |
| 35 | CID_70126802 | 6.87 | N |
| 36 | CID_70126837 | 6.36 | Y |
| 37 | CID_70126868 | 6.75 | N |
| 38 | CID_70126881 | 7.90 | N |
| 39 | CID_70126979 | 6.39 | Y |
| 40 | CID_70126991 | 6.89 | Y |
| 41 | CID_70127144 | 6.82 | Y |
| 42 | CID_70127147 | 7.76 | N |
| 43 | CID_70127181 | 6.03 | Y |
| 44 | CID_70127183 | 6.35 | Y |
| 45 | CID_70127185 | 6.87 | N |
| 46 | CID_70127188 | 6.96 | N |
| 47 | CID_70127192 | 6.88 | Y |
| 48 | CID_70127194 | 6.81 | Y |
| 49 | CID_70127269 | 6.35 | Y |
| 50 | CID_70127287 | 7.48 | N |
| 51 | CID_70127296 | 6.92 | N |
| 52 | CID_70127297 | 6.77 | Y |
| 53 | CID_70127298 | 6.82 | Y |
| 54 | CID_70127444 | 6.80 | Y |
| 55 | CID_70127446 | 7.54 | N |
| 56 | CID_70127567 | 5.89 | Y |
| 57 | CID_70127714 | 7.00 | N |
| 58 | CID_70127721 | 6.57 | Y |
| 59 | CID_70127722 | 6.82 | Y |
| 60 | CID_70127760 | 6.91 | N |
| 61 | CID_70127771 | 6.66 | Y |
| 62 | CID_70127818 | 7.06 | N |
| 63 | CID_70127821 | 7.17 | N |
| 64 | CID_70128062 | 6.59 | Y |
| 65 | CID_70128068 | 7.19 | N |
| 66 | CID_70128078 | 6.06 | Y |
| 67 | CID_70128083 | 6.83 | Y |
| 68 | CID_70128084 | 6.81 | Y |
| 69 | CID_70128209 | 6.75 | Y |
| 70 | CID_70128238 | 6.83 | Y |
| 71 | CID_70128450 | 6.33 | Y |
| 72 | CID_70128452 | 7.23 | N |
| 73 | CID_70128456 | 6.71 | Y |
| 74 | CID_70128462 | 6.84 | Y |
| 75 | CID_70128533 | 6.79 | Y |
| 76 | CID_70128534 | 6.92 | Y |
| 77 | CID_70128574 | 7.18 | N |
| 78 | CID_70128608 | 7.18 | N |
| 79 | CID_70128824 | 7.37 | Y |
| 80 | CID_70128828 | 6.46 | Y |
| 81 | CID_70128830 | 7.00 | Y |
| 82 | CID_70128847 | 7.46 | N |
| 83 | CID_70128902 | 6.50 | Y |
| 84 | CID_70128904 | 6.57 | Y |
| 85 | CID_70128987 | 5.60 | Y |
| 86 | CID_70129065 | 6.69 | N |
| 87 | CID_70129161 | 7.05 | Y |
| 88 | CID_70129198 | 6.53 | Y |
| 89 | CID_70129204 | 7.14 | N |
| 90 | CID_70129375 | 6.18 | Y |
| 91 | CID_70129377 | 6.74 | Y |
| 92 | CID_70129380 | 7.12 | Y |
| 93 | CID_9804916 | 6.38 | Y |
| 94 | CID_9826776 | 6.33 | Y |
| 95 | CID_9827285 | 6.48 | Y |
| 96 | CID_9828392 | 6.12 | Y |
| 97 | CID_9828587 | 6.86 | N |
| 98 | CID_9829426 | 6.45 | Y |
| 99 | CID_9891033 | 6.14 | Y |
| 100 | CID_9893352 | 5.94 | Y |
| 101 | CID_9933226 | 6.34 | Y |
| 102 | CID_9935104 | 6.56 | Y |
| 103 | CID_9935196 | 6.57 | Y |
| 104 | CID_9935788 | 6.50 | Y |
| 105 | CID_9936347 | 6.45 | Y |
| 106 | CID_9936803 | 6.36 | Y |
| 107 | CID_9955874 | 6.20 | Y |
| 108 | CID_9957122 | 6.62 | Y |
| 109 | CID_9957692 | 6.57 | Y |
| 110 | CID_9958161 | 6.19 | Y |
aAD: model structural applicability domain; Y: compound inside the model structural AD; N: compound outside the model structural AD.
To further explore the possible binding mode of the screened compounds, molecular docking was employed to study the interaction between compounds owning high in silico activities (especially CID_70128824, CID_70126881, and CID_70127147), together with the reported most active compound 4 as a comparison, and androgen receptor (PDB ID: 1T65) by using LigandFit module in Discovery Studio 2.5. Firstly, DHT was extracted from crystal structure and redocked into ligand binding pocket to obtain the optimal docking parameters. Secondly, the ligand binding site was defined with the same parameters as DHT. At this point, the radius of SBD_Site_Sphere was set to 10 Å. The other parameters were set by default.
To obtain reasonable conformations of different complex, the top-ranked compounds with lowest RMSD values were extracted. The binding mode of compound 4, CID_70128824, CID_70126881, and CID_70127147 with AR were presented in Figure 6. From this Figure, it could be seen that the docked pose of CID_70128824, CID_70126881, and CID_70127147 located in the same position with similar orientation in the AR ligand binding site to compound 4. All these results indicated that though two of them were outside of the model AD, these three compounds CID_70128824, CID_70126881, and CID_70127147 might have good performance to antagonize androgen receptor and have the potency for further research and development for PCa therapy.
Figure 6.
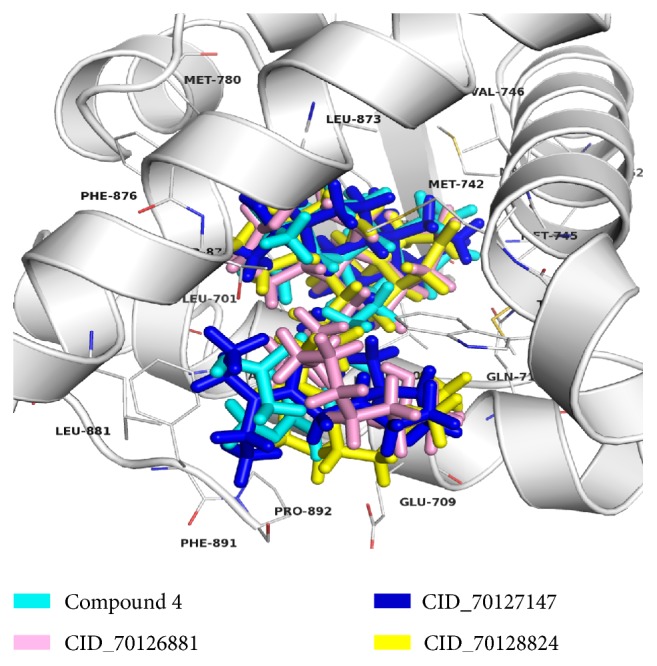
The molecular binding models of compound 4 (cyan), CID_70128824 (yellow), CID_70126881 (pink), and CID_70127147 (blue) in the AR ligand binding site.
3.3. MD Simulations
3.3.1. System Equilibration
In order to verify whether the studied systems reach equilibrium, the root mean square deviations (RMSDs) of all the backbone atoms of the protein, the Cα atoms for the residues of the active site (residues within 5 Å around ligand), and the heavy atoms of ligand from the initial structure were monitored to examine the dynamic stability of the systems and plotted against time, as shown in Figure 7. The three RMSDs have small fluctuations after 15 ns, implying that the studied systems have reached stability. We used the last 2 ns to analyze the energy and binding modes for the four complexes.
Figure 7.
Time series of (a) the RMSDs of backbone atoms of androgen receptor, (b) the RMSD of Cα atoms for the residues around 5 Å of the ligand, and (c) the RMSD of the heavy atoms of ligand.
3.3.2. Validation of the MD Simulations
We calculated the binding free energy by MM/GBSA method between the four ligands and AR to validate the reliability of the MD simulation. Table 5 lists the binding free energy and all of the energy terms for the four compounds. From Table 5, the four complexes had different binding free energy; the ranking order is CID_70126881 (−41.62 kcal mol−1), CID_70127147 (−33.06 kcal mol−1), CID_70128824 (−31.86 kcal mol−1), and compound 4 (−22.69 kcal mol−1). Different binding free energy means different binding affinity between the four complexes. We have proved that the antiandrogen activity of compounds CID_70126881, CID_70127147, and CID_70128824 are higher than the published best one (compound 4) by MLR model. In addition, the ranking of the calculated binding free energy was consistent with their in silico bioactivities order.
Table 5.
The calculated binding free energies (kcal mol−1) of four systems.
| Complex | Contribution | ||||||||
|---|---|---|---|---|---|---|---|---|---|
| ΔEele | ΔEvdw | ΔGp | ΔGnp | ΔEMM | ΔGsol | ΔEbind | −TΔS | ΔGbind | |
| Compound 4 | −29.58 | −58.93 | 44.95 | −6.74 | −88.50 | 38.22 | −50.28 | 27.59 | −22.69 |
| CID_70128824 | −3.32 | −70.56 | 24.14 | −7.25 | −73.88 | 16.89 | −56.99 | 25.13 | −31.86 |
| CID_70127147 | −16.79 | −71.34 | 33.50 | −7.80 | −88.13 | 25.69 | −62.44 | 29.38 | −33.06 |
| CID_70126881 | −10.01 | −69.32 | 25.14 | −8.85 | −79.33 | 16.29 | −63.05 | 21.43 | −41.62 |
3.3.3. Analysis of the Interaction Mechanism
According to the calculated binding free energy, CID_70126881 holds the strongest binding affinity; on the contrary, compound 4 has the lowest binding affinity. As can be seen from Table 5, the nonpolar interactions (ΔGnonpolar) including van der Waals (Evdw) and nonpolar solvation (ΔGnp) terms are the driving force for the binding of the four ligands to AR, and the total polar contributions (ΔGp) are unfavorable for their binding. In addition, CID_70126881, CID_70127147, and CID_70128824 have almost the same van der Waals interactions toward AR (−69.32 kcal mol−1, −71.34 kcal mol−1, and −70.56 kcal mol−1 for CID_70126881-AR, CID_70127147-AR, and CID_70128824-AR), while compound 4 has a low van der Waals value, which may partly explain the reduced binding affinity of compound 4 and prove that the newly discovered chemicals could possess higher antiandrogen activities.
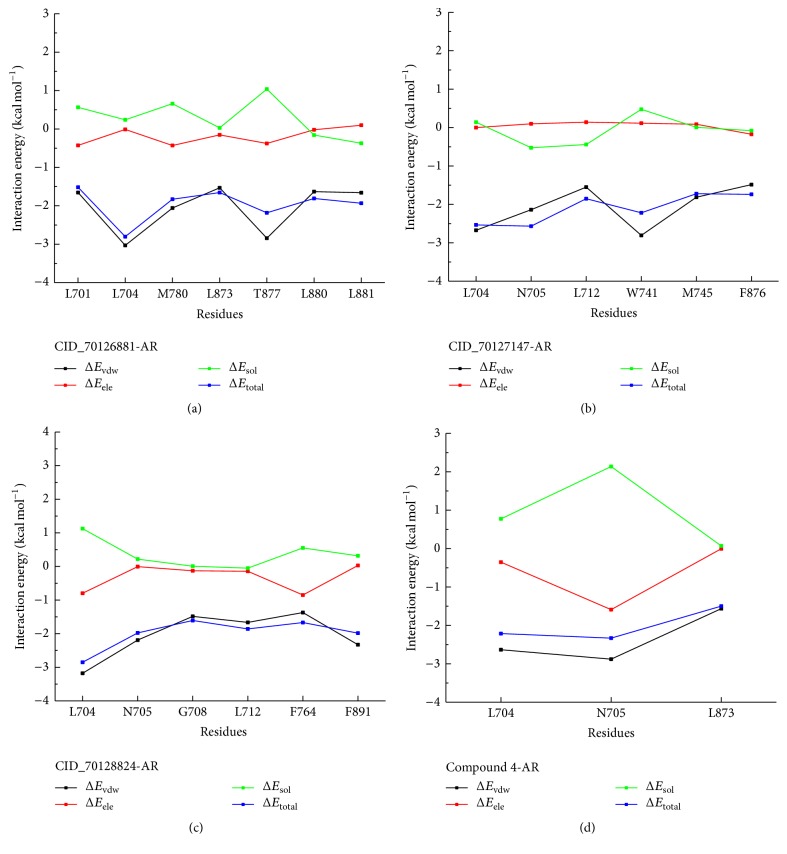
To obtain the detailed interaction between four ligands and AR, the decomposition of binding free energy, which is calculated by MM/GBSA method, was executed to identify key residues during the binding process. The result of energy decomposition contains van der Waals, electrostatic, solvation-free energy, and total energy contribution terms, respectively, for four systems, shown in Figure 8. All the residues with great energy contributions were almost more than 1.5 kcal mol−1. As shown in Figure 8(a), residues L701, L704, M780, L873, T877, L880, and L881 of AR make a significant contribution to the CID_70126881-AR binding, as well as those for the CID_70127147-AR which are L704, N705, L712, W741, M745, and F876 (Figure 8(b)). In Figure 8(c), residues L704, N705, G708, L712, F764, and F891 of AR make a substantial contribution to the CID_70128824-AR binding. However, only two key residues (L704 and N705) were the major energy contributions to compound 4-AR binding as shown in Figure 8(d). As mentioned previously, the vast majority of key residues of AR were nonpolar; it was reasonable to speculate that these residues can form greater van der Waals interactions with hydrophobic ligand and exhibit more favorable nonpolar interaction contribution to the binding free energy.
Figure 8.
Energy decomposition of key residues in four complexes.
The MD simulation, together with the docking results, confirmed that the newly discovered chemicals CID_70126881, CID_70127147, and CID_70128824 share similar binding mode with the reported compound 4, and the in silico antiandrogen activities of them are higher through the calculated binding free energy and decomposition of binding free energy.
4. Conclusions
In this study, the relationships between a series of 7α-substituted dihydrotestosterone derivatives and corresponding antiandrogen activities were explored. A reliable, stable, and robust linear MLR model with four descriptors was built and validated in QSARINS. The predictive ability of the final model, fully evaluated by using two different prediction sets, is excellent enough to be used to virtually screen novel 7α-substituted dihydrotestosterones from PubChem database. After antiandrogenic activity prediction, molecular docking, and molecular dynamic simulations, CID_70126881, CID_70127147, and CID_70128824, as the most potent chemicals with good binding affinities to androgen receptor, were proposed. Of course, bioassay experimental researches are needed to evaluate the virtual screening results. This study provides the theoretical basis and specific chemicals for AR antagonists, which can help the experimental research groups to search for potential antiandrogens.
Acknowledgments
This research is sponsored by the National Natural Science Foundation of China (Grant no. 21205055) and Fundamental Research Funds for the Central Universities (lzujbky-2015-310).
Competing Interests
The authors declare that there is no conflict of interests regarding the publication of this paper.
References
- 1. http://www.iarc.fr/en/publications/books/wcr/index.php.
- 2. http://globocan.iarc.fr/Pages/fact_sheets_cancer.aspx.
- 3.Dietrich W., Susani M., Stifter L., Haitel A. The human female prostate—immunohistochemical study with prostate‐specific antigen, prostate‐specific alkaline phosphatase, and androgen receptor and 3‐D remodeling. Journal of Sexual Medicine. 2011;8(10):2816–2821. doi: 10.1111/j.1743-6109.2011.02408.x. [DOI] [PubMed] [Google Scholar]
- 4.Rosen J., Day A., Jones T. K., Jones E. T. T., Nadzan A. M., Stein R. B. Intracellular receptors and signal transducers and activators of transcription superfamilies: novel targets for small-molecule drug discovery. Journal of Medicinal Chemistry. 1995;38(25):4855–4874. doi: 10.1021/jm00025a001. [DOI] [PubMed] [Google Scholar]
- 5.Fix C., Jordan C., Cano P., Walker W. H. Testosterone activates mitogen-activated protein kinase and the cAMP response element binding protein transcription factor in Sertoli cells. Proceedings of the National Academy of Sciences of the United States of America. 2004;101(30):10919–10924. doi: 10.1073/pnas.0404278101. [DOI] [PMC free article] [PubMed] [Google Scholar]
- 6.Stewart A. B., Lwaleed B. A., Douglas D. A., Birch B. R. Current drug therapy for prostate cancer: an overview. Current Medicinal Chemistry—Anti-Cancer Agents. 2005;5:603–612. doi: 10.2174/156801105774574658. [DOI] [PubMed] [Google Scholar]
- 7.Kennealey G. T., Furr B. J. A. Use of the nonsteroidal anti-androgen casodex in advanced prostatic carcinoma. Urologic Clinics of North America. 1991;18(1):99–110. [PubMed] [Google Scholar]
- 8.Blackledge G., Kolvenbag G., Nash A. Bicalutamide: a new antiandrogen for use in combination with castration for patients with advanced prostate cancer. Anti-Cancer Drugs. 1996;7(1):27–34. doi: 10.1097/00001813-199601000-00002. [DOI] [PubMed] [Google Scholar]
- 9.Tyrrell C. J., Altwein J. E., Klippel F., et al. A multicenter randomized trial comparing the luteinizing hormone-releasing hormone analogue goserelin acetate alone and with flutamide in the treatment of advanced prostate cancer. The International Prostate Cancer Study Group. Journal of Urology. 1991;146(5):1321–1326. doi: 10.1016/s0022-5347(17)38080-1. [DOI] [PubMed] [Google Scholar]
- 10.Eisenberger M. A., Blumenstein B. A., Crawford E. D., et al. Bilateral orchiectomy with or without flutamide for metastatic prostate cancer. The New England Journal of Medicine. 1998;339(15):1036–1042. doi: 10.1056/nejm199810083391504. [DOI] [PubMed] [Google Scholar]
- 11.Scher H. I., Sawyers C. L. Biology of progressive, castration-resistant prostate cancer: directed therapies targeting the androgen-receptor signaling axis. Journal of Clinical Oncology. 2005;23(32):8253–8261. doi: 10.1200/jco.2005.03.4777. [DOI] [PubMed] [Google Scholar]
- 12.Kemppainen J. A., Wilson E. M. Agonist and antagonist activities of hydroxyflutamide and casodex relate to androgen receptor stabilization. Urology. 1996;48(1):157–163. doi: 10.1016/S0090-4295(96)00117-3. [DOI] [PubMed] [Google Scholar]
- 13. http://www.oecd.org/chemicalsafety/risk-assessment/37849783.pdf.
- 14.Gramatica P., Chirico N., Papa E., Cassani S., Kovarich S. QSARINS: a new software for the development, analysis, and validation of QSAR MLR models. Journal of Computational Chemistry. 2013;34(24):2121–2132. doi: 10.1002/jcc.23361. [DOI] [Google Scholar]
- 15.Gramatica P., Cassani S., Chirico N. QSARINS-chem: insubria datasets and new QSAR/QSPR models for environmental pollutants in QSARINS. Journal of Computational Chemistry. 2014;35(13):1036–1044. doi: 10.1002/jcc.23576. [DOI] [PubMed] [Google Scholar]
- 16. http://pubchem.ncbi.nlm.nih.gov.
- 17.Tropsha A. Best practices for QSAR model development, validation, and exploitation. Molecular Informatics. 2010;29(6-7):476–488. doi: 10.1002/minf.201000061. [DOI] [PubMed] [Google Scholar]
- 18.Gramatica P., Cassani S., Roy P. P., Kovarich S., Yap C. W., Papa E. QSAR modeling is not ‘Push a button and find a correlation’: a case study of toxicity of (Benzo-)triazoles on Algae. Molecular Informatics. 2012;31(11-12):817–835. doi: 10.1002/minf.201200075. [DOI] [PubMed] [Google Scholar]
- 19.Li H., Ren X., Leblanc E., Frewin K., Rennie P. S., Cherkasov A. Identification of novel androgen receptor antagonists using structure- and ligand-based methods. Journal of Chemical Information and Modeling. 2013;53(1):123–130. doi: 10.1021/ci300514v. [DOI] [PubMed] [Google Scholar]
- 20.Tachibana K., Imaoka I., Yoshino H., et al. Discovery of 7α-substituted dihydrotestosterones as androgen receptor pure antagonists and their structure-activity relationships. Bioorganic and Medicinal Chemistry. 2007;15(1):174–185. doi: 10.1016/j.bmc.2006.09.072. [DOI] [PubMed] [Google Scholar]
- 21.Tachibana K., Imaoka I., Yoshino H., et al. Discovery and structure-activity relationships of new steroidal compounds bearing a carboxy-terminal side chain as androgen receptor pure antagonists. Bioorganic and Medicinal Chemistry Letters. 2007;17(20):5573–5576. doi: 10.1016/j.bmcl.2007.07.090. [DOI] [PubMed] [Google Scholar]
- 22.Hypercube. HyperChem 7.0. Hypercube Inc.; 2002. [Google Scholar]
- 23.Talete srl. DRAGON for Windows (Software for Molecular Descriptor Calculation), Version 5.5, 2007, http://www.talete.mi.it.
- 24.Todeschini R., Consonni V. Handbook of Molecular Descriptors. Weinheim, Germany: Wiley-VCH; 2009. [Google Scholar]
- 25.Schüürmann G., Ebert R.-U., Chen J., Wang B., Kühne R. External validation and prediction employing the predictive squared correlation coefficient—test set activity mean vs training set activity mean. Journal of Chemical Information and Modeling. 2008;48(11):2140–2145. doi: 10.1021/ci800253u. [DOI] [PubMed] [Google Scholar]
- 26.Consonni V., Ballabio D., Todeschini R. Comments on the definition of the Q2 parameter for QSAR validation. Journal of Chemical Information and Modeling. 2009;49(7):1669–1678. doi: 10.1021/ci900115y. [DOI] [PubMed] [Google Scholar]
- 27.Lin L. I.-K. A concordance correlation coefficient to evaluate reproducibility. Biometrics. 1989;45(1):255–268. doi: 10.2307/2532051. [DOI] [PubMed] [Google Scholar]
- 28.Chirico N., Gramatica P. Real external predictivity of QSAR models: how to evaluate It? Comparison of different validation criteria and proposal of using the concordance correlation coefficient. Journal of Chemical Information and Modeling. 2011;51(9):2320–2335. doi: 10.1021/ci200211n. [DOI] [PubMed] [Google Scholar]
- 29.Chirico N., Gramatica P. Real external predictivity of QSAR models. Part 2. New intercomparable thresholds for different validation criteria and the need for scatter plot inspection. Journal of Chemical Information and Modeling. 2012;52(8):2044–2058. doi: 10.1021/ci300084j. [DOI] [PubMed] [Google Scholar]
- 30.Tropsha A., Gramatica P., Gombar V. K. The importance of being earnest: validation is the absolute essential for successful application and interpretation of QSPR models. QSAR and Combinatorial Science. 2003;22(1):69–77. doi: 10.1002/qsar.200390007. [DOI] [Google Scholar]
- 31.Gramatica P. Principles of QSAR models validation: internal and external. QSAR & Combinatorial Science. 2007;26:694–701. [Google Scholar]
- 32.Discovery Studio Version 2.5. San Diego, Calif, USA: Accelrys; 2009. [Google Scholar]
- 33. http://www.rcsb.org/
- 34.Case D. A., Babin V., Berryman J. T., et al. AMBER 14. San Francisco, Calif, USA: University of California; 2014. [Google Scholar]
- 35.Liu H. L., An X. L., Li S. Y., Wang Y. W., Li J. Z., Liu H. X. Interaction mechanism exploration of R-bicalutamide/S-1 with WT/W741L AR using molecular dynamics simulations. Molecular BioSystems. 2015;11(12):3347–3354. doi: 10.1039/c5mb00499c. [DOI] [PubMed] [Google Scholar]
- 36.Tachibana K., Imaoka I., Yoshino H., et al. Discovery of 7α-substituted dihydrotestosterones as androgen receptor pure antagonists and their structure–activity relationships. Bioorganic and Medicinal Chemistry. 2007;15(1):174–185. doi: 10.1016/j.bmc.2006.09.072. [DOI] [PubMed] [Google Scholar]
- 37.Jorgensen W. L., Chandrasekhar J., Madura J. D., Impey R. W., Klein M. L. Comparison of simple potential functions for simulating liquid water. The Journal of Chemical Physics. 1983;79(2):926–935. doi: 10.1063/1.445869. [DOI] [Google Scholar]
- 38.Wang J., Wolf R. M., Caldwell J. W., Kollman P. A., Case D. A. Development and testing of a general Amber force field. Journal of Computational Chemistry. 2004;25(9):1157–1174. doi: 10.1002/jcc.20035. [DOI] [PubMed] [Google Scholar]
- 39.Jakalian A., Bush B. L., Jack D. B., Bayly C. I. Fast, efficient generation of high-quality atomic charges. AM1-BCC model: I. Method. Journal of Computational Chemistry. 2000;21(2):132–146. doi: 10.1002/(sici)1096-987x(20000130)21:2<132::aid-jcc5>3.0.co;2-p. [DOI] [PubMed] [Google Scholar]
- 40.Hou T., Wang J., Li Y., Wang W. Assessing the performance of the MM/PBSA and MM/GBSA methods. 1. The accuracy of binding free energy calculations based on molecular dynamics simulations. Journal of Chemical Information and Modeling. 2011;51(1):69–82. doi: 10.1021/ci100275a. [DOI] [PMC free article] [PubMed] [Google Scholar]
- 41.Bradbury R. H., Hales N. J., Rabow A. A., et al. Small-molecule androgen receptor downregulators as an approach to treatment of advanced prostate cancer. Bioorganic and Medicinal Chemistry Letters. 2011;21(18):5442–5445. doi: 10.1016/j.bmcl.2011.06.122. [DOI] [PubMed] [Google Scholar]
- 42.Consonni V., Todeschini R., Pavan M., Gramatica P. Structure/response correlations and similarity/diversity analysis by GETAWAY descriptors. 2. Application of the novel 3D molecular descriptors to QSAR/QSPR studies. Journal of Chemical Information and Computer Sciences. 2002;42(3):693–705. doi: 10.1021/ci0155053. [DOI] [PubMed] [Google Scholar]


