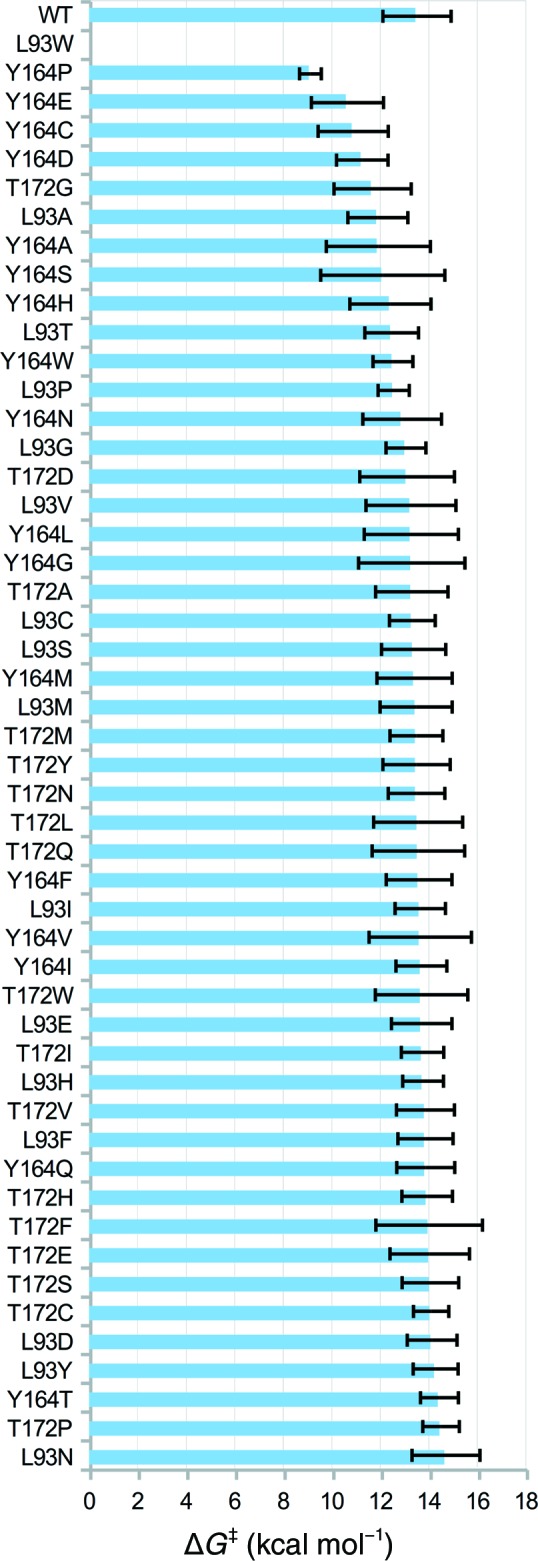
Figure 9.

Results of the separate single-site saturation mutagenesis experiments at positions 93, 164 and 172. Activation energies (ΔG ‡) are given as mean values, with error bars showing the standard deviation over 24 individual EVB simulations. The corresponding raw data are provided in Supplementary Table S4.
