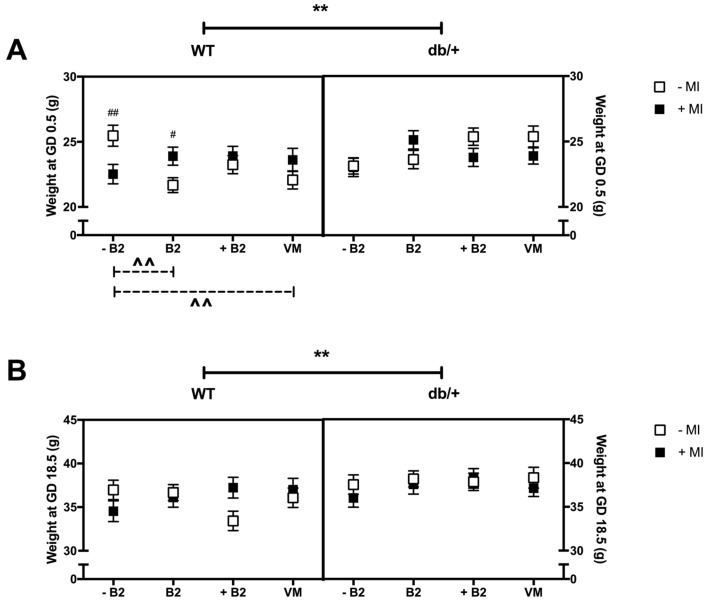
Figure 1.
(A) Body weight at GD0.5 (g). * indicates a main effect; # indicates a difference between groups with and without MI.; and ^ indicates a difference between vitamin status groups, where a dashed line indicates the difference occurs in the group without MI, and a solid line indicates that the difference occurs in the group with MI. There was a significant difference between WT and db/+ overall—indicated by ** (p = 0.017). There was also a significant difference between WT mice with and without MI in the –B2 (p = 0.008) and B2 (p = 0.015) groups—indicated by #. In addition, there was a significant difference between WT mice with suboptimal and normal B2 in the absence of MI (indicated by ^^ (p = 0.001)), and between WT with suboptimal and vitamin mix in the absence of MI (indicated by ^^ (p = 0.011)); (B) Body weight at GD18.5 (g). There was a significant difference between WT and db/+ overall—indicated by ** (p = 0.004). n = 7–12 mice per group.

