Abstract
Vitamin D receptor (VDR) deficient status has been shown to be associated with the activation of renin angiotensin system (RAS). We hypothesized that lack of VDR would enhance p53 expression in podocytes through down regulation of SIRT1; the former would enhance the transcription of angiotensinogen (Agt) and angiotensinogen II type 1 receptor (AT1R) leading to the activation of RAS. Renal tissues of VDR mutant (M) mice displayed increased expression of p53, Agt, renin, and AT1R. In vitro studies, VDR knockout podocytes not only displayed up regulation p53 but also displayed enhanced expression of Agt, renin and AT1R. VDR deficient podocytes also displayed an increase in mRNA expression for p53, Agt, renin, and AT1R. Interestingly, renal tissues of VDR-M as well as VDR heterozygous (h) mice displayed attenuated expression of deacetylase SIRT1. Renal tissues of VDR-M mice showed acetylation of p53 at lysine (K) 382 residues inferring that enhanced p53 expression in renal tissues could be the result of ongoing acetylation, a consequence of SIRT1 deficient state. Notably, podocytes lacking SIRT1 not only showed acetylation of p53 at lysine (K) 382 residues but also displayed enhanced p53 expression. Either silencing of SIRT1/VDR or treatment with high glucose enhanced podocyte PPAR-y expression, whereas, immunoprecipitation (IP) of their lysates with anti-Retinoid X receptor (RXR) antibody revealed presence of PPAR-y. It appears that either the deficit of SIRT1 has de-repressed expression of PPAR-y or enhanced podocyte expression of PPAR-y (in the absence of VDR) has contributed to the down regulation of SIRT1.
Graphical abstract
Vitamin D has been demonstrated to be a negative regulator of renin (20). Interestingly, VDR knockout mice have also been demonstrated to activate Renin Angiotensin System (RAS) without displaying a vitamin D deficient state (20). These mice developed hypertension and cardiac hypertrophy as a consequence to the activation of the RAS (31). However, levels of angiotensinogen (Agt) and AT1R mRNA were not altered in cardiac myocytes. Contrary to these findings, renal tissues of VDR knockout diabetic mice displayed enhanced renin and Agt expression (34). We hypothesized that lack of VDR would modulate the transcription of the Agt and AT1R in kidney cells of VDR knockout mice. Further, these effects of VDR deficit status could be mediated through attenuated Human Silent Information Regulator Type (SIRT) 1 resulting into enhanced p53 expression by kidney cells.
SIRT1 is a NAD+-dependent deacetylase that regulates cell phenotype including cell death/survival, senescence, and metabolism (3). It is involved in transcriptional silencing of genes by chromatin modification via histone deacetylation, DNA damage response, and life span extension secondary to caloric restriction (5, 15, 30). SIRT1 is also a repressor of nuclear receptors such as PPARy by docking with co-repressors - nuclear receptor corepressor (NCor1) and silencing mediator for retinoid or thyroid-hormone receptors (SMRT, NCor2) (21). Interestingly, SIRT1 negatively regulates p53 expression by deacetylating p53 in response to DNA damage (2, 27, 29). Conversely, elevation of cellular p53 expression enhances expression of SIRT1 as a negative feedback.
Recently, liganded VDR has been shown to modulate expression of FOXO3a target genes through deacetylation of FOXO3a via SIRT1 in SCC25 cells (4). In these studies, lack of VDR as well as SIRT1 was associated with phosphorylation of FOXO3a. In the present study, we have evaluated the effect of VDR down regulation on podocyte SIRT1 expression and associated up regulation of p53 expression.
We and other investigators previously reported the role of p53 in the transcription of angiotensinogen and AT1 receptors in cardiac myocytes in high glucose milieu (18). These effects of p53 were associated with the activation of renin angiotensin system and cardiac myocyte hypertrophy (18). However, in these studies the role of VDR and SIRT1 was not explored. We have recently reported that high glucose down regulated podocyte VDR expression both in vitro and in vivo studies (24). In these studies, high glucose-induced down regulation of VDR was associated with the activation of the RAS. However, we did not explore the role of SIRT1 and p53 in the induction of activation of the RAS in podocytes.
In the present study, we evaluated the effect of lack of VDR from the genome of kidney cells on SIRT1 expression both in vivo and in vitro studies. We delineated the involved molecular mechanisms of the activation of renin angiotensin system in podocytes lacking VDR.
Material and Methods
VDR Mutant mice
VDR tm1MBD+/- were purchased from Jackson Laboratories (Bar Harbor, Maine), and bred to develop homozygous VDR mutant (VDR-M, VDR tm1MBD+/+) mice) on FVB/N. Four week old homozygous mice displayed low serum calcium and phosphorous levels (mean serum calcium, 7.2 ± 0.8 mg/dl; mean serum phosphorous, 2.2 ± 0.3 mg/dl) on normal chow.
Human podocytes
Human podocytes (HPs) were obtained from Dr. Moin A. Saleem (Children’s renal unit and academic renal unit, University of Bristol, Southmead Hospital, Bristol, UK). Human podocytes were conditionally immortalized by introducing temperature-sensitive SV40- T antigen by transfection. The cells have additionally been transfected with a human telomerase construct. These cells proliferate at permissive temperature (33 °C, conditionally immortalized human podocytes) and enter growth arrest (conditionally immortalized differentiated human podocytes) after transfer to the non-permissive temperature (37 °C). The growth medium contains RPMI 1640 supplemented with 10% fetal bovine serum (FBS), 1x Pen-Strep, 1 mM L-glutamine and 1x ITS (Invitrogen) to promote expression of T antigen. Since incubation media being deficient (contained only 10% serum) in vitamin D, majority of podocyte VDR was unliganded.
Silencing for VDR and SIRT1
HPs were transfected with 25 nM VDR siRNA, control-siRNA (Santa Cruz Biotechnology, Santa Cruz, CA), or SIRT1 siRNA (Cell Signaling) with Siport Neofax transfection reagent and left in optiMEM media for 48 hrs. Control and transfected cells were used under control and experimental conditions.
Western blotting studies
Protein blots of control and experimental cells/renal tissues were processed as described previously (9). Nitrocellulose membranes were then processed further for immunostaining with primary antibodies against SIRT1 (anti-rabbit, Santa Cruz Biotechnology, Santa Cruz, CA), p53 (antimouse, Abcam, Cambridge, San Francisco, CA), Ack382-p53 (anti-rabbit, Abcam), angiotensinogen (anti-rabbit, Abcam), AT1R (anti-rabbit, Santa Cruz), renin (Santa Cruz), or PPAR-y (anti-rabbit, Cell Signaling, Danvers, MA) and subsequently with horseradish peroxidase (HRP) labeled appropriate secondary antibodies. The blots were developed using a chemiluminescence detection kit (PIERCE, Rockford, IL) and exposed to X-ray film (Eastman Kodak Co., Rochester, NY). Equal protein loading and the protein transfer were confirmed by immunoblotting for determination of actin protein using a polyclonal α-Actin antibody (I-19, Santa Cruz, CA) on the same (stripped) Western blots.
Reverse Transcription PCR Analysis
Control and experimental podocytes were used to quantify mRNA expression of VDR, p53, renin, Agt, AT1R, and SIRT1 as described previously (15). Quantitative PCR was carried out in an ABI Prism 7900HT sequence detection system using the primer sequences as shown below:
VDR (Human)
5 : GACTTTGACCGGAACGTGCCC -3
5: CATCATGCCGATGTCCACACA -3
Agt (Human)
F: 5-CTGCAAGGATCTTATGACCTGC-3
R: 5-TACACAGCAAACAGGAATGGGC-3
Renin (Human)
F: 5-AAATGAAGGGGGTGTCTGTGG-3
R: 5-AAGCCAATGCGGTTGTTAACGC-3
SIRT1 (Human)
F:5’-CAGGTTGCGGGAATCCAAAG-3’
R:5’-GCTGGGCACCTAGGACATCG-3’
SYBR green was used as the detector and ROX as a stabilizing dye. Results (means ± S.D.) represent number of samples as described in the legend. The data was analyzed using the Comparative CT method (ΔΔCT method). Differences in CT are used to quantify relative amount of PCR target contained within each well. The data was expressed as relative mRNA expression with reference to control, normalized to quantity RNA input by performing measurements on an endogenous reference gene, GAPDH.
Statistical analysis
For comparison of mean values between two groups, the unpaired t test was used. To compare values between multiple groups, analysis of variance (ANOVA) was applied and a Bonferroni multiple range test was used to calculate a P-value. Statistical significance was defined as P<0.05. All values are displayed as mean ± SD.
Results
Renal tissues lacking VDR display enhanced expression of p53 and activation of renin angiotensin system
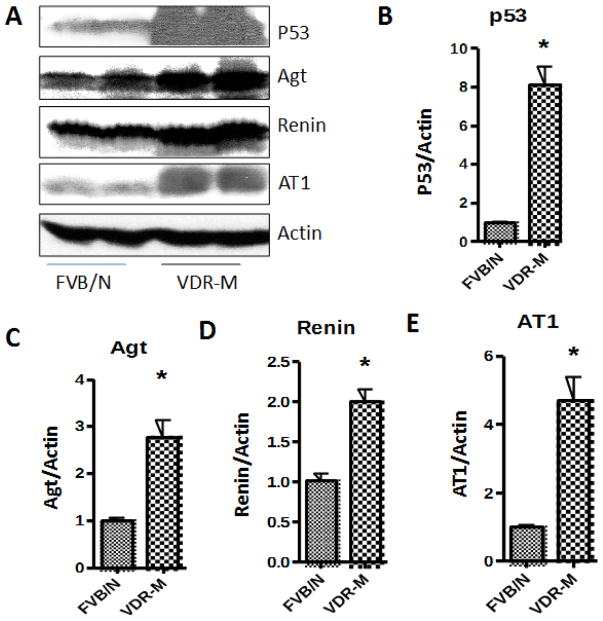
Since p53 is known to enhance cardiac myocyte expression of angiotensinogen and AT1R expression (18) we asked whether renal tissues of VDR-M would display enhanced expression of p53 and associated downstream signaling. Protein blots of renal tissues of control and VDR mutant mice were probed for p53, angiotensinogen (Agt), renin, and AT1R and reprobed for actin (n=4). Representative gels in duplicate are displayed in Fig 1A. Cumulative densitometric data (n=4) are shown as bar graphs. VDR lacking renal tissues displayed 8 fold increases in p53 expression when compared to control mice (Fig. 1B). Renal tissues from VDR mutant mice displayed 3 fold increase in Agt expression (Fig. 1C), 2 fold increase in renin expression (Fig. 1D), and 5-fold increase in AT1R expression (Fig. 1E). These findings indicate that lack of VDR in these mice is associated with an upregulation of renal tissue p53 expression leading to the activation of renin angiotensin system.
Fig. 1. Renal tissues lacking VDR display enhanced expression of p53 and activation or renin angiotensin system.
A. Protein blots of renal tissues of control (FVB/N) and VDR mutant (M) mice were probed for p53, angiotensinogen (Agt), renin, and AT1R and reprobed for actin (n=4). Representative gels in duplicate are displayed.
B. Cumulative densitometric data (n=4) of protein blots probed for p53 and actin in the form of bar graphs.
C. Mean Agt/Actin ratio of renal tissue protein blots from control and VDR-M mice (n=4).
D. Mean Renin/Actin ration of renal tissue protein blots from control VDR mutant mice (n=4)
E. Mean AT1R/Actin ratio of renal tissues from control and VDR-M mice (n=4).
*P<0.05 compared to respective FVB/N
VDR deficient podocytes display enhanced expression of p53 and activation of renin angiotensin system
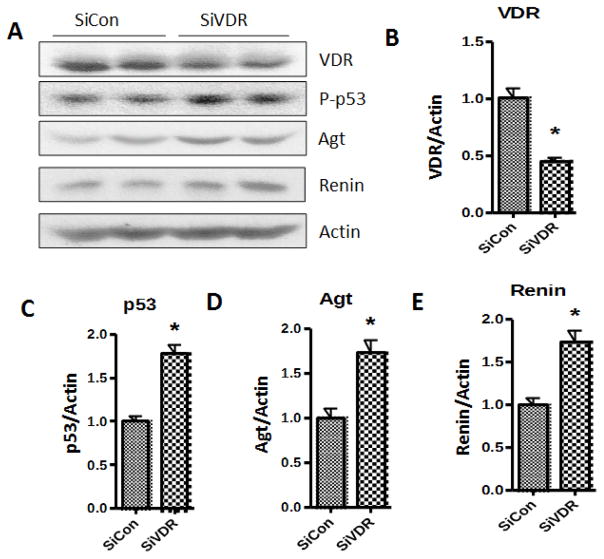
To confirm the effect of the lack of VDR on podocyte p53 expression and associated activation of the RAS, podocytes were partially silenced for VDR. Podocytes were either silenced for VDR by transfecting them with siRNA-VDR or control (scrambled)-siRNA. Protein blots of SiCon/HPs or SiVDR/HPs (n=4) were probed for p53 and then reprobed for Agt, renin, and actin. Representative gels (in duplicates) are shown in Fig. 2A. Cumulative densitometric data are shown as bar graphs. siRNA/HPs displayed down regulation of VDR expression by 50% when compared to siCon/HPs (Fig. 2B). VDR deficient podocytes showed 1.8 fold increase in their p53 expression (Fig, 2C) and similar increase in Agt (Fig. 2D) and renin (Fig 2E) expressions.
Fig. 2. VDR deficient podocytes display enhanced expression of p53 and activation of renin angiotensin system.
Podocytes were either silenced for VDR by transfecting them with siRNA-VDR (Si/VDR) or control (scrambled)-siRNA (SiCon). Protein blots of Si-Con or SiVDR (n=4) were probed for p53 and then reprobed for Agt, renin, and actin.
A. Representative gels (in duplicates) are shown.
B. Cumulative densitometric data (VDR/Actin ratios) are shown as bar graphs (n=4).
C. Mean p53/actin ratios from SiVDR and SiCon protein blots are shown as bar graphs (n=4).
D. Mean Agt/Actin ratios from SiVDR and SiCon protein blots are shown as bar graphs (n=4).
E. Mean Renin/Actin ratios SiVDR and SiCon protein blots are shown as bar graphs (n=4).
*P<0.05 compared with respective SiCon.
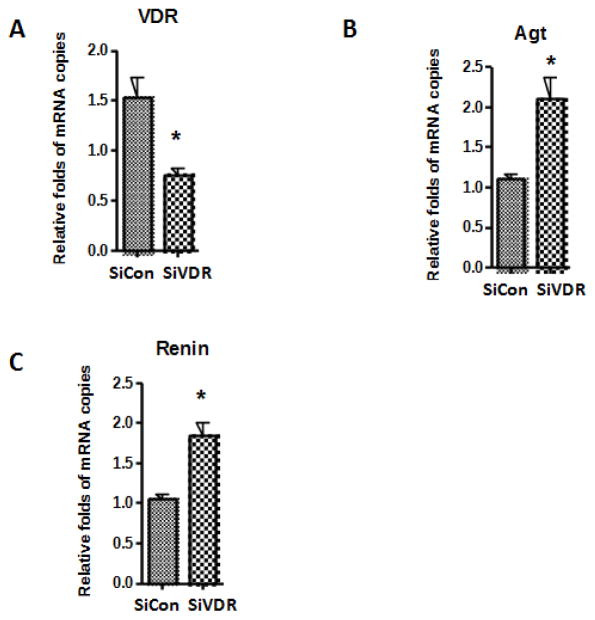
To determine the effect of podocyte VDR silencing on the transcription of VDR, p53, and molecules involved in the RAS, podocytes were transfected with either scrambled SiRNA (SiCon) or SiRNA-VDR (SiVDR). cDNAs from siCon and SiVDR were amplified with specific primers for VDR, p53, Agt and renin. Transfection of HPs with SiVDR decreased VDR expression in podocytes by 50% (Fig. 3A). This decrease in podocyte VDR transcription was associated with increased p53 transcription only by 25% (data not shown). Nonetheless there was a significant increase in p53 protein expression (Fig. 2C) in podocyte lacking VDR. Increased functionality of p53 in podocytes silenced for VDR was further confirmed by display of enhanced transrcription of both Agt (Fig. 3B) and renin (Fig. 3C) by approximately two fold.
Fig. 3. Effect of VDR silencing on podocyte Agt and renin mRNA expression.
Podocytes were transfected with either scrambled siRNA (SiCon) or siRNA-VDR (SiVDR) (n=4). cDNAs from SiCon and SiVDR were amplified with specific primers for VDR, Agt, and renin.
A. VDR mRNA expression by SiCon and SiVDR is displayed as bar graphs.
B. Agt mRNA expression by SiCon and SiVDR is displayed as bar graphs.
C. Renin mRNA expression by SiCon and SiVDR. is displayed as bar graphs. *P<0.05 vs. SiCon
Lack of VDR is associated with down regulation of SIRT1 in VDR-M mice
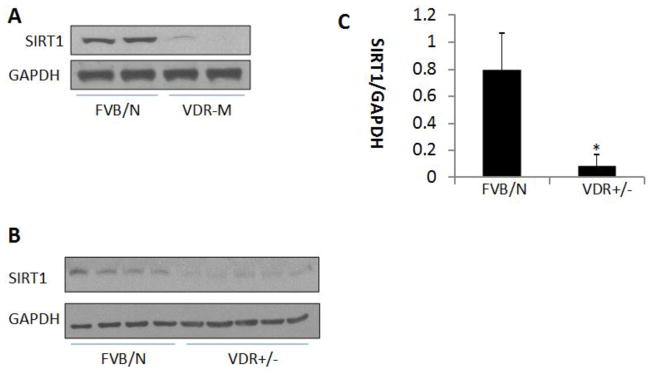
SIRT1 is a deacetylase and modulates p53 expression through deacetylation (3, 5). On that account, lack of SIRT1 has been reported to enhance p53 expression (29). We asked whether lack of VDR is associated with down regulation of SIRT1. Protein blots of renal tissues (n=4) of control and VDR-M mice were probed for SIRT1 and the same blots were reprobed for GAPDH. Representative gels are displayed in Fig. 4A. Renal tissues of VDR-M mice displayed attenuated expression of SIRT1. Since renal tissues of VDR-M mice barely displayed any expression of SIRT1, we also evaluated renal tissue SIRT1 expression in VDR-heterozygous mice (h). Protein blots of renal tissues of control (n=4) and VDR-H (n=5) were probed for SIRT1 and reprobed for GAPDH. Gels are displayed in Fig. 4B. Densitoemetric data are shown as bar graphs in Fig. 4C. Renal tissues of VDR-h mice displayed attenuated expression of SIRT1.
Fig. 4. Lack of VDR is associated with down regulation of SIRT1 in VDR-M mice.
A. Protein blots of renal tissues (n=4) of control and VDR-M mice were probed for SIRT1 and the same blots were reprobed for GAPDH. Representative gels in duplicate are shown.
B. Protein blots of renal tissues of control (n=4) and VDR-heterozygous (h) (n=5) were probed for SIRT1 and reprobed for GAPDH. Gels are displayed.
C. Densitoemetric data (SIRT1/GAPDH) of protein blots of Fig. 4B are shown as bar graph.
*P<0.05 compared with FVB/N
p53 acetylation at lysine (K) 382 residues is prevailed in renal tissues lacking VDR
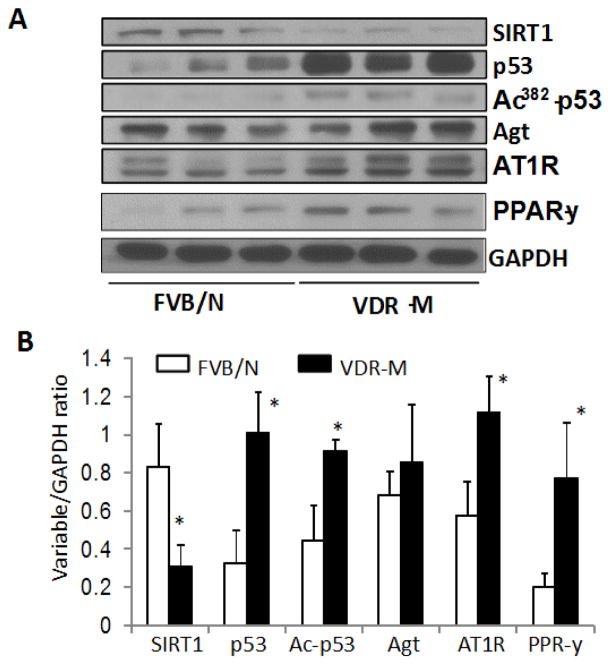
Since acetylation of p53 at K 382 residues has been shown to be associated with enhanced p53 expression, we expected lack of VDR in renal tissues would also be associated with acetylation p53 at K382 residues. Renal tissues of control (n=3) and VDR-M (n=3) were probed for SIRT1. The same blots were stripped and reprobed for p53, Ack382-p53, Agt, AT1R, PPAR-y, and GAPDH. Gels are displayed in Fig. 5A and bar graphs in Fig. 5B. Renal tissues of VDR-M mice displayed attenuated expression of SIRT1 but enhanced expression of p53 and acetylation at the 382 residue site. These findings indicate that down regulation of SIRT1 in mice lacking VDR may be enhancing p53 expression through acetylation at K382 residues. Renal tissues of VDR-M mice also displayed enhanced expression of Agt and AT1R. Interestingly, renal tissues of VDR-M mice displayed enhanced expression of PPAR-y. Since SIRT1 is a component of PARP-y repressor complex, lack of SIRT1 is likely to disrupt repressor complex (21).
Fig. 5. Relationship between VDR/SIRT1 and pp53/PPAR-y.
A. Renal tissues of control (n=3) and VDR-M (n=3) were probed for SIRT1. The same blots were stripped and reprobed for p53, Ack382-p53, Agt, AT1R, PPAR-y, and GAPDH. Gels are displayed.
B. Cumulative densitometric data (variable/GAPDH ratio) of FVB/N and VDR-M are shown.
*P<0.05 compared with respective FVB/N
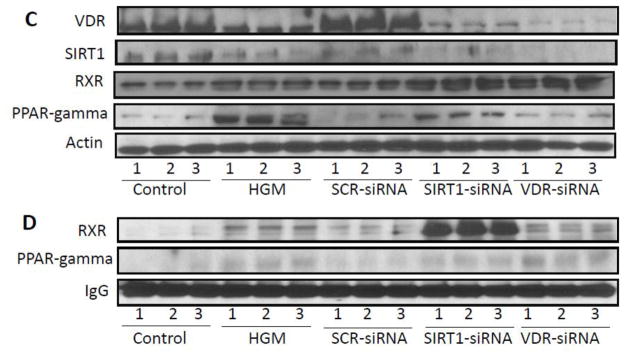
C. Protein blots of control podocytes, high glucose treated podocytes (glucose , 35 mM for 24 hours), podocytes transfected with scrambled siRNA (SCR-siRNA)/SIRT1-siRNA/VDR-siRNA (n=3) were probed for VDR and reprobed for SIRT1, PPAR- y, and actin. Gels are displayed.
D. Lysates from the protocol C, were immunoprecipitated with anti-RXR-antibody. Protein blots of IP fractions were probed for RXR and reprobed for PPAR- y. Gels are displayed.
Evaluation of relationship between PPAR-y and SIRT1/VDR
To evaluate relationship between PPAYR- y and SIRT1/VDR, protein blots of control podocytes, high glucose treated podocytes (glucose , 35 mM for 24 hours), podocytes transfected with scrambled siRNA (SCR-siRNA)/SIRT1-siRNA/VDR-siRNA (n=3) were probed for VDR and reprobed for SIRT1, PPAR- y, and actin. Gels are displayed in Fig. 5C. High glucose down regulated VDR and SIRT1 expression but enhanced expression of PPAR- y. Therefore, it is plausible that high glucose induced increase in PPAR- y might have contributed to down regulation of SIRT1 in high glucose milieu. Interestingly, cells silenced for VDR and SIRT1 also displayed mild increase in PPAR- y. In this scenario, it is likely that lack of VDR spared RXR to bind with PPAR- y.
To determine the role of RXR, lysates from the above mentioned experiment were immunoprecipitated with anti-RXR-antibody. Protein blots of IP fractions were probed for RXR and reprobed for PPAR- y. Gels are displayed in Fig. 5D . IP fractions of HGM, siRNA-VDR and siRNA-SIRT1 displayed presence of PPAR- y. These findings suggest that decrease in VDR promotes binding for RXR with PPAR- y.
Podocytes partially lacking SIRT1 from their genome display enhanced acetylation of p53 at K382 residues in podocytes
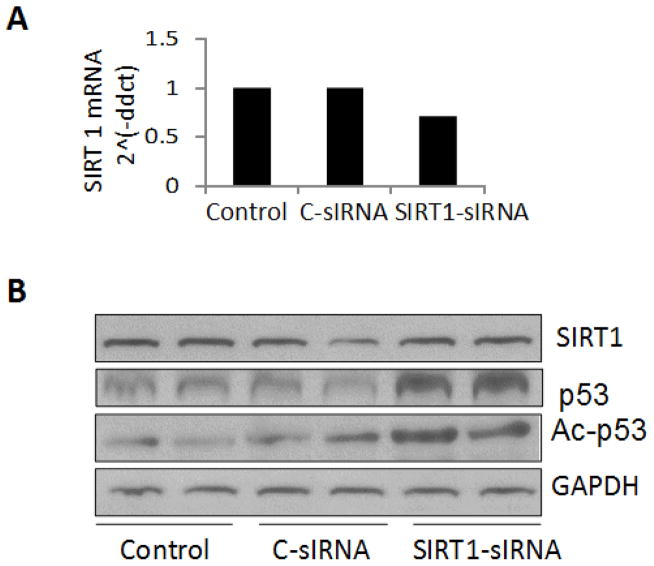
Since SIRT1 is a deacetylase, we asked whether partial deficit of SIRT1 from the genome of podocytes would enhance acetylation of p53 at K382 residues. Human podocytes were transfected with control (C )- siRNA or SIRT1-siRNA. Control cells, C-siRNA- and SIRT1-siRNA transfected cells were incubated in media for 24 hours and extracted for protein and RNA.
cDNAs were prepared and amplified with a probe specific for SIRT1. Results are displayed in Fig. 6A. Podocytes transfected with SIRT1-siRNA displayed 50% down regulation of SIRT1 mRNA expression.
Fig. 6. Podocytes partially lacking SIRT1 from their genome display enhanced acetylation of p53 at K382 residues in podocytes.
A. Human podocytes were transfected either control (C )- siRNA or SIRT1-siRNA. Control cells, C-siRNA- and SIRT1-siRNA transfected cells were incubated in media for 24 hours. Total RNA as well as proteins were harvested. cDNAs were prepared and amplified with a probe specific for SIRT1. Results are displayed as bar graph.
B. Protein blots of control (C )- siRNA or SIRT1-siRNA. Control cells, C-siRNA- and SIRT1-siRNA transfected cells were probed for SIRT1, p53, ac-K382p53, and GAPDH. Gels are displayed.
Protein blots were probed for SIRT1, p53, ac-k382p53, and GAPDH. Gels are displayed in Fig. 6B. Podocytes- transfected with SIRT1-siRNA displayed modest down regulation (30% only) of SIRT1 protein expression. Nonetheless, podocytes transfected with SIRT1-siRNA displayed both robust acetylation of p53 at K382 residues and an increased p53 protein expression. Thus, it appears that despite 50% down regulation of SIRT1 gene expression in the genome of podocytes, protein expression of SIRT1 in SIRT1-siRNA transfected podocytes was not reduced to the same magnitude. We would like to clarify this discrepancy in mRNA and protein expression of SIRT1 in these studies. Downstream signaling in the form of robust increase in p53 acetylation at K382 residues as well as abundant p53 protein expression confirmed the deficit in functionality of SIRT1 in these podocytes. We speculate that sustained increase in podocyte expression of p53 stimulated SIRT1 expression in podocytes partially lacking SIRT1 from their genome as a negative feedback. Moreover, these findings are consistent with the observations of other investigators (5, 15).
High Glucose milieu down regulates SIRT1, enhances p53 acetylation and RAS activation
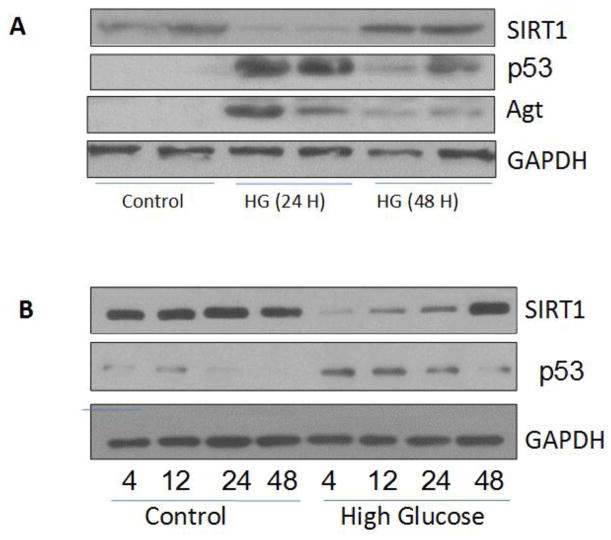
We and other investigators have previously reported down regulation of podocyte VDR expression in adverse milieus both in vitro and in vivo studies (8, 9, 25, 26, 34). We asked whether high glucose milieu would also down regulate SIRT1 and enhance podocyte p53 expression and associated downstream signals. Human podocytes were incubated in media containing either normal glucose (5 mM, control) or high glucose (35 mM) for 24 and 48 hours. Protein blots were probed for SIRT1. The same blots were reprobed for p53, Agt, and GAPDH. Gels are displayed in Fig. 7A. High glucose attenuated podocyte SIRT1 expression but enhanced expression of both p53 and Agt at 24 hours. However, after 48 hours SIRT1 expression is also up regulated when compared to 24 hours treatment. However, these findings are consistent with the other investigators indicating that in due course of time elevated levels of p53 would also enhance SIRT1 expression as a negative feedback (as mentioned above, Fig. 6B; 5, 6). Therefore, acetylation of p53 and its expression is the determinant of functionality of the SIRT1.
Fig. 7. High glucose down regulates SIRT1 in a time dependent manner.
A. Human podocytes were incubated in media containing either normal glucose (5 mM, control) or high glucose (35 mM) for 24 and 48 hours. Protein blots were probed for SIRT1. The same blots were reprobed for p53, Agt, and GAPDH. Gels are displayed.
B. Human podocytes were incubated in media containing either normal glucose (5 mM) or high glucose (35 mM) for variable time periods (4, 12, 24, and 48 hours). Protein blots were probed for SIRT1. The same blots were reprobed for p53 and GAPDH. Gels are displayed.
To determine the time course effect of high glucose on podocyte SIRT1 and p53 expression, human podocytes (HPs) were incubated in media containing either normal glucose (5 mM) or high glucose (35 mM) for variable time periods (4, 12, 24, and 48 hours). Protein blots were probed for SIRT1. The same blots were reprobed for p53 and GAPDH. Gels are displayed in Fig. 7B. High glucose down regulated SIRT1 expression up to 24 hours. However, it is normalized to some extent as a negative feedback at 48 hours. Conversely, p53 expression was upregulated up to 24 hours and then declined at 48 hours. These findings further support the involved dynamics in SIRT1 and p53 expression, which are consistent both under physiological and pathological states.
Enhanced podocyte VDR expression is associated with increased SIRT1 expression
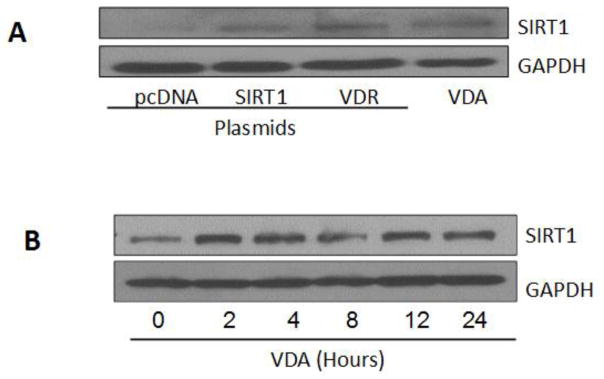
Since down regulation of VDR modulated podocyte SIRT1 expression, we expected enhanced podocyte VDR expression would be associated with enhanced SIRT1 expression. To determine the effect of enhanced podocyte VDR expression on SIRT1 expression, podocytes were transfected with control plasmid (pcDNA), SIRT1, or VDR.
In parallel sets of experiments podocytes were incubated in media containing VDR agonist (VDA, EB1089, 1 nM) for 24 hours. Protein blots were probed for SIRT1 and reprobed for GAPDH. Gels are displayed in Fig. 8A. Podocytes transfected with VDR or treated with VDA displayed enhanced expression of SIRT1.
Fig. 8. Enhanced podocyte VDR expression is associated with increased SIRT1 expression.
A. Podocytes were transfected with either control plasmid (pcDNA), SIRT1, or VDR. In parallel sets of experiments podocytes were incubated in media containing VDR agonist (VDA, EB1089, 1 nM) for 24 hours. Protein blots were probed for SIRT and reprobed for GAPDH. Gels are displayed.
B. Podocytes were incubated in media containing VDA (EB1089, 1 nM) for variable time periods (0, 2, 4, 8, 12, 24 hours). Protein blots were probed for SIRT1 and reprobed for GAPDH. Gels are displayed.
To determine the time course effect of VDA on podocyte SIRT1 expression, podocytes were incubated in media containing VDA (EB1089, 1 nM) for variable time periods (0, 2,4, 8, 12, 24 hours). Protein blots were probed for SIRT1 and reprobed for GAPDH. VDA enhanced SIRT1 expression as early as 2 hours (Fig. 8B).
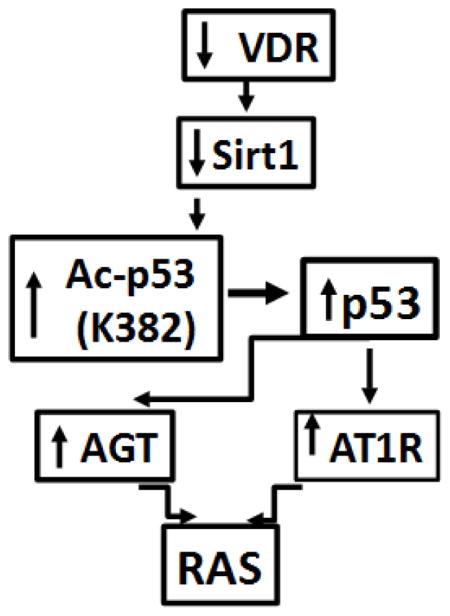
Proposed scheme depicting the role of VDR in the activation of the RAS is shown in Fig. 9. Lack of VDR in podocytes induces down regulation of SIRT1, which enhances podocyte p53 expression through allowing acetylation of p53. Enhanced p53 expression induces transcription of Agt and AT1R leading to the activation of the RAS.
Fig. 9. Proposed scheme.
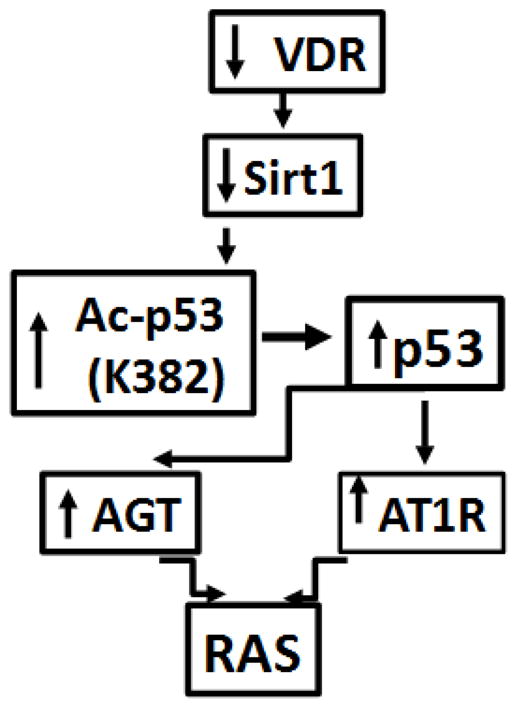
Lack of VDR in podocytes induces down regulation of SIRT1, which enhances podocyte p53 expression through allowing acetylation of p53. Enhanced p53 expression induces transcription of Agt and AT1R leading to the activation of the RAS.
Discussion
VDR knockout mice have been demonstrated to activate RAS as well as its downstream effects in the form of cardiac hypertrophy (31). It was suggested that the activation of the RAS was a consequence of disruption of vitamin D and VDR nexus (20). In the present study, we determined that lack of VDR was associated with enhanced expression of angiotensinogen and AT1 by renal tissues as well as by podocytes. This effect of VDR deficit seems to be mediated by enhanced expression of p53 both in renal tissues and podocytes. Occurrence of acetylation of p53 at K382 residues contributed to enhanced expression of p53 in renal tissues lacking SIRT1.
Recently, high Ang II states including high glucose and HIV milieus have been reported to cause down regulation of VDR in podocytes (8, 9, 25, 26, 34). High Ang II states down regulate podocyte VDR by multiple mechanisms including enhanced VDR degradation via proteasomal pathway and through transcription of CYP24A via de-repression of co-repressor complexes at CYP24A1 promoter (26). Since CYP24A1 metabolizes vitamin D, enhanced podocyte CYP24A1 state would be associated with low vitamin D which would lead to the accelerated degradation of VDR. Additionally, Ang II as well as conditions associated with high Ang II states such as high glucose and HIV milieus are associated with enhanced podocyte expression of SNAIL (19, 32); the latter is a repressor of transcription of VDR (17, 32). Knocking of VDR in kidney cells has been demonstrated to enhance the activation of renin angiotensin system (RAS) (8,9,25, 26, 34). Thus, it appears that Ang II perpetuates its production through down regulation of VDR in kidney cells.
We have previously reported that high glucose enhanced kidney cell p53 and angiotensinogen expression in podocytes (28). We and other investigators also demonstrated similar phenomenon in cardiac myocytes (18). In the present study, we asked whether high glucose induced activation of the RAS is mediated through down regulation of SIRT1 and upregulation of p53. SIRT1 is a negative regulator of p53 because of its deacetylase activity (3); conversely, p53 enhances SIRT1 expression as a negative feedback (5, 15). Because of this complex inter-relationship between these molecules, downstream functionality in the form of p53 acetylation or p53 expression seems to be a better marker of SIRT1 activity rather than to mere SIRT1 protein expression. In the present study too, podocytes partially silenced for SIRT1 displayed robust acetylation of p53 and abundant expression p53 and thus confirming a deficit in functionality of SIRT1. Since p53 was in abundance it is likely to increase expression of SIRT1 in these cells, as negative feedback. As expected, despite lack of SIRT1 in the genome of these podocytes, these cells displayed moderate SIRT1 expression. This aspect was better exemplified in time course effect of high glucose on podocyte SIRT1 expression. High glucose attenuated podocyte SIRT1 expression but enhanced p53 expression during early time period (up to 24 hours); however, at 48 hours, podocyte SIRT1 expression was up regulated and p53 expression diminished partially. These findings highlight ongoing dynamic relationship between these molecules during sustained exposure of adverse milieus.
SIRT1 protein directly interacts with PPARγ to form a complex and may thus control acetylation and deacetylation status of PPARγ (13, 23). PPARγ also binds to the promoter of SIRT1 gene and control the expression SIRT1 gene (23). Thus, both PPARγ and SIRT1 inversely regulate each other’s expression. However, the involved mechanism of SIRT1 down regulation in cells lacking VDR is not well understood to date. Both VDR and PPARγ compete for binding with RXR for their functionality (1). Therefore, PPAR-γ binding with RXR will go unchallenged in cells lacking VDR. Since PPARγ negatively regulates SIRT1 expression, it would down regulate SIR1 expression in conditioned cells lacking VDR. Additionally, SIRT1 is also a part of PPAR-y-RXR repressor complex docking on DNA binding site of PPRE (21); therefore, lack of SIRT1 would disrupt the repressor complex and de-repress the target gene expression such as PPAR-y. In the present study, renal tissues lacking VDR displayed enhanced expression of PPARy and attenuated expression of SIRT1. Therefore, it appears that PPAR-y is contributing to down regulation of SIRT1 expression in podocytes lacking VDR as well as lack of SIRT1 is de-repressing the expression of PPAR-y.
p53 is normally maintained at a low concentration in quiescent cells by continuous ubiquitination and proteasome-mediated degradation (6). However, p53 expression gets up regulated in cells under stress because of suppression of p53 ubiquitination and enhancement of p53 acetylation. Under stress, SIRT1, a deacetylator of p53 is destabilized and degraded via proteasomal pathway (7). Reduction of deacetylation of p53 leads to the acetylation of p53 (33). On the other hand, up regulation of SIRT1 inactivates p53 (3, 5). In the present study, renal tissues of VDR mutant mice as well as VDR-silenced podocytes displayed enhanced expression of podocyte p53. Since lack of VDR in renal tissues was not only associated with down regulation of SIRT1 but was also associated with acetylation of p53 at 382 residues of renal tissues, it is likely upregulation of p53 expression was contributed by lack of SIRT1 to some extent.
Deficiency of vitamin D has been incriminated a variety of chronic diseases including tuberculosis (16), HIV (10), hypertension (12), colon cancer (11) and chronic kidney diseases (22). However, outcome of clinical trials of vitamin D therapy in clinical trials of disease has not shown very promising data (14). Since vitamin D worked through VDR, functionality of vitamin D could be better be monitored by VDR status. It has been shown in patients of colon cancer that vitamin D receptor could not be optimally raised with vitamin D therapy in several instances and these patients did not respond to vitamin D therapy (17). We have recently reported that HIV down regulated podocyte VDR expression thorough CpG methylation at VDR promoter (8). In these studies, Vitamin D could not up regulate podocyte VDR expression optimally; however, use of a demethylating agent in combination with vitamin D could optimally increase podocyte VDR expression in HIV milieu (8). We propose that discrepancy in vitamin D clinical trials may be related to the inability of vitamin D in upregulating VDR optimally because of the down regulation as a consequence of epigenetics. It will be worth investing this aspect of investigation in future studies.
Vitamin D has been reported to be a negative endocrine regulator of renin transcription (20). This effect of vitamin D has been attributed to liganded-VDR which blocks the binding of CRP binding protein (CBP) at renin promoter and thus preventing the transcription of renin. On that account, vitamin D is being used to down regulate renin angiotensin system in patients of chronic kidney diseases (22). In the present study, we observed that lack of unliganded- VDR enhances transcription of several molecules involved in the activation of the RAS. During vitamin D deficient state, there is a reduction of total VDR because of decreased transcription of VDR and enhanced degradation of unliganded VDR (See Scheme in Fig. 10). Thus, vitamin D deficient status is associated with a decrease in both unliganded (UL) and liganded (L) VDR. In this scenario, lack of liganded VDR would sustain the transcription of renin, whereas, lack of unliganded VDR would enhance transcription of angiotensinogen and AT1R via modulation of p53 expression. Theoretically, unliganded VDR-induced AT1R activation should down regulate renin gene expression; however, this negative feedback effect of AT1R activation is likely be nullified or neutralized because of deficient liganded VDR mediated-enhanced renin transcription. Thus, it appears that lack of VDR or VDR deficient state has multiple ways to activate the RAS.
Fig. 10.
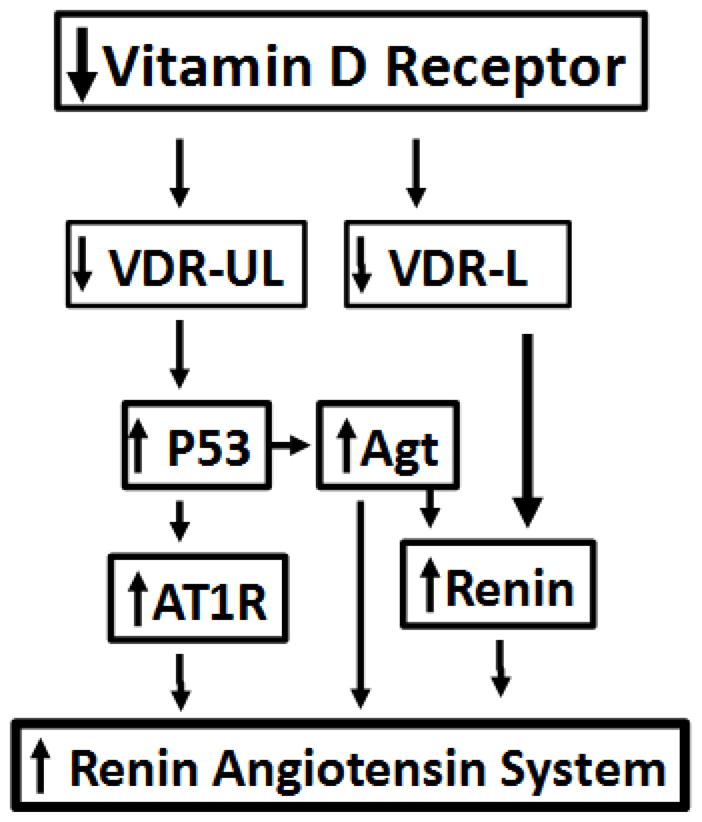
Lack of VDR and activation of the RAS
In conclusion, we report for the first time that lack of VDR in the genome kidney cells enhances expression of p53 via down regulation of SIRT1 resulting into enhanced transcription of Agt and AT1R that further leads to the activation of the RAS.
Highlights.
Renal tissues of VDR mutant (M) mice displayed enhanced expression of p53, renin, angiotensinogen and AT1R
Renal tissues of VDR-M mice showed down regulation of SIRT1 but enhanced expression of p53
Podocytes lacking SIRT1 showed acetylation of p53 at lysine (k) 382 residues as well as enhanced p53 expression
VDR deficit activates the Renin Angiotensin System via SIRT1 modulation.
Acknowledgments
This work was supported by grant RO1DK084910, RO1 DK083931, and 1R01DK098074 (PCS) from National Institutes of Health, Bethesda, MD.
Footnotes
Publisher's Disclaimer: This is a PDF file of an unedited manuscript that has been accepted for publication. As a service to our customers we are providing this early version of the manuscript. The manuscript will undergo copyediting, typesetting, and review of the resulting proof before it is published in its final citable form. Please note that during the production process errors may be discovered which could affect the content, and all legal disclaimers that apply to the journal pertain.
References
- 1.Alimirah F, Peng X, Yuan L, Mehta RR, von Knethen A, Choubey D, Mehta RG. Crosstalk between the peroxisome proliferator-activated receptor γ (PPARγ) and the vitamin D receptor (VDR) in human breast cancer cells: PPARγ binds to VDR and inhibits 1α,25-dihydroxyvitamin D3 mediated transactivation. Exp Cell Res. 2012;318(19):2490–7. doi: 10.1016/j.yexcr.2012.07.020. [DOI] [PubMed] [Google Scholar]
- 2.Appella E, Anderson CW. Post-translational modifications and activation of p53 by genotoxic stresses. Eur J Biochem. 2001;268:2764–2772. doi: 10.1046/j.1432-1327.2001.02225.x. [DOI] [PubMed] [Google Scholar]
- 3.Araki T, Sasaki Y, Milbrandt J. Increased nuclear NAD biosynthesis and SIRT1 activation prevent axonal degeneration. Science. 2004;305:1010–1013. doi: 10.1126/science.1098014. [DOI] [PubMed] [Google Scholar]
- 4.An Beum-Soo, Tavera-Mendoza Luz E, Dimitrov Vassil, Wang Xiaofeng, Calderon Mario R, Wang Hui-Jun, White John H. Stimulation of Sirt1-egulated FoxO Protein Function by the Ligand-Bound Vitamin D Receptor. Mol Cell Biol. 2010 Oct;30(20):4890–4900. doi: 10.1128/MCB.00180-10. [DOI] [PMC free article] [PubMed] [Google Scholar]
- 5.Brooks CL, Gu W. How does SIRT1 affect metabolism, senescence and cancer. Nat Rev Cancer. 2009;9:123–128. doi: 10.1038/nrc2562. [DOI] [PMC free article] [PubMed] [Google Scholar]
- 6.Brooks CL, Gu W. Ubiquitination, phosphorylation and acetylation: the molecular basis for p53 regulation. Curr Opin Cell Biol. 2003;15:164–171. doi: 10.1016/s0955-0674(03)00003-6. [DOI] [PubMed] [Google Scholar]
- 7.Caito S, Rajendrasozhan S, Cook S, Chung S, Yao H, Friedman AE, Brookes PS, Rahman I. SIRT1 is a redox-sensitive deacetylase that is post-translationally modified by oxidants and carbonyl stress. FASEB J. 2010;24(9):3145–3159. doi: 10.1096/fj.09-151308. [DOI] [PMC free article] [PubMed] [Google Scholar]
- 8.Chandel N, Ayasolla KS, Lan X, Sultana-Syed M, Chawla A, Lederman R, Vethantham V, Saleem MA, Chander PN, Malhotra A, Singhal PC. Epigenetic Modulation of Human Podocyte Vitamin D Receptor in HIV Milieu. J Mol Biol. 2015;427(20):3201–15. doi: 10.1016/j.jmb.2015.07.011. [DOI] [PMC free article] [PubMed] [Google Scholar]
- 9.Chandel N, Sharma B, Husain M, Salhan D, Singh T, Rai P, Mathieson PW, Saleem MA, Malhotra A, Singhal PC. HIV compromises integrity of the podocyte actin cytoskeleton through downregulation of the vitamin D receptor. Am J Physiol Renal Physiol. 2013;304:F1347–57. doi: 10.1152/ajprenal.00717.2012. [DOI] [PMC free article] [PubMed] [Google Scholar]
- 10.Eckard AS, McComsey GA. Vitamin D Deficiency and Altered Bone Mineral Metabolism in HIV-infected Individuals. Curr HIV/AIDS Rep. 2014;11(3):263–270. doi: 10.1007/s11904-014-0218-8. [DOI] [PMC free article] [PubMed] [Google Scholar]
- 11.Fiscella K, Winters P, Tancredi D, Hendren S, Franks P. Racial disparity in death from colorectal cancer: does vitamin D deficiency contribute? Cancer. 2011;117:1061–9. doi: 10.1002/cncr.25647. [DOI] [PMC free article] [PubMed] [Google Scholar]
- 12.Forman JP, Giovannucci E, Holmes MD, Bischoff-Ferrari HA, Tworoger SS, Willett WC, Curhan GC. Plasma 25-hydroxyvitamin D levels and risk of incident hypertension. Hypertension. 2007;49:1063–1069. doi: 10.1161/HYPERTENSIONAHA.107.087288. [DOI] [PubMed] [Google Scholar]
- 13.Han L, Zhou R, Niu J, McNutt MA, Wang P, Tong T. SIRT1 is regulated by a PPAR{γ}-SIRT1 negative feedback loop associated with senescence. Nucleic Acids Res. 2010;38(21):7458–71. doi: 10.1093/nar/gkq609. [DOI] [PMC free article] [PubMed] [Google Scholar]
- 14.Hossein-nezhad A, Holick MF. Vitamin D for Health: A Global Perspective. Mayo Clin Proc. 2013;88(7):720–755. doi: 10.1016/j.mayocp.2013.05.011. [DOI] [PMC free article] [PubMed] [Google Scholar]
- 15.Imai S, Johnson FB, Marciniak RA, McVey M, Park PU, Guarente L. Sir2: an NAD-dependent histone deacetylase that connects chromatin silencing, metabolism, and aging, Cold Spring Harb. Symp Quant Biol. 2000;65:297–302. doi: 10.1101/sqb.2000.65.297. [DOI] [PubMed] [Google Scholar]
- 16.Jaganath D, Mupere E. Childhood Tuberculosis and Malnutrition. J Infect Dis. 2012 Dec 15;206(12):1809–1815. doi: 10.1093/infdis/jis608. [DOI] [PMC free article] [PubMed] [Google Scholar]
- 17.Larriba MJ, Bonilla F, Muñoz A. The transcription factors Snail1 and Snail2 repress vitamin D receptor during colon cancer progression. J Steroid Biochem Mol Biol. 2010;121(1–2):106–9. doi: 10.1016/j.jsbmb.2010.01.014. [DOI] [PubMed] [Google Scholar]
- 18.Leri A, Liu Y, Li B, Fiordaliso F, Malhotra A, Latini R, Kajstura J, Anversa P. Up-Regulation of AT1 and AT2 Receptors in Postinfarcted ypertrophied Myocytes and Stretch-Mediated Apoptotic Cell Death. Am J Pathol. 2000 May;156(5):1663–72. doi: 10.1016/S0002-9440(10)65037-7. [DOI] [PMC free article] [PubMed] [Google Scholar]
- 19.Li C, Siragy HM. High glucose induces podocyte injury via enhanced (pro)renin receptor-Wnt-β-catenin-snail signaling pathway. PLoS One. 2014;9(2):e89233. doi: 10.1371/journal.pone.0089233. [DOI] [PMC free article] [PubMed] [Google Scholar]
- 20.Li YC, Kong J, Wei M, Chen ZF, Liu SQ, Cao LP. 1,25-Dihydroxyvitamin D(3) is a negative endocrine regulator of the renin-angiotensin system. J Clin Invest. 2002;110(2):229–38. doi: 10.1172/JCI15219. [DOI] [PMC free article] [PubMed] [Google Scholar]
- 21.Mottis A, Mouchiroud L, Auwerx J. Emerging roles of the corepressors NCoR1 and SMRT in homeostasis. Genes Dev. 2013;27(8):819–835. doi: 10.1101/gad.214023.113. [DOI] [PMC free article] [PubMed] [Google Scholar]
- 22.Patel T, Singh AK. Role of Vitamin D in Chronic Kidney Disease. Semin Nephrol. 2009;29(2):113–121. doi: 10.1016/j.semnephrol.2009.01.004. [DOI] [PMC free article] [PubMed] [Google Scholar]
- 23.Qiang L, Wang L, Kon N, Zhao W, Lee S, Zhang Y, Rosenbaum M, Zhao Y, Gu W, Farmer SR, Accili D. Brown remodeling of white adipose tissue by SirT1-dependent deacetylation of PPAR-y. Cell. 2012;150(3):620–32. doi: 10.1016/j.cell.2012.06.027. [DOI] [PMC free article] [PubMed] [Google Scholar]
- 24.Rai P, Singh T, Lederman R, Chawla A, Kumar D, Cheng K, Valecha G, Mathieson PW, Saleem MA, Malhotra A, Singhal PC. Hyperglycemia enhances kidney cell injury in HIVAN through down-regulation of vitamin D receptors. Cell Signal. 2015 Mar;27(3):460–9. doi: 10.1016/j.cellsig.2014.12.011. [DOI] [PMC free article] [PubMed] [Google Scholar]
- 25.Salhan D, Husain M, Subrati A, Goyal R, Singh T, Rai P, Malhotra A, Singhal PC. HIV-induced kidney cell injury: role of ROS-induced downregulated vitamin D receptor. Am J Physiol Renal Physiol. 2012;303:F503–14. doi: 10.1152/ajprenal.00170.2012. [DOI] [PMC free article] [PubMed] [Google Scholar]
- 26.Singh T, Ayasolla K, Rai P, Chandel N, Haque S, Lederman R, Husain M, Vethantham V, Chawla A, Vashistha H, Saleem MA, Ding G, Chander PN, Malhotra A, Meggs LG, Singhal PC. AT1R blockade in adverse milieus: role of SMRT and corepressor complexes. Am J Physiol Renal Physiol. 2015;309(3):F189–203. doi: 10.1152/ajprenal.00476.2014. [DOI] [PMC free article] [PubMed] [Google Scholar]
- 27.Tang Y, Zhao W, Chen Y, Zhao Y, Gu W. Acetylation is indispensable for p53 activation. Cell. 2008;133:612–626. doi: 10.1016/j.cell.2008.03.025. [DOI] [PMC free article] [PubMed] [Google Scholar]; Am J Pathol. 2000;156:1663–1672. doi: 10.1016/S0002-9440(10)65037-7. [DOI] [PMC free article] [PubMed] [Google Scholar]
- 28.Vashistha H, Singhal PC, Malhotra A, Husain M, Mathieson P, Saleem MA, Kuriakose C, Seshan S, Wilk A, Delvalle L, Peruzzi F, Giorgio M, Pelicci PG, Smithies O, Kim HS, Kakoki M, Reiss K, Meggs LG. Null mutations at the p66 and bradykinin 2 receptor loci induce divergent phenotypes in the diabetic kidney. Am J Physiol Renal Physiol. 2012;303(12):F1629–40. doi: 10.1152/ajprenal.00246.2012. [DOI] [PMC free article] [PubMed] [Google Scholar]
- 29.Vaziri H, Dessain SK, Ng Eaton E, Imai SI, Frye RA, Pandita TK, Guarente L, Weinberg RA. hSIR2(SIRT1) functions as an NAD-dependent p53 deacetylase. Cell. 2001;107:149–159. doi: 10.1016/s0092-8674(01)00527-x. [DOI] [PubMed] [Google Scholar]
- 30.Wang R, Sengupta K, Li C, Kim H, Cao L, Xiao C, Kim S, Xu X, Zheng Y, Chilton B, Jia R, Zheng Z, Appella E, Wang XW, Ried T, Deng C. Impaired DNA damage response, genome instability, and tumorigenesis in SIRT1 mutant mice. Cancer Cell. 2008;14:312–323. doi: 10.1016/j.ccr.2008.09.001. [DOI] [PMC free article] [PubMed] [Google Scholar]
- 31.Wang R, Sengupta K, Li C, Kim H, Cao L, Xiao C, Kim S, Xu X, Zheng Y, Chilton B, Jia R, Zheng Z, Appella E, Wang XW, Ried T, Deng C. Impaired DNA damage response, genome instability, and tumorigenesis in SIRT1 mutant mice. Cancer Cell. 2008;14:312–323. doi: 10.1016/j.ccr.2008.09.001. [DOI] [PMC free article] [PubMed] [Google Scholar]
- 32.Yang H, Zhang Y, Zhou Z, Jiang X, Shen A. Snail-1 regulates VDR signaling and inhibits 1,25(OH)-D3 action in osteosarcoma. Eur J Pharmacol. 2011;670(2–3):341–6. doi: 10.1016/j.ejphar.2011.09.160. [DOI] [PubMed] [Google Scholar]
- 33.Yi J, Luo J. SIRT1 and p53, effect on cancer, senescence and beyond. Biochim Biophys Acta. 2010;1804(8):1684–1689. doi: 10.1016/j.bbapap.2010.05.002. [DOI] [PMC free article] [PubMed] [Google Scholar]
- 34.Zhang Z, Sun L, Wang Y, Ning G, Minto AW, Kong J, Quigg RJ, Li YC. Renoprotective role of the vitamin D receptor in diabetic nephropathy. Kidney Int. 2008 Jan;73(2):163–71. doi: 10.1038/sj.ki.5002572. [DOI] [PubMed] [Google Scholar]


