Abstract
Targeted genome editing via engineered nucleases is an exciting area of biomedical research and holds potential for clinical applications. Despite rapid advances in the field, in vivo targeted transgene integration is still infeasible because current tools are inefficient1, especially for non-dividing cells, which compose most adult tissues. This poses a barrier for uncovering fundamental biological principles and developing treatments for a broad range of genetic disorders2. Based on clustered regularly interspaced short palindromic repeat/Cas9 (CRISPR/Cas9)3,4 technology, here we devise a homology-independent targeted integration (HITI) strategy, which allows for robust DNA knock-in in both dividing and non-dividing cells in vitro and, more importantly, in vivo (for example, in neurons of postnatal mammals). As a proof of concept of its therapeutic potential, we demonstrate the efficacy of HITI in improving visual function using a rat model of the retinal degeneration condition retinitis pigmentosa. The HITI method presented here establishes new avenues for basic research and targeted gene therapies.
Site-specific transgene integration is typically achieved by the homology-directed repair (HDR) pathway including short-fragment homologous recombination (SFHR)5–7, which is inefficient and not readily accessible to non-dividing cells8. By contrast, non-homologous end joining (NHEJ), the other major double strand break (DSB) repair pathway, is active in both proliferating and post-mitotic cells2, and is generally more efficient than HDR in mammalian species9. Although mostly recognized as error-prone and used for generating targeted gene knockouts, studies have also demonstrated the intrinsic precision of NHEJ repair10, which was successfully harnessed for gene knock-ins11,12. Regardless, however, NHEJ-mediated targeted transgene integration in post-mitotic cells has yet to be determined, especially in vivo in adult tissues such as the brain.
We aim to develop a robust NHEJ-based homology-independent strategy for targeted integration of transgenes in both dividing and non-dividing cells. First, we sought to improve upon existing NHEJ-based methods11,12 for more robust knock-in compared with HDR- and micro-homology-mediated end-joining (MMEJ)-based methods13 using CRISPR/Cas9. To evaluate knock-in efficiencies we generated a GFP-correction HEK293 line (Fig. 1a). The absolute knock-in efficiencies via HDR, MMEJ-mediated targeted integration (precise integration into target chromosome (PITCh))13, or NHEJ-mediated targeted integration (designated herein as homology-independent targeted integration, or HITI) (Extended Data Fig. 1a), were presented as percentages of GFP+ or mCherry+ cells (Fig. 1a, b). We observed little to no knock-in events when using genome cut only (IRESmChery-0c) and donor DNA cut only (IRESmCherry-MC-scramble) control donors (Fig. 1a, b and Extended Data Fig. 1b, c). Notably, we observed higher knock-in efficiency with HITI donors (IRESmCherry-1c, -2c and -MC; see below for definitions) than with an HDR donor (truncated GFP (tGFP) and IRESmCherry-HDR-0c), a PITCh donor (IRESmCherry-MH) or a HITI donor with homology arms (IRESmCherry-HDR-2c). Consistent with previous observations, inserted DNA devoid of bacterial backbone (IRESmCherry-2c and IRESmCherry-MC) resulted in less pronounced transgene silencing than DNA carrying bacterial sequences (IRESmCherry-1c) (Extended Data Fig. 1d–f)14,15. Treatment with the NHEJ inhibitor NU7026 significantly decreased HITI efficiency, confirming the dependence of HITI on the NHEJ repair machinery (Extended Data Fig. 1g).
Figure 1. HITI-mediated in vitro genome editing.
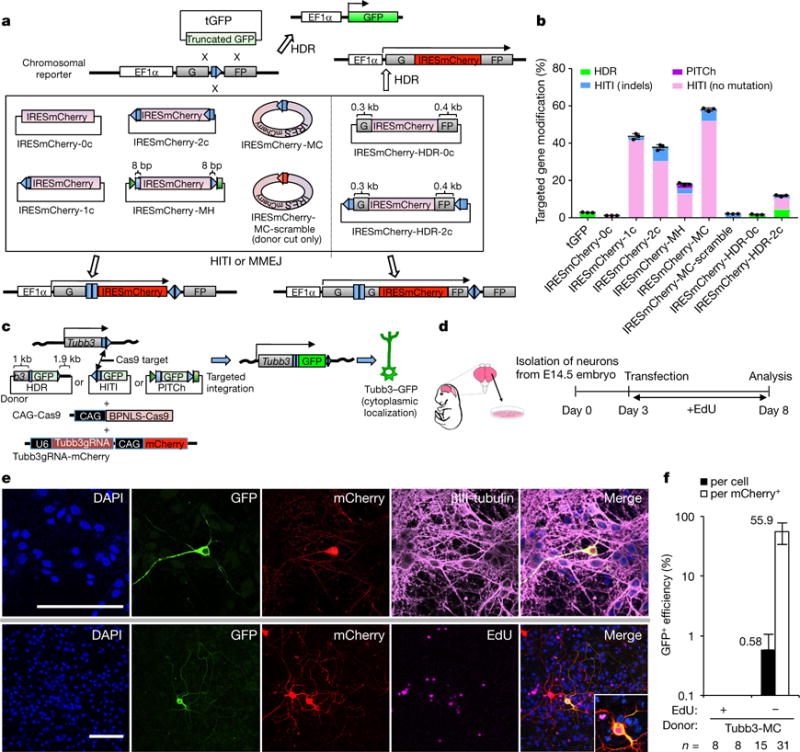
a, Schematic of gene targeting by HDR, PITCh, or HITI in the GFP-correction HEK293 line. Blue pentagon, Cas9/gRNA target sequence. Black line within blue pentagon, Cas9 cleavage site. HITI donors: IRESmCherry-0c, IRESmCherry-1c, IRESmCherry-2c or IRESmCherry-MC. HDR-donors: tGFP and IRESmCherry-HDR-0c. A PITCh-donor: IRESmCherry-MH. The green square and triangle, CRISPR/Cas9 target sites to create 8-bp microhomology at both ends of the IRESmCherry cassette. HDR and HITI dual donors: IRESmCherry-HDR-2c. Genome cut-only control donor: IRESmCherry-0c. Donor cut-only control donor: IRESmCherry-MC-scramble. Red pentagon, Scramble-gRNA target sequence. b, Gene targeting efficiency by HDR, PITCh, or HITI (with or without indels at junction sites). Results were obtained from three replicate wells and presented as mean ± s.d. The input data points were shown as black dots. c, Schematic of targeted GFP knock-in by HDR, PITCh, or HITI in cultured primary neurons. d, Experimental scheme for GFP knock-in in cultured primary neurons. e, Representative immunofluorescence images of neurons transfected with Tubb3-GFP HITI constructs: BPNLS-Cas9, Tubb3gRNA-mCherry, and Tubb3-MC plasmids. Inset, higher magnification image. Scale bar, 100 μm. f, Targeted GFP knock-in efficiencies indicated by percentage of GFP+ cells among transfected cells (mCherry+) or all cells (DAPI+) in EdU+ or EdU− neurons. n, technical replicates. Results were presented as mean ± s.d. For source data, see Supplementary Table 1.
HITI is expected to occur more frequently in the forward than the reverse direction as an intact guide RNA (gRNA) target sequence remains in the latter, which is subjected to additional Cas9 cutting until forward transgene insertion or insertions and deletions (indels) occur that prevent further gRNA binding (Extended Data Fig. 1a). Indeed, we only found 1 in 48 mCherry− single-cell-derived clones showed reverse integration (Extended Data Fig. 2a). Notably, the majority of forward knock-in did not exhibit indels (Fig. 1b and Extended Data Fig. 2b–g). The GFP-correction HEK293 line contains five copies of the target site per cell. Next we sequenced all the target sites of mCherry+ and mCherry− single-cell clones (Extended Data Fig. 2h). Among 13 mCherry+ single-cell clones analysed, we observed 1–3 knock-in events per clone and the rest of the genomic targets all contained indels. By contrast, 22 of 24 mCherry− single-cell clones showed intact target sequences. The remaining two mCherry− clones showed either indels or reverse integration at all target sites.
To further enhance Cas9 activity and HITI editing, we tested fusing Cas9 to different nuclear localization signals (NLS) and found the bipartite SV40NLS or BPNLS16 was superior to SV40NLS4 in Cas9 nuclear targeting and genome editing (Extended Data Fig. 3).
Next we tested HITI in non-dividing cells in vitro. To this end we transfected cultured mouse primary neurons with HITI constructs designed to insert a GFP cassette downstream of the Tubb3 gene, which would result in the expression of a TUBB3-GFP fusion protein localized to the cytoplasm17. We used EdU to label proliferating cells. Five days post-transfection we observed many neurons with GFP signal co-localized with βIII-tubulin/Tuj 1 (Fig. 1c–e) and were EdU-negative, indicating successful HITI-mediated GFP knock-in to the Tubb3 locus in post-mitotic neurons (Fig. 1f and Extended Data Fig. 4a, b). The percentage of GFP+ cells was 0.58% of total cell population (GFP+/DAPI+, absolute efficiency) and 55.9% of transfected cells (GFP+/mCherry+, relative efficiency), respectively.
We compared relative knock-in efficiencies in transfected neurons with an HDR (Tubb3-HDR), a PITCh (Tubb3-MH), and four different HITI donor plasmids (1-cut (Tubb3-1c), 2-cut (Tubb3-2c), 2-cut No-polyA (Tubb3-2cd), and minicircle (Tubb3-MC)) (Extended Data Fig. 4c). We observed little to no knock-ins with donor DNA cut-only control (Tubb3-MC-scramble), HDR (Tubb3-HDR), and PITCh (Tubb3-MH) vectors. By contrast, all HITI vectors allowed efficient GFP knock-in in non-dividing primary neurons. For the 2-cut No-polyA and minicircle donors, the GFP signal was almost exclusively found in the cytoplasm, while 1-cut and 2-cut donors often resulted in mis-localized GFP signals (Extended Data Fig. 4d, e), probably due to the presence of bacterial backbone and/or polyA sequences. Consistent with our observations in HEK293 cells, the majority of knock-in neurons (GFP+) did not show indels and we observed a better knock-in efficiency with BPNLS than SV40NLS (Extended Data Fig. 4f—i and Extended Data Fig. 5a). Furthermore, HITI also allowed knock-in of GFP to the TUBB3 locus in human embryonic stem cell (ES cell)-derived pan neurons (Extended Data Fig. 5b–e).
We next tested HITI in vivo using live rodents. We first delivered Tubb3-GFP HITI constructs to E15.5 mouse brain via in utero electroporation18. Three weeks after birth, we observed that up to 16.8% of electroporated cells (GFP+/mCherry+, relative efficiency) showed cytoplasmic GFP expression (Fig. 2a–c and Extended Data Fig. 5f). Owing to low efficiency of DNA delivery via in utero electroporation (around 1%), the absolute knock-in efficiency (GFP+/DAPI+) to the somatosensory cortex was less than 0.2%. To demonstrate the efficacy of HITI in post-mitotic cells in vivo, we generated inducible Tubb3-GFP HITI targeting constructs where Cre-dependent Cas9 expression is under the control of tamoxifen (TAM). Following in utero electroporation of E15.5 fetal brain we induced Cas9 expression via TAM treatment at postnatal day (P)10 and P11, at which stage most, if not all, dividing neural progenitors have differentiated into post-mitotic neurons19 (Extended Data Fig. 5g). Our results revealed efficient GFP knock-in with the HITI donor and minimal knock-in with the HDR donor (Tubb3-HDR) (Extended Data Fig. 5h, i). Similar results were obtained for other tissues, such as muscle and kidney, where non-viral delivery was used for HITI constructs that target GFP to the Rosa26 locus downstream of the CAG promoter in Ai14 mice20 (Extended Data Fig. 6). Together, these results demonstrate the utility of HITI for transgene knock-in in a variety of somatic tissues, including non-dividing cells, in vivo.
Figure 2. HITI-mediated in vivo genome editing in neurons.
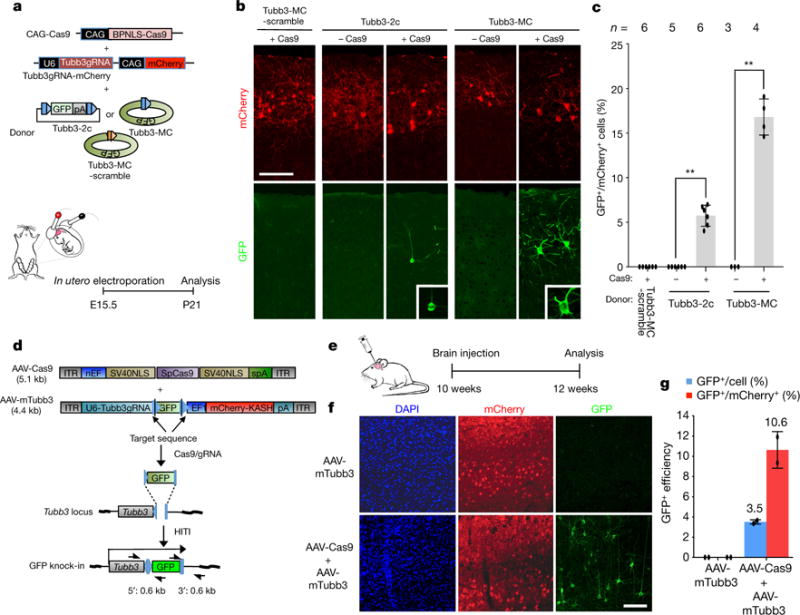
a, Schematic of targeted GFP knock-in by HITI in fetal brain via in utero electroporation. b, Representative immunofluorescence images of neurons showing correct GFP knock-in at the Tubb3 locus. Insets, higher magnification images. Scale bar, 100 μm. mCherry, transfected cells. c, Relative knock-in efficiency measured by the percentage of GFP+ cells among mCherry+ cells. n, number of pups obtained from two pregnant mice. Results were presented as mean ± s.d. The input data points were shown as black dots. **P < 0.01, unpaired Student’s t-test. d, Schematic of HITI-AAV vectors for knock-in GFP to the downstream of Tubb3 gene. Black half-arrows, PCR primers. e, Schematic of in vivo HITI via local AAV injections in adult mouse brain. f, Representative immunofluorescence images of neurons in HITI-AAV injected brain sections. Scale bar, 100 μm. g, Relative and absolute knock-in efficiencies measured by the percentage of GFP+ cells among mCherry+ cells or all DAPI+ cells, respectively. Results were obtained from two animals and presented as mean ± s.d. The input data points were shown as black dots. For source data, see Supplementary Table 2.
For in vivo applications, adeno-associated virus (AAV) vectors have been the delivery method of choice and have shown evidence of efficacy in humans21–23. Thus, to further improve in vivo HITI efficiency and utility further, we sub-cloned HITI constructs into two AAV vectors and packaged both AAVs with serotype 8 or 9, which showed high infection capability for many organs and therapeutic safety24,25 (Fig. 2d). Efficacy of HITI-AAVs (AAV-Cas9 and AAV-mTubb3) was first tested by co-infecting cultured primary neurons. Infected neurons subsequently expressed GFP overlapped with cytoplasmic βIII-tubulin staining, and the percentage of GFP+ cells was 5.1% (absolute efficiency) of the total cell population (Extended Data Fig. 7a–c). The fidelity of GFP knock-in was confirmed by PCR and sequencing (Extended Data Fig. 7d, e).
We next injected the HITI-AAVs directly to the visual cortex of adult mouse brain. Two weeks later, brain sections were stained with a GFP antibody (Fig. 2e). In contrast to control (AAV-mTubb3 alone), where minimal GFP signals were detected, we found many neurons with cytoplasmic GFP signals in the experimental group (Fig. 2f). Our results indicate that the percentage of GFP+ cells in the adult mouse brain was 3.5% (absolute efficiency) of total cells counted and 10.6% (relative efficiency) of infected cells (mCherry+), respectively (Fig. 2g). We also generated HITI-AAVs for GFP knock-in in Ai14 mice and found local HITI-AAVs delivery through intramuscular injection in adult Ai14 mice also resulted in GFP knock-in at the Rosa26 locus in skeletal muscle (Extended Data Fig. 8a–c).
To explore the possibility of using HITI for gene replacement therapy, we used the Royal College of Surgeons (RCS) rat, a well-established animal model for retinitis pigmentosa (an inherited retinal degeneration condition that causes blindness in humans26) resulting from a homozygous 1.9-kb deletion from intron 1 to exon 2 in the Mertk gene27 (Fig. 3a). Morphological changes in the degenerating photoreceptor outer nuclear layer (ONL) appear as early as P16 in RCS rats. To try to restore MERTK function in the eye, we generated a HITI-AAV vector for inserting a copy of Mertk exon 2 into intron 1 (AAV-rMertk-HITI) and an HDR-AAV vector (AAV-rMertk-HDR) as a control (Fig. 3b). The AAVs were injected in the subretinal space of RCS rats 3 weeks after birth and analyses were performed between 7–8 weeks (Fig. 3c). DNA analysis revealed correct knock-in in eyes injected with HITI-AAVs (Fig. 3d and Extended Data Fig. 8d). In addition, HITI-AAVs injection led to statistically significant increases in Mertk mRNA expression levels (absolute efficiency: 4.5% of wild-type level) and better preservation of the ONL thickness compared with non-injected and HDR-AAV-injected controls (Fig. 3e, f). MERTK protein was also observed in eyes injected with HITI-AAVs, but not HDR-AAVs (Fig. 3g). To determine the effect of HITI treatment on the physiological function of the retina, electroretinography (ERG) responses were tested to measure the electrical activity of rods and cones (10 Hz flicker). The ERG tests were performed 4 weeks after the injection (P50). All eyes treated with HITI-AAVs exhibited significantly improved ERG b-wave responses (Fig. 3h). Similarly, 10 Hz flicker value, which measures cone response, was significantly improved and was more than fourfold higher than seen for the untreated eyes (Fig. 3i). It should be noted, however, that although tests demonstrated improved visual responses after subretinal injection of HITI-AAVs to 3-week-old RCS rats, the rescue was only partial and not enough to completely restore vision. Thus, when considering a putative path forward for treating this disease in the clinic, early intervention times (before overt retinal degeneration is seen) would be required.
Figure 3. HITI-mediated gene correction of a rat model of retinitis pigmentosa.
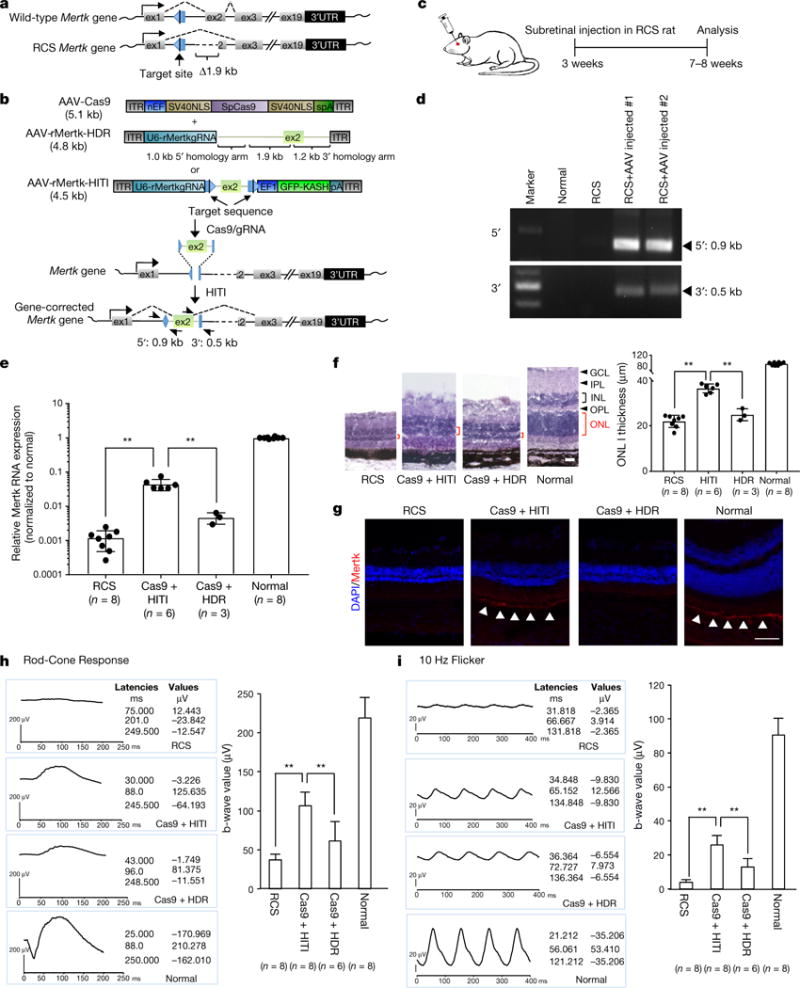
a, Schematic representation of the Mertk gene locus in both wild-type and RCS rats. Blue pentagon, Cas9/gRNA target sequence. Black line within blue pentagon, Cas9 cleavage site. b, Schematic of Mertk gene correction AAV vectors. Black half-arrows, PCR primers. c, Experimental scheme for Mertk gene correction in RCS rats. d, Validation of correct gene knock-in by genomic PCR. e, Relative Mertk mRNA expression. n, number of animals. Results were presented as mean ± s.d. The input data points were shown as black dots. **P < 0.01, unpaired Student’s t-test. f, Retinal morphology and outer nuclear layer (ONL) thickness. Red bracket, ONL. GCL, ganglion cell layer; IPL, inner plexiform layer; INL, inner nuclear layer; OPL, outer plexiform layer. Scale bars, 20 μm. n, number of animals. Results were presented as mean ± s.d. The input data points were shown as black dots. **P < 0.01, unpaired Student’s t-test. g, Representative immunofluorescence images of MERTK expression in retinal pigment epithelium (RPE) of RCS eyes. Scale bars, 50 μm. h, Improved rod and cone mix response (left, wave forms; right, quantification bars) in HITI-AAVs injected eyes. n, number of animals. Results were presented as mean ± s.d. **P < 0.01, unpaired Student’s t-test. i, Improved 10 Hz flicker cone response in HITI-AAVs injected eyes. n, number of animals. Results were presented as mean ± s.d. **P < 0.01, unpaired Student’s t-test. For full gel images, see Supplementary Fig. 1. For source data, see Supplementary Table 3.
We also tested systemic delivery of HITI-AAVs (AAV-Cas9 and AAV-Ai14-HITI) into P1 Ai14 mice via intravenous injection (Fig. 4a). Two weeks post-injections, we observed 4.2%, 3.4% and 10.0% GFP+ cells of total nuclei counted in the liver, heart and quadriceps muscle, respectively (GFP+/DAPI+, absolute efficiency) (Fig. 4b). GFP signals were also detected in a broad range of other organs and tissues (Extended Data Fig. 9a). We also compared in vivo gene knock-in efficiencies between HITI and HDR via systemic delivery and found that knock-in efficiency with HITI was significantly higher than with HDR in both liver and heart tissues (Extended Data Fig. 9b, c). Genomic PCR and DNA sequencing analyses of whole, unsorted liver and heart samples confirmed the correct gene knock-ins (Fig. 4c and Extended Data Figs 8a and 9d). We also found that indel frequencies, as determined by deep sequencing of unsorted samples, were comparable to knock-in efficiencies, similar to our observation in HEK293 cells (Fig. 4b, d and Extended Data Fig. 2h). Next we performed single-cell genotyping using GFP+ cells sorted from muscle and heart tissues (Fig. 4e). Our results demonstrated high on-target specificity of HITI (90–95%). Notably, among all analysed cells, 30–50% showed biallelic transgene integration. In addition, we observed preferential knock-in in adult liver after tail vein injection of AAVs, with an absolute efficiency of approximately 5% of total cells counted (Extended Data Fig. 10a–d). To study off-target effects of HITI following systemic in vivo delivery, we examined mutation rates for on-target sites, and the 12 highest ranked predicted genomic off-target sites using liver tissue. Next-generation sequencing analysis revealed minimal indel frequency at the examined off-target sites (Extended Data Fig. 10e).
Figure 4. AAV-mediated systemic HITI in vivo.
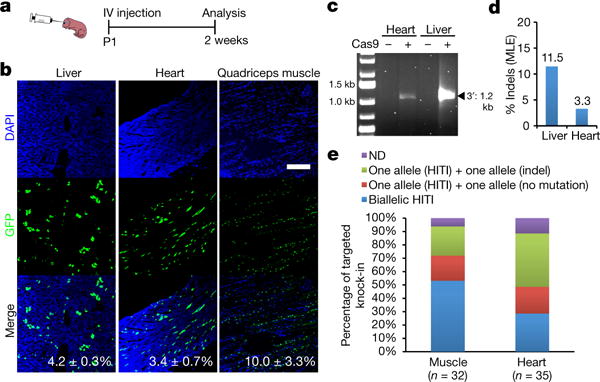
a, Schematic of in vivo targeted GFP-NLS knock-in by HITI via intravenous (IV) AAV injections to Ai14 mice. b, Representative immunofluorescence images of GFP expression in the liver, heart, and quadriceps muscle after intravenous injection of HITI-AAVs (serotype 9). The absolute efficiencies of GFP knock-in per cell (liver and heart) and per nucleus (quadriceps muscle) were shown. Results were obtained from five sections per sample and presented as mean ± s.d. Scale bar, 200 μm. c, Validation of correct gene knock-in in heart and liver by genomic PCR. d, Frequencies of indel per target sequence of liver and heart by deep sequencing. e, Single-cell genotyping of GFP+ cells from HITI-AAVs injected Ai14 mouse muscle and heart. n, number of the analysed single cells. ND, not determined. For full gel image, see Supplementary Fig. 1. For source data, see Supplementary Table 4.
The ability to use HITI for in vivo targeted transgene insertion into post-mitotic neurons is unprecedented and will help advance basic and translational neuroscience research. For example, HITI-mediated insertion of optogenetic activators into downstream of a specified gene locus may help gain cell-type-specific control over neuronal activities28. HITI may also allow, for instance, the generation of knock-in reporters for tracing cells in live animals. This will be particularly useful for animal models in which transgenic tools are limited (for example, non-human primates)29. With further improvement to efficiency, HITI also holds great promise for in vivo targeted gene-replacement therapy.
METHODS
No statistical methods were used to predetermine sample size. The experiments were not randomized and the investigators were not blinded to allocation during experiments and outcome assessment.
Plasmids
Vector expressing both gRNA and mCherry (pCAGmCherry-gRNA) was generated as previously described30. To construct gRNA expression vectors, each 20 bp target sequence was sub-cloned into pCAGmCherry-gRNA or gRNA_Cloning Vector (Addgene 41824). The CRISPR/Cas9 target sequences (20 bp target and 3 bp PAM sequence (underlined)) used in this study include: scramble, GCTTAGTTACGCGTGGACGAAGG; mutant GFP, CAGG GTAATCTCGAGAGCTTAGG; MH1, GCCGCTTTACTTAGGTCCCCGGG; and MH2, GGAGATCCACTCTCGAGCCCGGG; for PITCh donor: mouse Tubb3, AGCTGCGAGCAACTTCACTTGGG; human TUBB3, AGCTGCGAGCAGCTT CACTTGGG; human KCNQ1, AGTACGTGGGCCTCTGGGGGCGG; the downstream of CAG promoter in Ai14 mouse, TAGGAACTTCTTAGGGCCCGCGG; rat Mertk for HITI, GAGGACCACTGCAACGGGGCTGG; rat Mertk for HDR, TCAGGTGCTTAGGCATTTCGTGG. The Scramble-gRNA target sequence we designed is an artificial sequence that does not exist in human, mouse and rat genomes. We used the off-target finder software Cas-OFFinder (http://www.rgenome.net/cas-offinder/) to confirm that there were no genomic target sites within 2-bp mismatches. We have confirmed that the Scramble-gRNA can cut its target site in the donor vector (Extended Data Fig. 1b). pMDLg/pRRE, pRSV-Rev and pMD2.G (Addgene 12251, 12253 and 12259) were used for packaging lentiviruses. pEGIP*35 and tGFP (Addgene 26776 and 26864) were used for examining HDR and HITI efficiencies. To construct IRESmCherry-0c, IRESmCherry-1c, IRESmCherry-2c, IRESmCherry-MH, IRESmCherry-HDR-0c and IRESmCherry-HDR-2c, IRES and mCherry sequences were amplified with Cas9 target sequence by PCR from pEGIP*35 and pCAGmCherry-gRNA, respectively and co-integrated into pCR-bluntII vector (Invitrogen) with zero, one or two CAS9/gRNA target sequences. Cas9 expression plasmid (hCas9) was purchased from Addgene (41815). To generate different NLS-dCas9 constructs, pMSCV-LTR-dCas9-VP64-BFP (Addgene 46912) was used to amplify dCas9, which was subsequently subcloned into pCAG-containing plasmid with different NLS and 3 × Flag tag. To construct pCAG-Cas9 (no NLS), pCAG-1NLS-Cas9-1NLS and pCAG-1BPNLS-Cas9-1BPNLS, D10A and H840A mutations of dCas9 plasmids were exchanged to wild-type sequence by In-Fusion HD Cloning kit (Clontech). Then, pCAG-Cas9-2AGFP (no NLS), pCAG-1NLS-Cas9-1NLS-2AGFP and pCAG-1BPNLS-Cas9-1BPNLS-2AGFP were constructed by adding 2AGFP downstream of Cas9. To construct pCAG-floxSTOP-1BPNLS-Cas9-1BPNLS, 1BPNLS-Cas9-1BPNLS was amplified by PCR and exchanged with GFP of pCAG-floxSTOP-EGFP-N1 vector31. To construct HITI donor plasmids for mouse and human Tubb3 gene (Tubb3-1c, Tubb3-2c, Tubb3-2cd, hTUBB3-1c and hTUBB3-2c) and PITCh donor (Tubb3-MH), GFP was subcloned into pCAG-floxSTOP plasmid with one or two CAS9/gRNA target sequences. To construct HDR donor for mouse Tubb3 gene (Tubb3-HR), GFP, 5′ and 3′ homology arms were amplified from pCAG-GFP-N1 or mouse genome, then subcloned into pCAG-floxSTOP plasmid. pCAG-ERT2-Cre-ERT2 was purchased from Addgene (13777). PX551 and PX552 were purchased from Addgene (60957 and 60958). To construct AAV-Cas9, nEF (hybrid EF1 α/HTLV) promoter (Invivogen) was exchanged with Mecp2 promoter of PX551. To construct donor/gRNA AAVs for HITI, donor DNA sandwiched by Cas9/gRNA target sequence, gRNA expression cassette and GFPKASH (or mCherryKASH) expression cassettes were subcloned between ITRs of PX552, and generated pAAV-mTubb3, pAAV-Ai14-HITI, pAAV-Ai14-luc, pAAV-Ai14-scramble and pAAV-rMertk-HITI. For pAAV-rMertk-HITI, exon 2 of rat Mertk gene including the surrounding intron is sandwiched by Cas9/gRNA target sequence, which is expected to integrate within intron 1 of Mertk by HITI. For HDR AAV (pAAV-Ai14-HDR and pAAV-rMertk-HDR), the homology arms were amplified by PCR from mouse and rat genome DNA, and subcloned into AAV backbone plasmid. The plasmids described in this manuscript will be available to academic researchers through Addgene.
Genomic DNA extraction and genomic PCR
Genomic DNAs were extracted using Blood & Tissue kit (QIAGEN) or PicoPure DNA Extraction Kit (Thermo Fisher Scientific). Genomic PCRs were performed using PrimeSTAR GXL DNA polymerase (Takara).
Bisulphite sequencing
Genomic DNA from the transfected HEK293 lines was extracted and bisulphite converted using the Zymo EZ DNA methylation-direct Kit (Zymo Research). The DNA methylation profile of mCherry was analysed by TOPO cloning as described previously32.
Cell lines
H1 hES cells were purchased from WiCell Research, and maintained in hES cell medium33. HEK293 cell was purchased from ATCC. Cell lines were authenticated by STR analysis. Mycoplasma contamination was checked every 2 months and was found to be negative in all cell lines used.
AAV production
All AAVs were packaged with serotypes 8 or 9 and were generated by the Gene Transfer Targeting and Therapeutics Core (GT3) at the Salk institute for biological studies.
Animals
ICR, C57BL/6 and ROSA-LSL-tdTomato (known as Ai14)20 mice were purchased from the Jackson laboratory. Some timed pregnant ICR mice were purchased from SLC Japan (Sizuoka, Japan). RCS and Brown Norway rats were purchased from the Jackson laboratory. All mice used in this study were from mixed gender, mixed strains and P1 to 12 weeks old. All mouse experiments were approved by the IACUC committee or the RIKEN Center for Developmental Biology and conform to regulatory standards. All rat procedures were conducted with the approval and under the supervision of the Institutional Animal Care Committee at the University of California San Diego and adhered to the ARVO Statement for the Use of Animals in Ophthalmic and Vision Research. The midday of the vaginal plug was designated as embryonic day 0.5 (E0.5).
Minicircle DNA vectors
Construction and production of minicircle DNA vectors were performed as previously described34. Briefly, to construct pre-minicircle plasmids (pIRESmCherry-MC, pIRESmCherry-MC-scramble, pTubb3-MC, pTubb3-MC-scramble, pAi14-GFPNLS-MC, pAi14-GFPNLS-MC-scramble, pAi14-luc-MC and pAi14-luc-MC-scramble), IRESmCherry, GFP or luciferase genes with Cas9/gRNA targeting sequence were cloned into ApaI and SmaI sites of the minicircle producer plasmid pMC.BESPX (a gift from M. Kay, Stanford University School of Medicine). The final minicircle constructs were introduced into the E. coli strain 3S2T (a gift from M. Kay) and amplified overnight in Terrific Broth (pH 7.0) (Fisher Scientific). The minicircle production was induced by mixing the overnight TB culture with an equal volume of minicircle induction mix comprising fresh LB and 20% L-arabinose (SBI), followed by a 5 h incubation at 32 °C with shaking at 250 r.p.m. Minicircle DNA was isolated with EndoFree Plasmid Mega Kit (QIAGEN) following the manufacturer’s protocol except that the volumes of P1, P2 and P3 buffers were doubled.
Surveyor assay
To confirm the function of the Scramble-gRNA, we performed Surveyor assay in GFP-correction HEK293 line. Briefly, Cas9, Scramble-gRNA, and different donor DNA (IRESmCherry-MC or IRESmCherry-MC-scramble) were transfected into GFP-correction HEK293 line. Three days later, genomic DNA was extracted with DNeasy Blood & Tissue kit. To examine the activity of the generated nuclear localized Cas9, we performed Surveyor assay in human H1 ES cells. Briefly, each 1.5 × 10⁷ feeder-free cultured H1 ES cells were dissociated by TrypLE (Invitrogen), and resuspended in 1 ml of MEF-conditioned medium containing 10 μM ROCK inhibitor Y-27632 (Biomol Inc.). Cells were electroporated with 25 μg of pCAGmCherry-KCNQ1 and 25 μg of different Cas9 (pCAG-Cas9-2AGFP, pCAG-1NLS-Cas9-1NLS-2AGFP or pCAG-1BPNLS-Cas9-1BPNLS-2AGFP), and were plated onto 100-mm dishes pre-coated with Matrigel. Two days after electroporation, the cells were dissociated by TrypLE, and Cas9 and gRNA expressing cells were sorted out as GFP/mCherry double-positive cells by BD influx cell sorter (BD), and genomic DNA extracted with DNeasy Blood & Tissue kit. The extracted genomic DNA from the transfected GFP-correction HEK293 line and human H1 ES cells were used for Surveyor assay with SURVEYOR Mutation Detection Kits (Transgenomic) as described previously35.
Generation of GFP-correction HEK293 line
To assess the knock-in efficiency in dividing cells and optimize the HITI method, we established a mutated GFP gene-based reporter system in HEK293. Briefly, pEGIP*35 was co-transfected with pMDLg/pRRE, pRSV-Rev and pMD2.G, packaged and purified as lentiviral vectors according to a published protocol36. HEK293 cells were transduced in suspension with lentiviral EGIP*35 vector and 4 μg ml−1 polybrene for 1 h. After brief centrifugation to remove any residual lentiviral vector, the cells were seeded in 100-mm dishes. Three days after transduction, puromycin (1–2 μg ml−1; Invitrogen) was added to the medium. After 10 days, single colonies were individually picked up and expanded as GFP-correction HEK293 line.
Culture of mouse primary neurons
Primary neurons were obtained from the cortex of E14.5 ICR mouse brains. After the embryo retrieval, all dissection procedures were performed in a cold solution of 1 × phosphate-buffered saline (PBS) with 2% glucose (Gibco). Cortical tissue was dissociated by trypsinization, and 1.5 × 10⁵ cells cm−2 were plated over coated poly-D-lysine coverslips (Neuvitro) with Neurobasal media (Gibco) supplemented with 2% B27 (Gibco) and 0.25% Glutamax (Gibco). The cultures were incubated at standard conditions (37 °C in humidified 5% CO2/95% air atmosphere). Half volume of culture media was replaced every 3 days.
Differentiation and culture of human ES cell-derived pan neurons
The differentiation protocol from human ES cells to pan neurons was described previously37.
Transfection of in vitro cultured cells
Lipofectamine 3000 (Invitrogen), CombiMag Reagent in combination with Lipofectamine 2000 (OZBiosciences) and DNA-In Neuro Transfection Regent (Amsbio) were used for transfection of HEK293 cells, mouse primary cells and human ES cell-derived pan neurons, respectively. Transfection complexes were prepared following the manufacturer’s instructions.
Measurement of targeted gene knock-in efficiency in GFP-correction HEK293 line
To measure the targeted gene knock-in efficiency in GFP-correction HEK293 line, we co-transfected hCas9, gRNA (mutant GFP-gRNA, Scramble-gRNA, MH1-gRNA and/or MH2-gRNA) and donor DNA. Promoterless IRESmCherry plasmids with zero, one, or two CRISPR/Cas9 target sites (IRESmCherry-0c, IRESmCherry-1c and IRESmCherry-2c, respectively) and a minicircle donor (IRESmCherry-MC) were used to measure HITI efficiency. HDR-donors (tGFP and IRESmCherry-HDR-0c) were used to measure HDR efficiency. A PITChdonor (IRESmCherry-MH) was used to measure PITCh efficiency. IRESmCherry-HDR-2c was used as HDR and HITI dual donors. IRESmCherry-0c and IRESmCherry-MC-scramble were used as genome DNA cut only and donor DNA cut only controls, respectively. The Scramble-gRNA target sequence is an artificial sequence that does not exist in both human and mouse genomes. The Scramble-gRNA was transfected with IRESmCherry-MC-scramble. The MH1-gRNA and MH2-gRNA were co-transfected with IRESmCherry-MH. For other donor shown in Fig. 1a, the mutant GFP-gRNA was co-transfected. The efficiencies of targeted gene knock-in via HDR, PITCh and HITI were determined by calculating the percentage of GFP+ or mCherry+ cells by FACS LSR Fortessa (BD) and the percentages of PITCh, HITI (without indel) or HITI (with indel) per mCherry+ cells were determined by Sanger sequencing.
Isolation of the genome-edited GFP-correction HEK293 clones
The transfected cells were separated into mCherry+ and mCherry− populations by FACS via BD Influx (BD), and ~500 cells were plated onto 100-mm dishes pre-coated with wildtype HEK293 cells. Two days after transduction, puromycin (2 μg ml−1; Invitrogen) was added to the medium. After 2 weeks, genome-edited HEK293 clones were manually picked and further analysed by PCR and sequencing to determine the genotype.
Immunocytochemistry of primary neurons
Cells were fixed in 4% paraformaldehyde (PFA) at room temperature for 15 min. Then cells were blocked and permeabilized with 5% Bovine Serum Albumin (BSA) and 0.1% Triton X-100 in PBS for 50 min with shaking at room temperature. Primary antibodies were diluted in 2.5% BSA/PBS and cells were incubated overnight at 4 °C in a wet chamber with anti-GFP (Aves) and anti-βIII tubulin (Sigma) antibodies. Next day, cells were washed with 0.2% Tween 20 in PBS, and incubated for 1 h at room temperature with the secondary antibodies Alexa Fluor 488 (Thermo Fisher) or Alexa Fluor 647 (Thermo Fisher). After a second round of washing with 0.2% Tween 20 in PBS, the cells were mounted using DAPI-Vector Shield mounting media (Vector) and stored at 4 °C. To examine cell proliferation status, we added 2 μM EdU (Invitrogen) in the transfected neurons, and detected EdU positive cells by Click-iT EdU kit (Invitrogen).
Immunocytochemistry of primary tissues
Animals were harvested after transcardial perfusion using PBS followed by 4% PFA. Organs were dissected out and post-fixed with 2% PFA and 15% sucrose in PBS at 4 °C for 16–20 h, then immersed in 30% sucrose in PBS at 4 °C before sectioning. Mouse brains were fixed in 1% PFA in 0.1 M phosphate buffer (pH 7.4) at 4 °C for 24 h followed by cryoprotection in 25% sucrose overnight at 4 °C. For neonatal brain, brains were embedded in OCT compound (Sakura Tissue-Tek) and sectioned by Cryostat (14 μm). Well-dried sections were washed 3 times with PBST (1% Tween 20 in PBS) and treated with blocking buffer (2% donkey serum and 0.2% Triton X-100 in PBS, pH 7.4) for 1 h at room temperature, followed by incubation with primary antibodies diluted in the same buffer overnight at 4 °C. The primary antibodies used were Anti-GFP (Aves) and anti-mCherry (Abcam). Sections were washed three times in PBST and treated with secondary antibodies conjugated to Alexa Fluor 488 or Alexa Fluor 546 (Thermo Fisher) for 1 h at room temperature. After wash, the sections were mounted with mounting medium (PermaFluor, Thermo scientific). For adult brain, 50 μm coronal brain sections were prepared using a freezing microtome and stored in PBS with 0.01% sodium azide at 4 °C. Free-floating sections were incubated at 4 °C for 16–48 h with goat anti-GFP (Rockland) primary antibodies in PBS/0.5% normal donkey serum/0.1% Triton X-100, followed by the appropriate secondary antibodies conjugated with Alexa Fluor 488 at room temperature for 2–3 h. Sections were counterstained with 10 μM DAPI in PBS for 30 min to visualize cell nuclei. Immunostained tissue sections were mounted on slides with polyvinyl alcohol mounting medium containing DABCO and allowed to air-dry overnight. For other tissues, the harvested tissues were embedded in OCT compounds and frozen. Serial or axial frozen sections (thickness 10–20 μm) were prepared using a cryostat, which were then placed on silanized slides and air-dried. The sections were washed with PBS, followed by 1 h room temperature incubation by blocking buffer containing 3% normal goat serum, 0.3% and Triton X-100 in PBS, then incubated with the first antibody solution overnight. The primary antibodies used were anti-GFP, anti-mCherry, anti-dystrophin (Sigma), anti-actin, anit-smooth-muscle antibody (Sigma) and anti-human-serum-albumin antibody (R&D). After wash, the sections were immunostained with secondary antibody solution for 1 h at room temperature. The secondary antibodies used were Alexa Fluor 488, 568 or 647. After sequential washing with 0.2% Tween 20/PBS, 0.05% Tween 20/PBS, and PBS, the sections were mounted with DAPI Fluoromount-G (Southern Biotech). For rat, retinal cryosections were rinsed in PBS and blocked in 0.5% Triton X-100 in 5% BSA in PBS for 1 h at room temperature. Anti-Mertk antibody (eBioscience) was diluted in 5% BSA in PBS and incubated with sections overnight at 4 °C. The sections were then washed three times with PBS, incubated with IgG secondary antibody tagged with Alexa Fluor 555 (Thermo Fisher) in PBS at room temperature for 1 h, and washed with PBS. Cell nuclei were counterstained with DAPI. Sections were mounted with Fluoromount-G (SouthernBiotech) and coverslipped. Images were captured by Keyence BZ-9000 microscope.
Nuclear/cytoplasm ratio
To measure intracellular localization of dCas9, we followed a previous report16. In brief, the dCas9-transfected HEK293 cells were fixed with 4% PFA and stained with anti-Flag (Sigma) and DAPI (Vector). The intensity of fluorescence was measured using the PlotProfile tool of ImageJ software. Values were obtained independently in cytoplasmic and nuclear compartments in single transfected cells. Relative fluorescence values of nuclear intensity were divided by the values found in cytoplasm to obtain the nuclear/cytoplasm ratio.
Gene transfer into mouse embryos by in utero electroporation
The experimental procedures for in utero electroporation have been described previously38. E15.5 pregnant ICR mice were anaesthetized by 500 μl IP injection of 10% Nembutal (Dainippon sumitomo kagaku). 1 μl of DNA mixture, containing the pCAG-1BPNLS-Cas9-1BPNLS (0.5 μg pl−1), mouse Tubb3 gene target pCAGmCherry-gRNA (0.5 μg μl−1) and either donor cut-only control donor (Tubb3-MC-scramble), minicircle donor (Tubb3-MC), 2-cut (Tubb3-2c) or HDR donor (Tubb3-HDR) vectors (0.8 μg μl−1) was injected into the hemisphere of the fetal brain. For visually confirming the injection, 0.005% fast green solution (Wako) was mixed with the DNA. Fetuses were tweezed by paddles of the tweezer electrodes (CUY21 electroporator, NEPA GENE). For tamoxifen (TAM) inducible Cre-dependent Cas9 expression system, fetuses were injected with 1 μl of DNA mixture into the hemisphere, containing the pCAG-floxSTOP-1BPNLS-Cas9-1BPNLS (0.5 μg μl−1), pCAG-ERT2CreERT2 (0.5 μg μl−), pCAG-mcherry-U6-gRNA (0.5 μg μl−1) and either minicircle donor (Tubb3-MC) or HDR donor (Tubb3-HDR) vectors (0.8 μg μl−1). 50 μl of 10 mg ml−1 tamoxifen (Sigma) dissolved in corn oil were injected to P10 and P11 electroporated pups for induction of the Cas9 expression. The GFP knock-in efficiency was measured by the percentage of GFP+ cells among transfected cells (mCherry+).
RT-PCR from neonatal mouse brain
The DNA mixtures were transfected by in utero electroporation at E15.5 of mouse brain and the mice were euthanized at P10. The collected brains from P10 mice were trypsinized for 40 min at 37 °C, then dissociated to single cells by pipetting. About 22,000 electroporated cells were collected by FACS sorting (SH-800, Sony). Total RNA was extracted from the sorted cells with RNeasy mini kit (Qiagen) and cDNA was synthesized by SuperScript VILO (Invitrogen). RT-PCR was performed with PrimeSTAR GXL polymerase as following the manufacturer’s protocol with 10% of 5 M betaine solution (Sigma).
In vivo muscle electroporation
The DNA mixture for Scramble control (25 μg of pCAG-1BPNLS-Cas9-1BPNLS, 25 μg of Scramble-gRNA-mCherry and 10 μg of Ai14-GFPNLS-MC-scramble), without Cas9 (25 μg of empty vector, 25 μg of Ai14gRNA-mCherry and 10 μg of Ai14-luc-MC or Ai14-GFP-MC) and with Cas9 (25 μg of pCAG-1BPNLS-Cas9-1BPNLS, 25 μg of Ai14gRNA-mCherry and 10 μg of Ai14-luc-MC or Ai14-GFP-MC) were prepared in 25 μl TE. Wild-type or Ai14 mice were anaesthetized with intraperitoneal injection of ketamine (100 mg kg−1) and xylazine (16 mg kg−1). For quadriceps muscle electroporation, a small portion of the quadriceps muscle was surgically exposed in the hind limb. Plasmid DNA mixture was injected into the muscle using a 29-gauge insulin syringe. One minute following plasmid DNA injection, a pair of electrodes was inserted into the muscle to a depth of 5 mm to encompass the DNA injection site and muscle was electroporated using an Electro Square Porator T820 (BTX Harvard Apparatus). Electrical stimulation was delivered twenty pulses at 100 V for 20 ms. After electroporation, skin was closed and mice were recovered on a 37 °C warm pad. For panniculus carnosus muscle electroporation, the hair of back skin was depilated with depilatory cream. The above mixture of DNA solutions were conjugated and subcutaneously injected to right and left side, respectively. The injected areas of skin and subcutaneous tissue was vertically sandwiched by plate-and-fork type electrodes, consist of a pair of stainless-steel tweezers, one with a rectangular plate, 10 mm long and 5 mm wide, and the other with a fork consisting of three straight needles at 2.5 mm intervals, which are 10 mm long and 0.5 mm in diameter. The interface of skin and the rectangular electrode was covered with electroconductive gel (SpectraGel 360, Parker Labs). Twenty 18 V/50 ms/1 Hz square pulses followed by another 20 pulses of the opposite polarity were delivered using Electro Square Porator T820. Two weeks after the electroporation, mice were euthanized, and tissues were obtained.
Tissue pressure-mediated transfection
The DNA mixture without Cas9 (100 μg of empty vector, 100 μg of Ai14gRNA-mCherry and 50 μg of Ai14-luc-MC) and with Cas9 (100 μg of pCAG-1BPNLS-Cas9-1BPNLS, 100 μg of Ai14gRNA-mCherry and 50 μg of Ai14-luc-MC) were prepared in 200 μl saline. A midline laparotomy was performed and the right kidney of wild-type or Ai14 mouse was exteriorized. After exposure of kidney, mice were intravenously injected with plasmid DNA mixture, immediately followed by pressing the right kidney gripped between thumb and index finger 20 times for a period of 1 s each as described previously39.
In vivo electroporation for kidney
The DNA mixture for Scramble control (100 μg of pCAG-1BPNLS-Cas9-1BPNLS, 100 μg of Scramble-gRNA-mCherry and 50 μg of Ai14-GFPNLS-MC-scramble), without Cas9 (100 μg of empty vector, 100 μg of Ai14gRNA-mCherry and 50 μg of Ai14-GFP-MC) and with Cas9 (100 μg of pCAG-1BPNLS-Cas9-1BPNLS, 100 μg of Ai14gRNA-mCherry and 50 μg of Ai14-GFP-MC) were prepared in 200 μl saline. A midline laparotomy was performed. The right kidney of Ai14 mouse was exteriorized and subsequently decapsulated, leaving the adrenal gland intact. The exposed kidney was pricked with electrode needles after injection of plasmid DNA mixture from tail vein and subsequently received electroporation 100 V, 50 ms pulse, six times using an Electro Square Porator T820.
Luciferase detection
Mice were examined at 2 weeks after DNA transfection or electroporation by BLI performed using an IVIS Kinetic 2200 (Caliper Life sciences). Mice were IP injected with 150 mg kg−1 D-Luciferin (BIOSYNTH), anaesthetized with isoflurane and dorsal images were then captured 10 min post luciferin injection.
AAV infection in mouse primary neuron
Primary cultures of neurons were used after three days in culture, the AAV solution (without Cas9, AAV-mTubb3 (1.5 × 10¹⁰ GC); with Cas9, AAV-Cas9 (1.5 × 10¹⁰ GC) and AAV-mTubb3 (1.5 × 10¹⁰ GC)) was added and cultures were kept at standard conditions for 5 days, following immunocytochemistry or DNA extraction.
Stereotax AAV injection in adult brain
C57BL/6 mice received AAV8 injections at P75. We used 1:1 mixture of AAV-Cas9 (1.5 × 10¹³ GC ml−1) and AAV-mTubb3 (2.3 × 10¹³ GC ml−1). As a control, 1:1 mixture of AAV-mTubb3 and HBSS buffer was used. Mice were anaesthetized with 100 mg kg−1 of ketamine and 10 mg kg−1 of xylazine cocktail via intra-peritoneal injections and mounted in a stereotax (David Kopf Instruments Model 940 series) for surgery and stereotaxic injections. Virus was injected into the centre of V1, using the following coordinates: 3.4 mm rostral, 2.6 mm lateral relative to bregma and 0.5–0.7 mm ventral from the pia. We injected 200 nl of AAVs using air pressure by picospritzer (General Valve Corp). To prevent virus backflow, the pipette was left in the brain for 5–10 min after completion of injection. Mice were housed for two weeks to allow for gene knock-in.
Intramuscular AAV injection
Ai14 mice were anaesthetized with intraperitoneal injection of ketamine (100 mg kg−1) and xylazine (16 mg kg−1). A small portion of the quadriceps muscle was surgically exposed in the hind limb. The AAV8 mixture (without Cas9, AAV-Ai14-HITI (1.5 × 10¹⁰ GC); with Cas9, AAV-Cas9 (1.5 × 10¹⁰ GC) and AAV-Ai14-HITI (1.5 × 10¹⁰ GC)) was were injected into the quadriceps muscle using a 29 Gauge insulin syringe. After AAV injection, skin was closed and mice were recovered on a 37 °C warm pad.
Intravenous (IV) AAV injection
The newborn (P1) of Ai14 mice were used for IV AAV8 or AAV9 injection following a previous report40. The AAV mixtures (without Cas9, AAV-Ai14-HITI (5 × 10¹⁰ or 2 × 10¹¹ GC); with Cas9, AAV-Cas9 (5 × 10¹⁰ or 2 × 10¹¹ GC) and AAV-Ai14-HITI (5 × 10¹⁰ or 2 × 10¹¹ GC); Scramble control, AAV-Cas9 (5 × 10¹⁰ GC) and AAV-Ai14-Scramble (5 × 10¹⁰ GC); HDR, AAV-Cas9 (5 × 10¹⁰ GC) and AAV-Ai14-HDR (5 × 10¹⁰ GC)) were injected via temporal vein of the P1 mouse.
Tail vein AAV injection
The AAV8 mixtures (without Cas9, AAV-Ai14-luc (2 × 10¹¹ GC); with Cas9, AAV-Cas9 (2 × 10¹¹ GC) and AAV-Ai14-luc (2 × 10¹¹ GC)) were injected via tail vein for luciferase knock-in. The AAV mixtures (without Cas9, AAV-Ai14-HITI (2 × 10¹¹ GC); with Cas9, AAV-Cas9 (2 × 10¹¹ GC) and AAV-Ai14-HITI (2 × 10¹¹ GC)) were injected via tail vein for GFP knock-in.
Image capture and measurement of in vivo GFP knock-in efficiency
For immunocytochemical analyses, the cells and tissues were visualized by confocal microscopy using a Zeiss LSM 780 Laser Scanning Confocal or Olympus FV1000 confocal microscope (Olympus). At least five pictures were obtained from each group and animal. We analysed at least three animals. Pictures were analysed with ZEN 2 (blue edition) and NIH ImageJ (FIJI) software. For the mouse primary neurons and human pan neurons analyses, the total number of positive cells for each marker were directly counted with the multi-point tool of NIH ImageJ software. The percentage of GFP+ cells was calculated among transfected cells (mCherry+) or total cells (DAPI+). The intracellular distribution of GFP was observed in around 100 independent events for each condition, where the focused cell was observed at different stacks to determine the presence or absence of GFP at the nucleus space. To assess the efficiency of GFP knock-in in brain after local AAV injection, we counted number of GFP+, mCherry+ and DAPI+ cells of 300 μm within injection sites and determined the GFP knock-in efficiency per infected cells or per cell. To assess the efficiency of GFP knock-in in liver, heart and muscle after systemic AAV injection, we counted the number of GFP+ and DAPI+ cells and determined the GFP knock-in efficiency per cell.
Single-cell genotyping
To collect GFP-positive single cells from muscle and heart of AAV-injected mouse, animals were harvested after transcardial perfusion using PBS. Organs were dissected out and isolated as single cells with published methods41,42. The single nuclei per cell was confirmed by fluorescent microscope with DAPI staining and separated by BD influx cell sorter. Each single GFP+ cell was sorted into 5 μl of lysis buffer from PicoPure DNA Extraction Kit by BD influx cell sorter and used as a template for first round of PCR to amplify the target genome with PrimeSTAR GXL polymerase following the manufacturer’s protocol. The first round of PCR product was purified using Agencourt AMPure XP (Beckman Coulter), then subject to second round PCR and sequencing to confirm the genotype. Based on sequencing result of 5′ junction end, single cell genotyping can separate biallelic GFP knock-in, monoallelic GFP knock-in with indels at another target, monoallelic GFP knock-in without indels at another target, and unknowns.
Targeted deep sequencing
The top 12 predicted off-target sites were searched using The CRISPR Design Tool43. The on-target and potential off-target regions were amplified using PrimeSTAR GXL DNA polymerase from the liver DNA via IV injection and used for library construction. Equal amounts of the genomic DNA was used to amplify genomic regions flanking the on-target and top 12 predicted off-target nuclease binding sites for library construction. Next, PCR amplicons from previous step were purified using Agencourt AMPure XP, then subject to second round PCR to attach Illumina P5 adapters and sample-specific barcodes. The purified PCR products were pooled at equal ratio for single-end sequencing using Illumina MiSeq at the Zhang laboratory (UCSD). The raw reads were mapped to mouse reference genome mm9 or custom built Ai14 mouse genome using BWA44. High quality reads (score >30) were analysed for indel events and Maximum Likelihood Estimate (MLE) calculation as previously described43. As next generation sequencing analysis of indels cannot detect large size deletion and insertion events, CRISPR/Cas9 targeting efficiency and activity shown above is underestimated.
Subretinal injection in rats
Congenic RCS rats at 21 days old were used in the study and divided into three groups. RCS group is non-injection control. The Cas9 + HITI group received a subretinal injection of 2 μl of AAV8 mixture (AAV-Cas9 (1.5 × 10¹⁰ GC) and AAV-rMertk-HITI (1.5 × 10¹⁰ GC)) in the eyes. The Cas9 + HDR group received a subretinal injection of 2 μl of AAV8 mixture (AAV-Cas9 (1.5 × 10¹⁰ GC) and AAV-rMertk-HDR (1.5 × 10¹⁰ GC)) in the eyes. Wild-type rats without an injection served as a normal control. Experimental rats were anaesthetized with an intraperitoneal injection of a mixture of ketamine and xylazine. Pupils were dilated with 1% topical tropicamide. Subretinal injection was performed under direct visualization using a dissecting microscope with a pump microinjection apparatus (Picospritzer III; Parker Hannifin Corporation) and a glass micropipette (internal diameter ~50–75 μm). Two microlitres of AAV mixture was injected into the subretinal space through a small scleral incision. A successful injection was judged by creation of a small subretinal fluid bleb. Fundus examination was performed immediately following injection, and rats showing any sign of retinal damage such as bleeding were discarded and excluded from the final animal counts.
ERG recording
To monitor the efficacy of gene knock-in in vision rescue, ERG studies were performed at 4 weeks after treatment before the animals were euthanized for histology. The dark-adapted ERG response was recorded as described previously45. In brief, rats were dark-adapted for 14 h before the commencement of each ERG recording session. They were deeply anaesthetized as described for the surgical procedure above. Eyes were treated with 1% topical tropicamide to facilitate pupillary dilation. Each rat was tested in a fixed state and manoeuvred into position for examination within a Ganzfeld bowl (Diagnosys LLC). One active lens electrode was placed on each cornea, with a subcutaneously placed ground needle electrode positioned in the tail and the reference electrodes placed subcutaneously in the head region approximately between the two eyes. Light stimulations were delivered with a xenon lamp at 0.01 and 0.3 cds m−2 in a Ganzfeld bowl. For the flicker ERG measurement, rats were adapted at a background light of 10 cds m−2, and light stimulation was set at 30 cds m−2. The recordings were processed using software supplied by Diagnosys.
Histological analysis of the rat eye
Following ERG recordings, rats were euthanized and retinal cross-sections were prepared for histological evaluation of ONL preservation. Rats were euthanized with CO2, and eyeballs were dissected out and fixed in 4% PFA. Cornea, lens, and vitreous were removed from each eye without disturbing the retina. The remaining retina-containing eyecup was infiltrated with 30% sucrose and embedded in OCT compound. Horizontal frozen sections were cut on a cryostat. Retinal cross-sections were prepared for histological evaluation by staining with haematoxylin and eosin (H&E).
DNA and RNA analyses of the rat eye
Following ERG recordings, rats were euthanized. DNA and RNA were isolated from retina-choroid complex using an AllPrep DNA/RNA Mini Kit (Qiagen). DNA was further used for PCR and TOPO sequencing. cDNA was synthesized from RNA using a Superscript III reverse transcriptase kit (Invitrogen) according to the manufacturer’s instructions. Quantitative PCR was performed via 40 cycle amplification using following primers (MertK-F1: GCATTTCGTGGTGGAAAGAT, MertK-R1: TGGGATCAGACACAACCTCTC) and Power SYBR Green PCR Master Mix on a 7500 Real-Time PCR System (Applied Biosystems). Measurements were performed in triplicate and normalized to endogenous GAPDH levels. The relative fold change in expression was calculated using the ΔΔCt method (Ct values <30).
Data availability
The analysis for insertion and deletion (indel) events and Maximum Likelihood Estimate (MLE) calculation were done as previously described43. All custom scripts can be provided upon request. Raw Illumina sequencing reads for this study have been deposited in the National Center for Biotechnology Information Short Read Archive and accessible through SRA accession number SRP069844.
Extended Data
Extended Data Figure 1. Optimization of donor vectors for HITI in HEK293 cells.
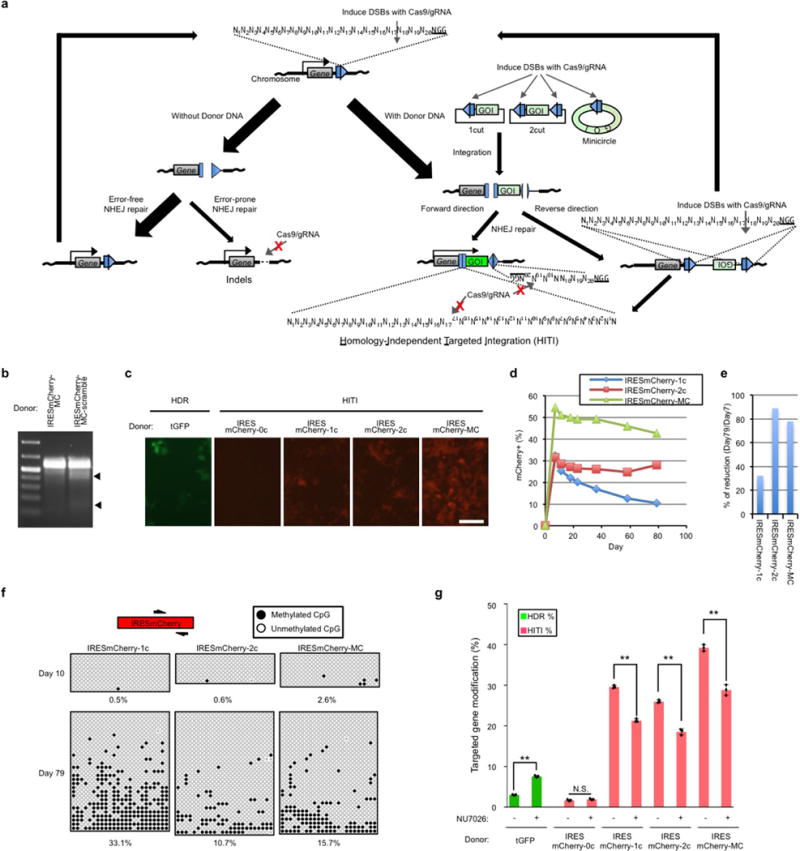
a, Schematic of NHEJ-mediated targeted genome editing and different HITI donor vectors with Streptococcus pyogenes Cas9. Blue pentagon, Cas9/gRNA target sequence. Black line within blue pentagon, Cas9 cleavage site. GOI, gene of interest; DSBs, double strand breaks; Indels, insertions and deletions. b, Surveyor nuclease assay performed with Cas9, Scramble-gRNA, and different donor plasmids (IRESmCherry-MC or IRESmCherry-MC-scramble) in the GFP-correction HEK293 line. The two lower bands are cleaved DNA products by Surveyor nuclease, indicating that Cas9/Scramble-gRNA cut scramble target sequence on the donor, but not genomic sequence. c, Representative immunofluorescence images of the targeted gene integration in the GFP-correction HEK293 line by HDR and HITI. Scale bar, 100 μm. d, Time course studies of the percentages of mCherry+ cells with different HITI targeting vectors. e, The percentage of mCherry+ cells on day 79 versus day 7. f, The CpG methylation status of the mCherry gene at early (day 10) and late passages (day 79) with different HITI targeting vectors. Two black half-arrows indicate primers for bisulphite sequencing. g, The effect of the NHEJ inhibitor (NU7026; 30 μM) on knock-in efficiencies by HDR and HITI. Results were obtained from three replicate wells and presented as mean ± s.d. The input data points were shown as black dots. N.S., not significant. **P<0.01, unpaired Student’s t-test. For gel source image, see Supplementary Fig. 1. For source data, see Supplementary Table 5.
Extended Data Figure 2. Sequencing analyses of the IRESmCherry knock-in clones via HITI in HEK293 cells.
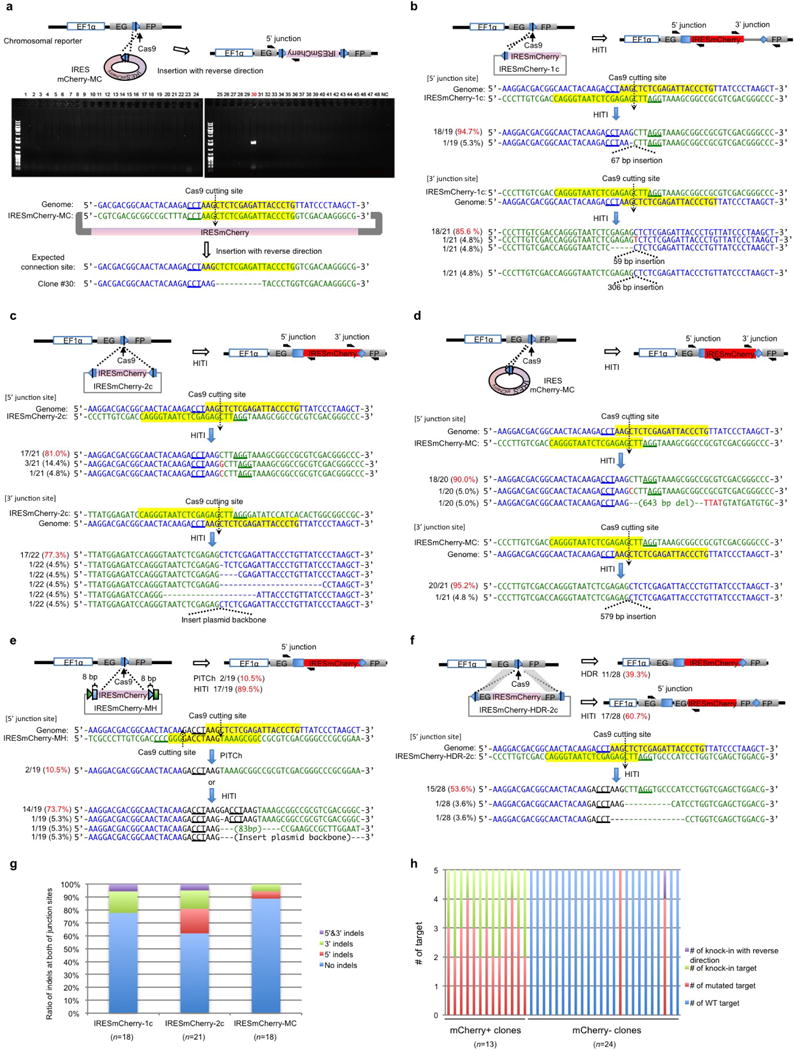
a, Analysis of the direction of targeted insertion for HITI with IRESmCherry-MC donor. Detection of reverse integrated IRESmCherry-MC from mCherry− single-cell colonies via PCR. Only one (no. 30, highlighted in red) out of 48 mCherry− clones (non-transfected, non-edited or reverse integrated) was integrated in reverse direction with a 10-bp deletion at junction site revealed by PCR and sequencing analysis. b, Sequences of the 5′ and 3′ junction sites of mCherry+ clones after IRESmCherry knock-in by HITI in the GFP-correction HEK293 line with IRESmCherry-1c donor. The blue pentagon and sequence highlighted in yellow indicate the Cas9/gRNA target sequence. The black line within the blue pentagon indicates the Cas9 cleavage site. The PAM sequence is underlined. c, Sequences of the 5′ and 3′ junction sites of mCherry+ clones after IRESmCherry knock-in by HITI in the GFP-correction HEK293 line with IRESmCherry-2c donor. d, Sequences of the 5′ and 3′ junction sites of mCherry+ clones after IRESmCherry knock-in by HITI in the GFP-correction HEK293 line with IRESmCherry-MC donor. e, Sequences of the 5′ junction site of mCherry+ clones after IRESmCherry knock-in by PITCh or HITI in the GFP-correction HEK293 line with IRESmCherry-MH donor. f, Sequences of the 5′ junction site of mCherry+ clones after IRESmCherry knock-in by HDR or HITI in the GFP-correction HEK293 line with IRESmCherry-HDR-2c donor. g, The fidelity of 5′ and 3′ junction sites of mCherry+ clones after IRESmCherry knock-in by HITI in the GFP-correction HEK293 line with IRESmCherry-1c, IRESmCherry-2c and IRESmCherry-MC donor. n, number of analysed clones. h, IRESmCherry-MC donor was transfected into the GFP-correction HEK293 line which has five copies of the target sequence in the genome. The ratio of IRESmCherry knock-in and mutation at all target loci of mCherry+ clones and the ratio of unmodified, mutated and reverse integrated target loci of mCherry− clones were examined by sequencing. n, number of analysed clones. For gel source images, see Supplementary Fig. 1. For source data, see Supplementary Table 6.
Extended Data Figure 3. Optimization of nuclear transport of Cas9.
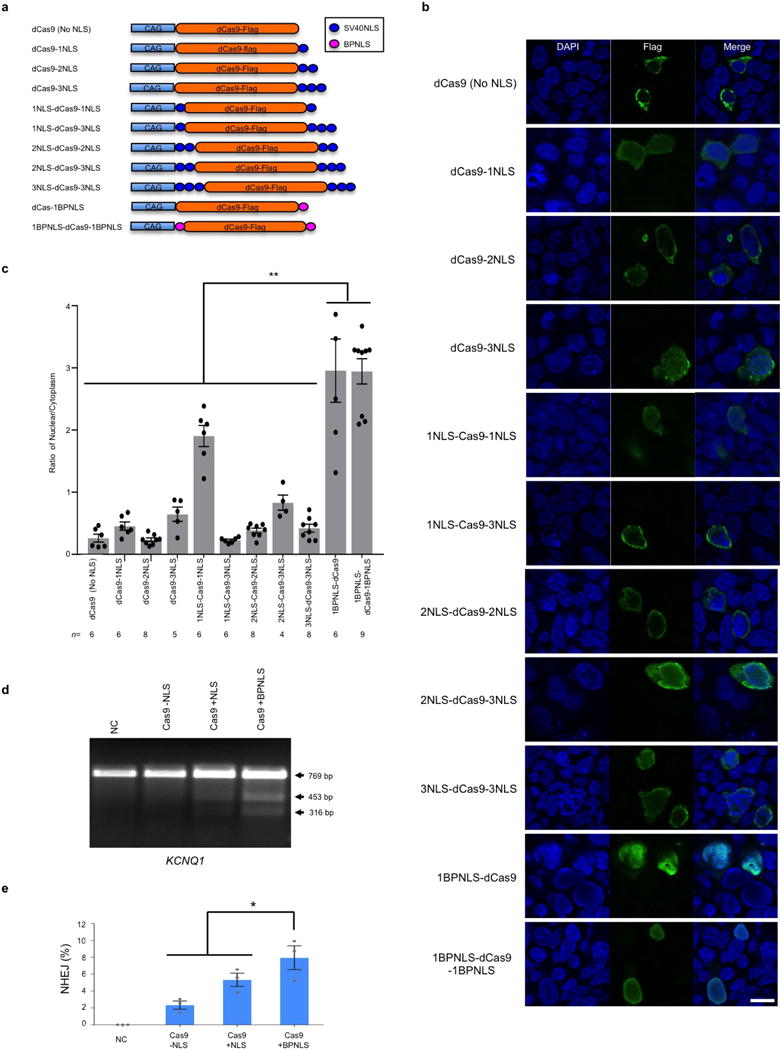
a, Schematic representation of a series of dCas9-Flag constructs with different nuclear localization signals. b, Representative immunofluorescence images of the transfected HEK293 cells stained with Flag antibody to visualize dCas9 localization. DNA was counterstained with DAPI. Scale bar, 50 μm. c, The nuclear/cytoplasm ratio of dCas9 with different NLS signals. n, number of analysed cells. Results were presented as mean ± s.e.m. The input data points were shown as black dots. **P < 0.01, unpaired Student’s t-test. d, e, Characterization of Cas9 nuclease activity in human ES cells. Agarose gel image (d) and quantification (e) show Surveyor nuclease assay performed with the gRNA targeting KCNQ1 gene and Cas9 with different NLSs, that is, Cas9 -NLS (Cas9 (no NLS)), Cas9 +NLS (1NLS-Cas9-1NLS) and Cas9 +BPNLS (1BPNLS-Cas9-1BPNLS). The two lower bands are cleaved DNA products by Surveyor nuclease. NHEJ (%) indicates the percentage of Cas9/gRNA-mediated gene modification. Results were obtained from three technical replicates and presented as mean ± s.e.m. The input data points were shown as black dots. *P < 0.05, paired Student’s t-test. For gel source image, see Supplementary Fig. 1. For source data, see Supplementary Table 7.
Extended Data Figure 4. In-depth analyses of GFP knock-in in mouse primary neurons.
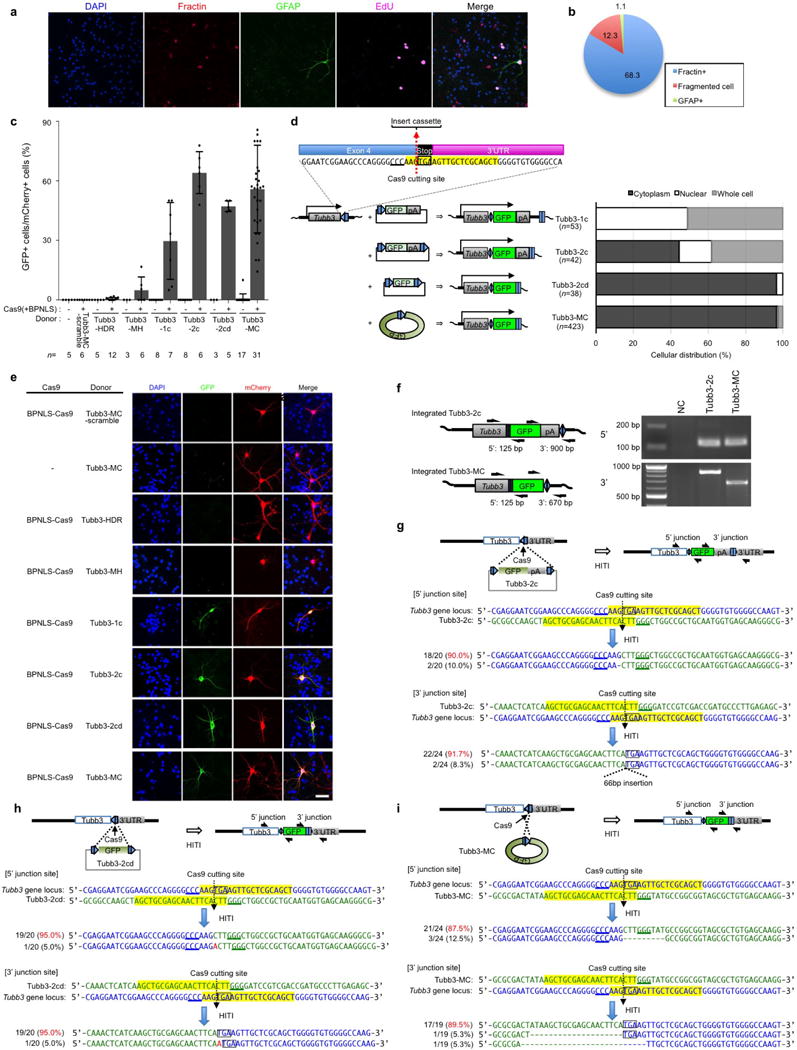
a, b, Characterization of cultured primary neurons. Representative immunofluorescence images (a) and quantification (b) show that all of the neurons are EdU negative in this culture condition. All EdU+ cells were GFAP-positive glia, fractin-positive apoptotic cells, or fragmented cells. Results were obtained from 15 technical replicates and presented as mean. c, The percentage of knock-in cells (GFP+) per transfected cells (mCherry+) with HDR donor (Tubb3-HDR), PITCh donor (Tubb3-MH), 1-cut donor (Tubb3-1c), 2-cut donor (Tubb3-2c), 2-cut donor without polyA (Tubb3-2cd), or minicircle donor (Tubb3-MC). n, number of technical replicates. Results were presented as mean ± s.d. The input data points were shown as black dots. d, Left panel, schematic showing inserted DNA sequences, with or without bacteria backbone, with different HITI donors. Blue pentagon and yellow highlight, Cas9/gRNA target sequence. Black line within blue pentagon, Cas9 cleavage site. Underlined sequence, PAM sequence. pA, polyA. Right panel, subcellular distribution of TUBB3-GFP. n, number of analysed cells. e, Representative fluorescence images of the primary neurons transfected with BPNLS-Cas9, gRNA, and different donor plasmids (Tubb3-MC-scramble, Tubb3-HDR, Tubb3-MH, Tubb3-1c, Tubb3-2c, Tubb3-2cd or Tubb3-MC). Different intracellular localization patterns of TUBB3-GFP were observed for different donors. Scale bar, 100 μm. f, Left panel, schematic of knock-in by Tubb3-2c and Tubb3-MC donor at the 5′ and 3′ ends of Tubb3 coding region. Black half-arrows indicate PCR primers for detecting integrated sequences. Right panel shows the PCR result. g–i, Sequences of the 5′ and 3′ junction sites after GFP knock-in by HITI in mouse primary neurons with Tubb3-2c (g), Tubb3-2cd (h) and Tubb3-MC (i) donor plasmids. For gel source images, see Supplementary Fig. 1. For source data, see Supplementary Table 8.
Extended Data Figure 5. HITI-mediated GFP knock-in in neurons in vitro and in vivo.
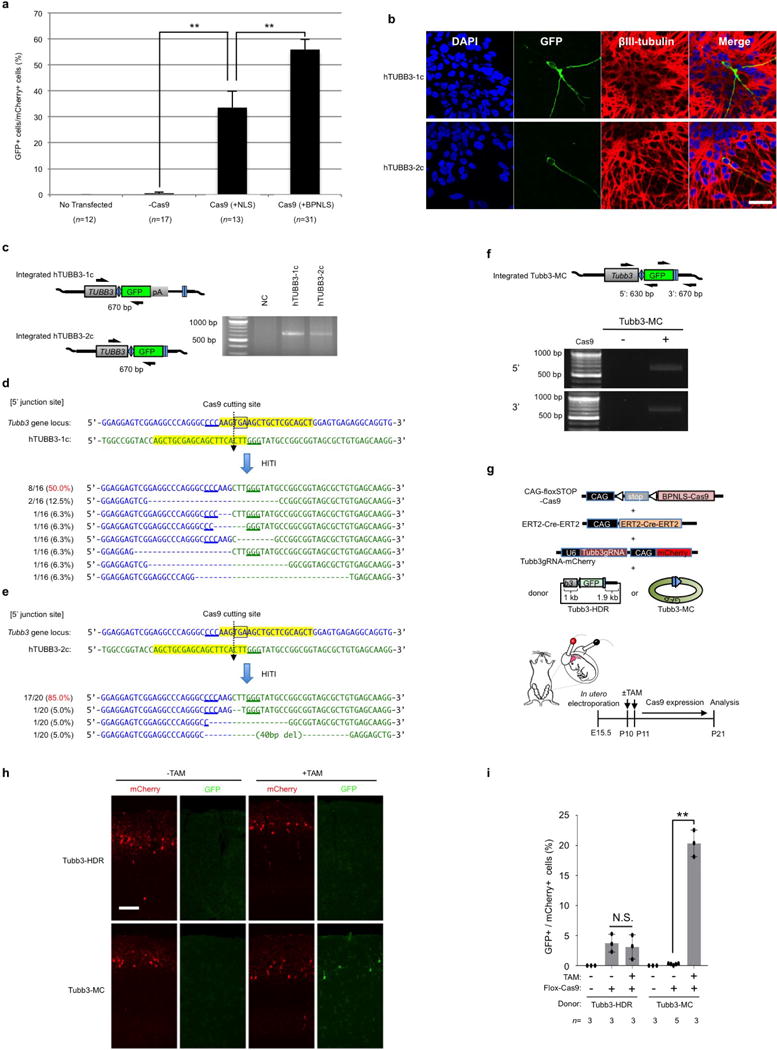
a, The percentage of knock-in (GFP+) cells in mouse primary neurons per transfected cells (mCherry+) with empty vector (−Cas9), Cas9 (+NLS) and Cas9 (+BPNLS). n, number of technical replicates. Results were presented as mean ± s.e.m. **P< 0.01, unpaired Student’s t-test. b, Representative immunofluorescence images of human ES cell-derived pan neurons transfected with BPNLS-Cas9, gRNA, and different donor plasmids (hTUBB3-1c or hTUBB3-2c). Scale bar, 100 μm. c, PCR analysis of integrated GFP gene at TUBB3 locus in human ES cell-derived pan neurons. d, e, Sequences of the 5′ junction sites after GFP knock-in by HITI in human ES cell-derived pan neurons with TUBB3-1c donor (d) and TUBB3-2c donor (e). f, Upper panel, schematic of GFP knock-in at the 3′ end of the Tubb3 coding region via Tubb3-MC donor in the neonatal mouse brain. Black half-arrows indicate PCR primers for detecting integrated sequences. Lower panel, genomic PCR results showing transgene integration at both 5′ and 3′ ends. g, Schematic of in vivo targeted GFP knock-in by HITI in the neonatal mouse brain. CAG-floxSTOP-Cas9, inducible BPNLS-Cas9 expression plasmid. ERT2-Cre-ERT2, tamoxifen (TAM) inducible Cre expression plasmid. Donor plasmids: Tubb3-HDR or Tubb3-MC. Tamoxifen was injected at P10 and P11. Mice were analysed at P21. h, Representative fluorescence images of GFP knock-in at the Tubb3 locus in neonatal mouse brain by inducible Cas9 expression with HDR donor (Tubb3-HDR) or minicircle HITI donor (Tubb3-MC). Scale bar, 100 μm. i, Relative knock-in efficiencies of HDR and HITI donors with or without tamoxifen treatment. n, number of pups obtained from two pregnant mice. Results were presented as mean ± s.d. The input data points were shown as black dots. **P <0.01. N.S., not significant. Unpaired student’s t-test. For gel source images, see Supplementary Fig. 1. For source data, see Supplementary Table 9.
Extended Data Figure 6. HITI via in vivo DNA transfection.
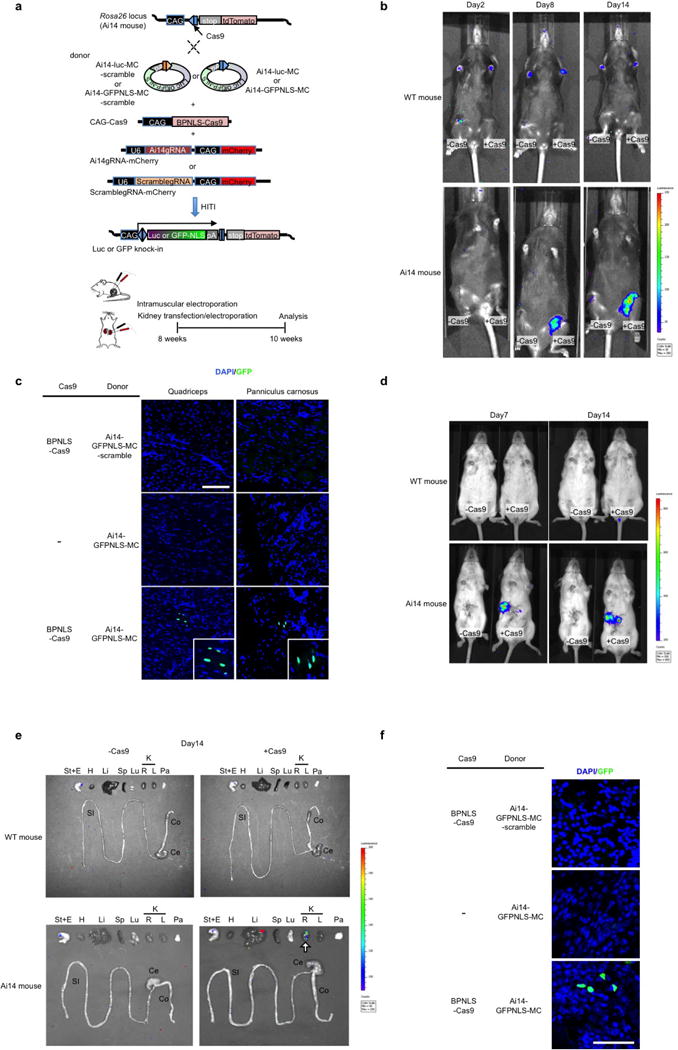
a, Schematic for in vivo targeted GFP-NLS or luciferase gene knock-in by HITI. CAG-Cas9, gRNA (Ai14gRNA or Scramble-gRNA)-mCherry and minicircle donor (Ai14-GFPNLS-MC-scramble, Ai14-luc-MC-scramble, Ai14-GFPNLS-MC or Ai14-luc-MC) were locally delivered to mouse kidney or muscle via pressure-mediated transfection and/or electroporation at 8 postnatal weeks and analysed 2 weeks later. b, In vivo imaging of luciferase signals at day 2, day 8, and day 14 postintramuscular injection of luciferase HITI constructs. Right leg (−Cas9) was injected with empty plasmid, Ai14gRNA-mCherry, and Ai14-luc-MC. Left leg (+Cas9) was injected with CAG-Cas9, Ai14gRNA-mCherry, and Ai14-luc-MC. Top, control wild-type (WT) mouse. Bottom, Ai14 mouse. c, Representative immunofluorescence images of GFP expression after intramuscular electroporation of GFP-NLS HITI constructs into Ai14 mouse quadriceps (left panel) and panniculus carnosus (right panel). Top panel, donor-cut only control (CAG-Cas9, Scramble-gRNA-mCherry, and Ai14-GFPNLS-MC-scramble). Middle panel, no Cas9 control (empty plasmid, Ai14gRNA-mCherry, and Ai14-GFPNLS-MC). Bottom panel, GFP-NLS HITI (CAG-Cas9, Ai14gRNA-mCherry, and Ai14-GFPNLS-MC). Insets, higher magnification images. Scale bar, 100 μm. d, In vivo imaging of luciferase signals at days 7 and 14 after pressure-mediated kidney transfection of luciferase HITI constructs. Left mouse (−Cas9) was delivered with empty plasmid, Ai14gRNA-mCherry and Ai14-luc-MC. Right mouse (+Cas9) was delivered with CAG-Cas9, Ai14gRNA-mCherry and Ai14-luc-MC. Top, control wild-type mouse. Bottom, Ai14 mouse. e, Ex vivo luciferase imaging of stomach and oesophagus (St+E), heart (H), liver (Li), spleen (Sp), lungs (Lu), right (R) and left (L) kidney (K), pancreas (Pa), small intestine (SI), caecum (Ce) and colon (Co). Arrow shows luciferase signal in the right kidney. Top, wild-type mouse. Bottom, Ai14 mouse. f, Representative immunofluorescence images of GFP expression after electroporation of GFP-NLS HITI constructs into Ai14 mouse kidney. Top panel, donorcut only control (CAG-Cas9, Scramble-gRNA-mCherry and Ai14-GFPNLS-MC-scramble). Middle panel, no Cas9 control (empty plasmid, Ai14gRNA-mCherry and Ai14-GFPNLS-MC). Bottom panel, GFp-NLS HITI (CAG-Cas9, Ai14gRNA-mCherry and Ai14-GFPNLS-MC). Scale bar, 100 μm.
Extended Data Figure 7. AAV8-mediated HITI in cultured mouse primary neurons.
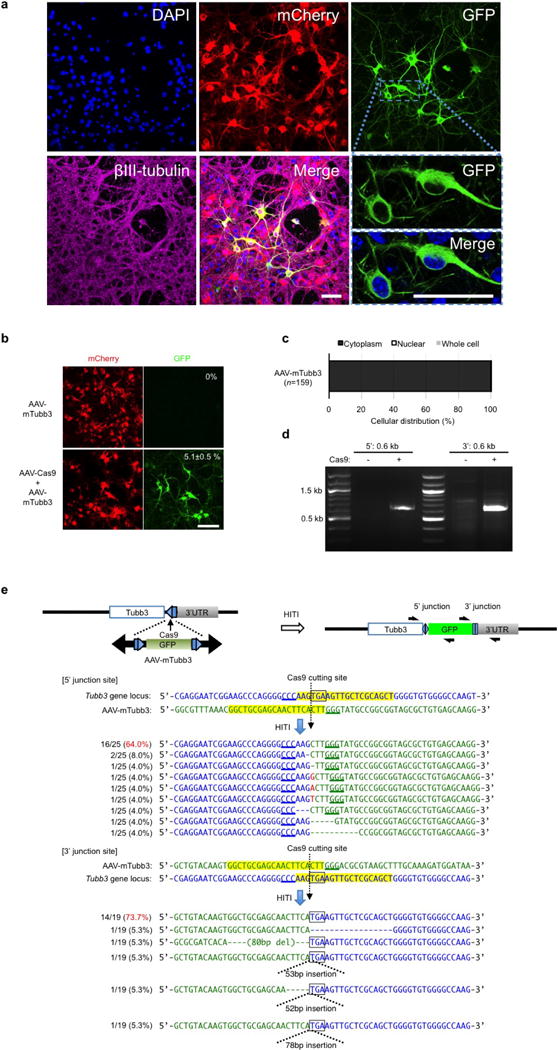
a, Representative immunofluorescence images of neurons infected with AAV-Cas9 and AAV-mTubb3. AAVs were packaged with serotype 8. Insets, higher magnification images. Scale bar, 50 μm. b, Representative immunofluorescence images of GFP knock-in at the Tubb3 locus in pan neurons after AAV8 infections. Top panel, AAV-mTubb3 only. Bottom panel, AAV-Cas9 and AAV-mTubb3. Scale bar, 100 μm. The absolute GFP knock-in efficiency was shown in the upper right corner of the picture. Results were obtained from three technical replicates and presented as mean ± s.d. c, Intracellular distribution of the GFP expression after AAV8 infection (AAV-Cas9 and AAV-mTubb3). n, number of analysed cells. d, Validation of correct gene knock-in by PCR. e, Sequences of the 5′ and 3′ junction sites after GFP knock-in by HITI. For gel source image, see Supplementary Fig. 1. For source data, see Supplementary Table 10.
Extended Data Figure 8. HITI via in vivo local injection of AAVs.
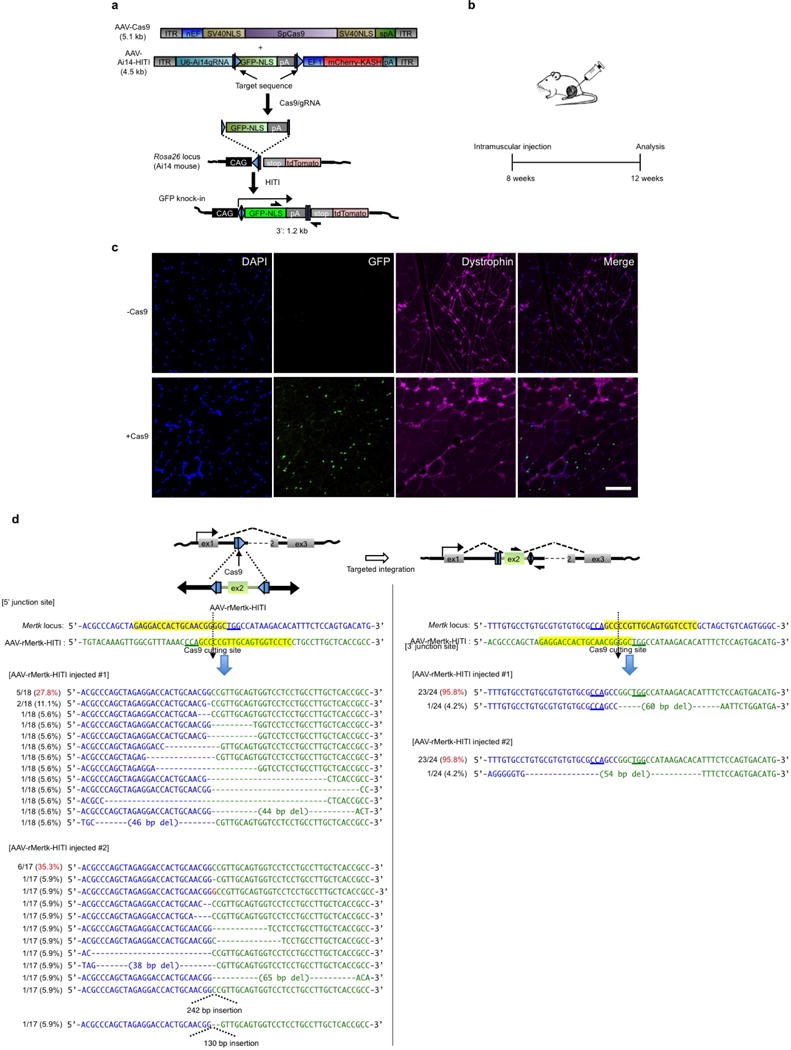
a, Schematic of AAV vectors for inserting GFP-NLS downstream of the CAG promoter at the Ai14 Rosa26 locus. The AAVs were packaged with serotype 8. Half-arrows indicate PCR primers to validate correct gene knock-in. b, Schematic of the experimental design for in vivo targeted GFP-NLS gene knock-in by HITI via intramuscular (IM) injection in Ai14 mice. AAV8s (AAV-Cas9 and AAV-Ai14-HITI) were injected into quadriceps at 8 postnatal weeks and analysed at 12 weeks. c, Immunofluorescence analysis of GFP expression after IM delivery of AAV8s. Top panel, no Cas9 control (AAV-Ai14-HITI only). Bottom panel, GFP-NLS HITI (AAV-Cas9 and AAV-Ai14-HITI). Dystrophin was used as a marker for muscle cytoskeletal protein. Scale bar, 100 μm. d, Schematic and sequencing analyses of 5′ and 3′ junctions of the integration sites for Mertk exon 2 inserted by HITI in the eyes of RCS rats.
Extended Data Figure 9. HITI-mediated GFP-NLS knock-in via systemic intravenous injection in neonatal Ai14 mice.
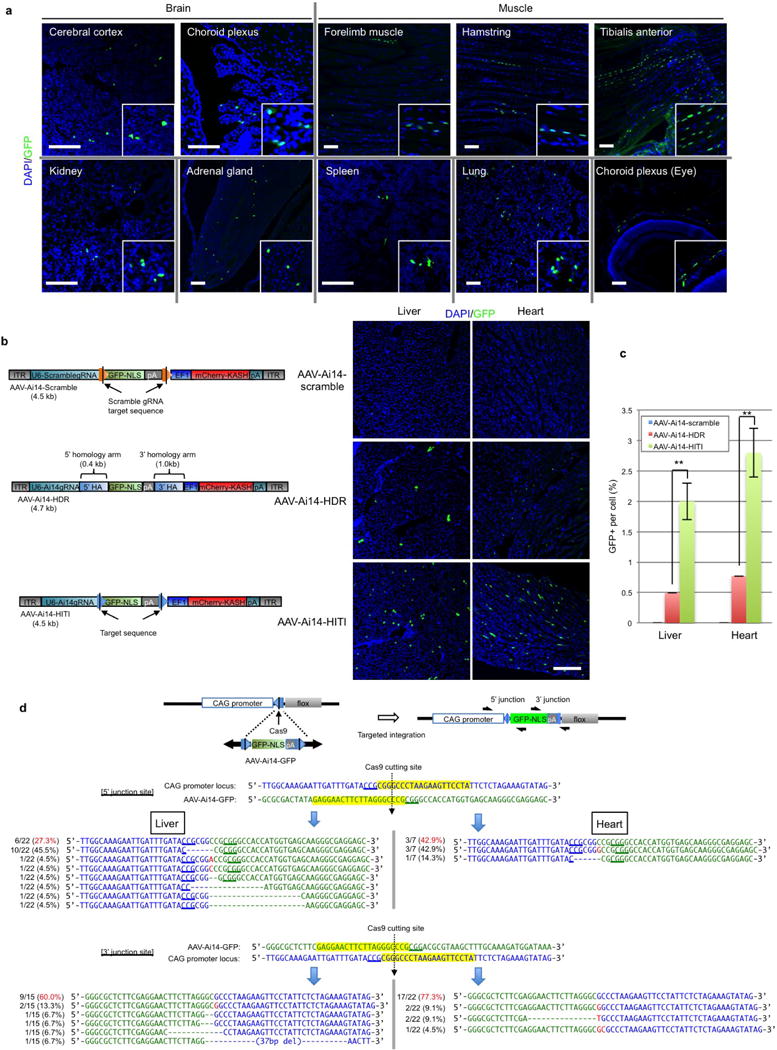
a, Representative immunofluorescence images of GFP expression in the brain, muscle, kidney, adrenal gland, spleen, lung and choroid plexus of the eye after intravenous injection of AAV-Cas9 and AAV-Ai14-HITI. AAVs were packaged with serotype 8. Insets, higher magnification images. Scale bar, 100 μm. b, Comparison of HDR-and HITI-mediated targeted gene knock-in via systemic intravenous injection in neonatal mice. Left panel shows a schematic of AAV vectors for knock-in GFP downstream of the CAG promoter at the Ai14 Rosa26 locus. AAV-Ai14-scramble was used as a donor cut-only control. The HDR donor (AAV-Ai14-HDR) has homology arms at both ends of the GFP-NLS-pA cassette. The AAVs were packaged with serotype 8 and co-infected with AAV-Cas9 via IV, same as Fig. 4a. c, Absolute knock-in efficiency measured by the percentage of GFP+ cells in the liver and heart by HDR or HITI. Results were obtained from five slides and presented as mean ± s.d. **P < 0.01, unpaired Student’s t-test. d, Sequencing analyses of the 5′ and 3′ junction sites of heart and liver cells after GFP-NLS knock-in by HITI via intravenous AAV injections. For source data, see Supplementary Table 11.
Extended Data Figure 10. HITI via in vivo systemic injection of AAVs in mice.
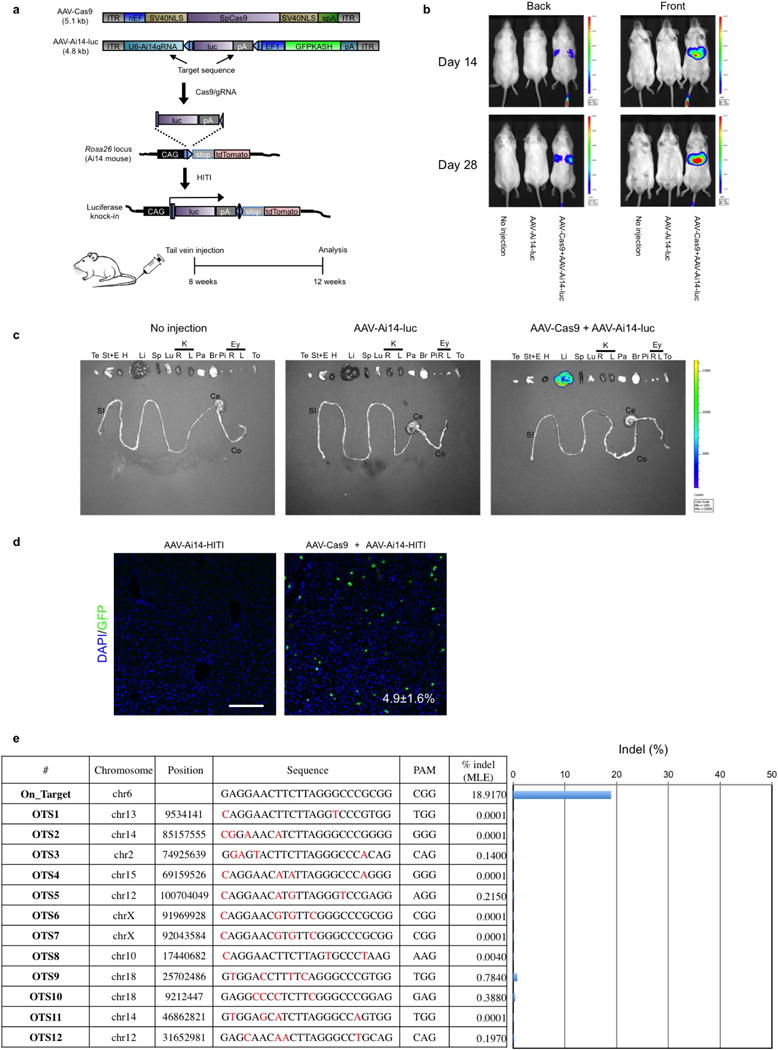
a, Schematic of AAVs for knock-in luciferase downstream of the CAG promoter at the Ai14 Rosa26 locus. AAVs (AAV-Cas9 and AAV-Ai14-luc) were systemically delivered via tail vein injection in 8-week-old Ai14 mice and analysed at 12 weeks. The AAVs were packaged with serotype 9. b, In vivo imaging of luciferase signals at days 14 and 28 post-tail vein injection of luciferase HITI constructs. c, Ex vivo luciferase imaging analysis of testis (Te), stomach and oesophagus (St+E), heart (H), liver (Li), spleen (Sp), lungs (Lu), right (R) and left (L) kidney (K), pancreas (Pa), brain (Br), pituitary (Pi), right (R) and left (L) eye, (Ey), Tongue (To), small intestine (SI), caecum (Ce) and colon (Co). d, Representative immunofluorescence images of GFP expression in the liver after tail vein injection of HITI GFP-NLS gene knock-in AAV9. The absolute efficiency of GFP knock-in was shown in the bottom right corner. Results were obtained from five slides and presented as mean ± s.d. Scale bar, 200 μm. e, A list of on-and off-target sites that were used to determine the indel frequency of HITI mediated genome modifications using genomic DNA isolated from the liver. The nucleotide letters shown in red are the individual mismatches in predicted off-target sites.
Supplementary Material
Acknowledgments
We are grateful to M. Kay, Z. Y. Chen, G. Lemke and P G. Burrola for sharing experimental materials; J. Naughton, L. Lisowski and J. Marlett for AAV production; C. Fine, J. Olvera, E. O’Connor and K. E. Marquez for cell sorting; D. Okamura and M. Jacobs for mouse surgery an< histology processing; D. Skowronska-Krawczyk for rat experiments; N. V. Gohad, T Whitfield, I. M. Verma, J. Ogawa, T Hara, U. Manor and J. Santini for imaging; L. Greg, Y. S. Kida and F. Osakada for valuable discussions; D. O’Keefe for proofreading the manuscript and M. Schwarz for administrative help. Core Facilities were utilized at the Salk Institute (support from: NIH-NCI CCSG: P30 014195, NINDS R24NS092943, and NEI P30 EY019005) and UCSD Neuroscience core grant P30 NS047101. R.H.B. was supported by a CONACYT fellowship of Mexico. J.Z. and TJ. were supported by 973 Program (2013CB967504, 2015CB964600) and 863 Program (2014AA021604). TH. was partially supported by a Nomis Foundation Fellowship. E.J.K. is a Biogen-IDEC Fellow of the Life Science Research Foundation. M.Y was partially supported by the Salk Women & Science Special Award. X.F. was supported by NSFC (No. 81601872). G.H.L. and J.Q. were supported by the National Basic Research Program of China (973 Program; 2015CB964800, 2014CB910503, 2013CB967504), National Natural Science Foundation of China (81625009, 81371342, 81271266), the National High Technology Research and Development Program of China (2015AA020307, 2014AA021604), and Program of Beijing Municipal Science and Technology Commission (Z151100003915072). FM. was supported by RIKEN funding for Development and Regeneration. Ku.Z. was supported by NlH grant R01HL123755. PJ.M. and J.C.I.B. were supported by the King Abdullah University of Science and Technology (KAUST) Office of Sponsored Research (OSR) under award no. OSR-2015-CRG4-2631. Work in the laboratory of J.C.I.B. was supported by The Leona M. and Harry B. Helmsley Charitable Trust (2012-PG-MED002), the G. Harold and Leila Y Mathers Charitable Foundation, NIH (R01HL123755), The McKnight Foundation, The Moxie Foundation, Fundacion Dr. Pedro Guillen and Universidad Católica San Antonio de Murcia (UCAM).
Footnotes
Online Content Methods, along with any additional Extended Data display Items and Source Data, are available in the online version of the paper; references unique to these sections appear only in the online paper.
Supplementary Information is available in the online version of the paper.
Author Contributions K.S., YT, R.H.B., J.W. and J.C.I.B. conceived the project and designed experiments. K.S., Y.T and E.A. constructed plasmids. K.S., R.H.B., M.Y and M.L. generated minicircle DNA vectors. K.S., YT, R.H.B., M.L., E.A., A.G. and R.D.S. performed work on HEK293 cells. K.S., YT, R.H.B. and E.A. performed bisulfite sequencing. K.S., YT and R.H.B. measured intracellular localization of dCas9. K.S. and Y.T performed the Surveyor assay. R.H.B. performed work on primary neurons. K.S., Y.T., R.H.B., E.A. and A.G. performed work on human ES-cell-derived pan neurons. Y.T. and F.M. performed work on in utero electroporation. J.Z., T.J., X.F., M.J. and Ka.Z. performed work on RCS rats. E.J.K. and E.M.C. performed work on adult mouse brain. F.H., TA., M.K. and T.H. performed in vivo mouse electroporation. F.H., M.Y and TA. performed AAV IV and IM injection in neonatal or adult mice. Z.L., S.G., S.C. and Ku.Z. performed deep sequencing and analysed data. K.S. and E.A. performed single-cell genotyping. J.W., J.Q., C.R.E, W.T.B., J.L., E.N.D., PG., J.M.C., G.H.L., PM. and J.C.I.B. supervised the project or related experiments. K.S., Y.T., J.W. and J.C.I.B. wrote the manuscript with input from all the authors.
The authors declare no competing financial interests. Readers are welcome to comment on the online version of the paper.
Reviewer Information Nature thanks M. Porteus and the other anonymous reviewer(s) for their contribution to the peer review of this work.
References
- 1.Naldini L. Gene therapy returns to centre stage. Nature. 2015;526:351–360. doi: 10.1038/nature15818. [DOI] [PubMed] [Google Scholar]
- 2.Cox DBT, Platt RJ, Zhang F. Therapeutic genome editing: prospects and challenges. Nat Med. 2015;21:121–131. doi: 10.1038/nm.3793. [DOI] [PMC free article] [PubMed] [Google Scholar]
- 3.Mali P, et al. RNA-guided human genome engineering via Cas9. Science. 2013;339:823–826. doi: 10.1126/science.1232033. [DOI] [PMC free article] [PubMed] [Google Scholar]
- 4.Cong L, et al. Multiplex genome engineering using CRISPR/Cas systems. Science. 2013;339:819–823. doi: 10.1126/science.1231143. [DOI] [PMC free article] [PubMed] [Google Scholar]
- 5.Lombardo A, et al. Site-specific integration and tailoring of cassette design for sustainable gene transfer. Nat Methods. 2011;8:861–869. doi: 10.1038/nmeth.1674. [DOI] [PubMed] [Google Scholar]
- 6.Genovese P, et al. Targeted genome editing in human repopulating haematopoietic stem cells. Nature. 2014;510:235–240. doi: 10.1038/nature13420. [DOI] [PMC free article] [PubMed] [Google Scholar]
- 7.Luchetti A, Malgieri A, Sangiuolo F. Small fragment homologous replacement (SFHR): sequence-specific modification of genomic DNA in eukaryotic cells by small DNA fragments. Methods Mol Biol. 2014;1114:85–101. doi: 10.1007/978-1-62703-761-7_6. [DOI] [PubMed] [Google Scholar]
- 8.Orthwein A, et al. A mechanism for the suppression of homologous recombination in G1 cells. Nature. 2015;528:422–426. doi: 10.1038/nature16142. [DOI] [PMC free article] [PubMed] [Google Scholar] [Retracted]
- 9.Lieber MR. The mechanism of double-strand DNA break repair by the nonhomologous DNA end-joining pathway. Annu Rev Biochem. 2010;79:181–211. doi: 10.1146/annurev.biochem.052308.093131. [DOI] [PMC free article] [PubMed] [Google Scholar]
- 10.Bétermier M, Bertrand P, Lopez BS. Is non-homologous end-joining really an inherently error-prone process? PLoS Genet. 2014;10:e1004086. doi: 10.1371/journal.pgen.1004086. [DOI] [PMC free article] [PubMed] [Google Scholar]
- 11.Maresca M, Lin VG, Guo N, Yang Y. Obligate ligation-gated recombination (ObLiGaRe): custom-designed nuclease-mediated targeted integration through nonhomologous end joining. Genome Res. 2013;23:539–546. doi: 10.1101/gr.145441.112. [DOI] [PMC free article] [PubMed] [Google Scholar]
- 12.Auer TO, Duroure K, De Cian A, Concordet J-P, Del Bene F. Highly efficient CRISPR/Cas9-mediated knock-in in zebrafish by homology-independent DNA repair. Genome Res. 2014;24:142–153. doi: 10.1101/gr.161638.113. [DOI] [PMC free article] [PubMed] [Google Scholar]
- 13.Nakade S, et al. Microhomology-mediated end-joining-dependent integration of donor DNA in cells and animals using TALENs and CRlSPR/Cas9. Nat Commun. 2014;5:5560. doi: 10.1038/ncomms6560. [DOI] [PMC free article] [PubMed] [Google Scholar]
- 14.Chen Z-Y, et al. Linear DNAs concatemerize in vivo and result in sustained transgene expression in mouse liver. Mol Ther. 2001;3:403–410. doi: 10.1006/mthe.2001.0278. [DOI] [PubMed] [Google Scholar]
- 15.Chen Z-Y, He C-Y, Ehrhardt A, Kay MA. Minicircle DNA vectors devoid of bacterial DNA result in persistent and high-level transgene expression in vivo. Mol Ther. 2003;8:495–500. doi: 10.1016/s1525-0016(03)00168-0. [DOI] [PubMed] [Google Scholar]
- 16.Wu J, Corbett AH, Berland KM. The intracellular mobility of nuclear import receptors and NLS cargoes. Biophys J. 2009;96:3840–3849. doi: 10.1016/j.bpj.2009.01.050. [DOI] [PMC free article] [PubMed] [Google Scholar]
- 17.Kameda Y, Kameya T, Frankfurter A. Immunohistochemical localization of a neuron-specific β-tubulin isotype in the developing chicken ultimobranchial glands. Brain Res. 1993;628:121–127. doi: 10.1016/0006-8993(93)90946-k. [DOI] [PubMed] [Google Scholar]
- 18.Tabata H, Nakajima K. Efficient in utero gene transfer system to the developing mouse brain using electroporation: visualization of neuronal migration in the developing cortex. Neuroscience. 2001;103:865–872. doi: 10.1016/s0306-4522(01)00016-1. [DOI] [PubMed] [Google Scholar]
- 19.Mizutani K, Saito T. Progenitors resume generating neurons after temporary inhibition of neurogenesis by Notch activation in the mammalian cerebral cortex. Development. 2005;132:1295–1304. doi: 10.1242/dev.01693. [DOI] [PubMed] [Google Scholar]
- 20.Madisen L, et al. A robust and high-throughput Cre reporting and characterization system for the whole mouse brain. Nat Neurosci. 2010;13:133–140. doi: 10.1038/nn.2467. [DOI] [PMC free article] [PubMed] [Google Scholar]
- 21.Samulski RJ, Muzyczka N. AAV-mediated gene therapy for research and therapeutic purposes. Annu Rev Virol. 2014;1:427–451. doi: 10.1146/annurev-virology-031413-085355. [DOI] [PubMed] [Google Scholar]
- 22.Bainbridge JWB, et al. Effect of gene therapy on visual function in Leber’s congenital amaurosis. N Engl J Med. 2008;358:2231–2239. doi: 10.1056/NEJMoa0802268. [DOI] [PubMed] [Google Scholar]
- 23.Maguire AM, et al. Safety and efficacy of gene transfer for Leber’s congenital amaurosis. N Engl J Med. 2008;358:2240–2248. doi: 10.1056/NEJMoa0802315. [DOI] [PMC free article] [PubMed] [Google Scholar]
- 24.Nathwani AC, et al. Long-term safety and efficacy of factor IX gene therapy in hemophilia B. N Engl J Med. 2014;371:1994–2004. doi: 10.1056/NEJMoa1407309. [DOI] [PMC free article] [PubMed] [Google Scholar]
- 25.Zincarelli C, Soltys S, Rengo G, Rabinowitz JE. Analysis of AAV serotypes 1–9 mediated gene expression and tropism in mice after systemic injection. Mol Ther. 2008;16:1073–1080. doi: 10.1038/mt.2008.76. [DOI] [PubMed] [Google Scholar]
- 26.Luo J, et al. Human retinal progenitor cell transplantation preserves vision. J Biol Chem. 2014;289:6362–6371. doi: 10.1074/jbc.M113.513713. [DOI] [PMC free article] [PubMed] [Google Scholar]
- 27.D’Cruz PM, et al. Mutation of the receptor tyrosine kinase gene Mertk in the retinal dystrophic RCS rat. Hum Mol Genet. 2000;9:645–651. doi: 10.1093/hmg/9.4.645. [DOI] [PubMed] [Google Scholar]
- 28.Boyden ES, Zhang F, Bamberg E, Nagel G, Deisseroth K. Millisecond-timescale, genetically targeted optical control of neural activity. Nat Neurosci. 2005;8:1263–1268. doi: 10.1038/nn1525. [DOI] [PubMed] [Google Scholar]
- 29.Izpisua Belmonte JC, et al. Brains, genes, and primates. Neuron. 2015;86:617–631. doi: 10.1016/j.neuron.2015.03.021. [DOI] [PMC free article] [PubMed] [Google Scholar]
- 30.Wu J, et al. An alternative pluripotent state confers interspecies chimaeric competency. Nature. 2015;521:316–321. doi: 10.1038/nature14413. [DOI] [PMC free article] [PubMed] [Google Scholar]
- 31.Shitamukai A, Konno D, Matsuzaki F. Oblique radial glial divisions in the developing mouse neocortex induce self-renewing progenitors outside the germinal zone that resemble primate outer subventricular zone progenitors. J Neurosci. 2011;31:3683–3695. doi: 10.1523/JNEUROSCI.4773-10.2011. [DOI] [PMC free article] [PubMed] [Google Scholar]
- 32.Liu GHG, et al. Targeted gene correction of laminopathy-associated LMNA mutations in patient-specific iPSCs. Cell Stem Cell. 2011;8:688–694. doi: 10.1016/j.stem.2011.04.019. [DOI] [PMC free article] [PubMed] [Google Scholar]
- 33.Liu GHG, et al. Recapitulation of premature ageing with iPSCs from Hutchinson-Gilford progeria syndrome. Nature. 2011;472:221–225. doi: 10.1038/nature09879. [DOI] [PMC free article] [PubMed] [Google Scholar]
- 34.Kay MA, He C-Y, Chen Z-Y. A robust system for production of minicircle DNA vectors. Nat Biotechnol. 2010;28:1287–1289. doi: 10.1038/nbt.1708. [DOI] [PMC free article] [PubMed] [Google Scholar]
- 35.Sanjana NE, et al. A transcription activator-like effector toolbox for genome engineering. Nat Protocols. 2012;7:171–192. doi: 10.1038/nprot.2011.431. [DOI] [PMC free article] [PubMed] [Google Scholar]
- 36.Kutner RH, Zhang XY, Reiser J. Production, concentration and titration of pseudotyped HIV-1-based lentiviral vectors. Nat Protocols. 2009;4:495–505. doi: 10.1038/nprot.2009.22. [DOI] [PubMed] [Google Scholar]
- 37.Liu GHG, et al. Modelling Fanconi anemia pathogenesis and therapeutics using integration-free patient-derived iPSCs. Nat Commun. 2014;5:4330. doi: 10.1038/ncomms5330. [DOI] [PMC free article] [PubMed] [Google Scholar]
- 38.Takahashi M, Nomura T, Osumi N. Transferring genes into cultured mammalian embryos by electroporation. Dev Growth Differ. 2008;50:485–497. doi: 10.1111/j.1440-169X.2008.01046.x. [DOI] [PubMed] [Google Scholar]
- 39.Mukai H, Kawakami S, Hashida M. Renal press-mediated transfection method for plasmid DNA and siRNA to the kidney. Biochem Biophys Res Commun. 2008;372:383–387. doi: 10.1016/j.bbrc.2008.04.097. [DOI] [PubMed] [Google Scholar]
- 40.Lampe SEG, Kaspar BK, Foust KD. Intravenous injections in neonatal mice. J Vis Exp. 2014:e52037. doi: 10.3791/52037. [DOI] [PMC free article] [PubMed] [Google Scholar]
- 41.Pasut A, Oleynik P, Rudnicki MA. Isolation of muscle stem cells by fluorescence activated cell sorting cytometry. Methods Mol Biol. 2012;798:53–64. doi: 10.1007/978-1-61779-343-1_3. [DOI] [PubMed] [Google Scholar]
- 42.Pinto AR, Chandran A, Rosenthal NA, Godwin JW. Isolation and analysis of single cells from the mouse heart. J Immunol Methods. 2013;393:74–80. doi: 10.1016/j.jim.2013.03.012. [DOI] [PubMed] [Google Scholar]
- 43.Hsu PD, et al. DNA targeting specificity of RNA-guided Cas9 nucleases. Nat Biotechnol. 2013;31:827–832. doi: 10.1038/nbt.2647. [DOI] [PMC free article] [PubMed] [Google Scholar]
- 44.Li H, Durbin R. Fast and accurate short read alignment with Burrows-Wheeler transform. Bioinformatics. 2009;25:1754–1760. doi: 10.1093/bioinformatics/btp324. [DOI] [PMC free article] [PubMed] [Google Scholar]
- 45.Sauvé Y, Lu B, Lund RD. The relationship between full field electroretinogram and perimetry-like visual thresholds in RCS rats during photoreceptor degeneration and rescue by cell transplants. Vision Res. 2004;44:9–18. doi: 10.1016/j.visres.2003.08.015. [DOI] [PubMed] [Google Scholar]
Associated Data
This section collects any data citations, data availability statements, or supplementary materials included in this article.
Supplementary Materials
Data Availability Statement
The analysis for insertion and deletion (indel) events and Maximum Likelihood Estimate (MLE) calculation were done as previously described43. All custom scripts can be provided upon request. Raw Illumina sequencing reads for this study have been deposited in the National Center for Biotechnology Information Short Read Archive and accessible through SRA accession number SRP069844.


