Abstract
Several transgenic mouse models with disruption in the growth hormone (GH) axis support the role of GH in augmenting metabolic homeostasis. Specifically, interest has focused on GH’s lipolytic properties and ability to affect adipose deposition. Furthermore, both GH and insulin growth factor 1 (IGF-1) may also play a direct or indirect role in adipose development. The somatotroph insulin-like growth factor-1 receptor knockout (SIGFRKO) mouse with only a modest increase in serum GH and IGF-1 demonstrates less adipose tissue than controls. In order to characterize the metabolic phenotype of SIGFRKO mice, histologic analysis of fat depots confirmed a smaller average diameter of adipocytes in the SIGFRKO mice compared to controls. These changes were accompanied by an increase in lipolytic gene expression in fat depots. Indirect calorimetry performed on 6-8 week old male mice and again at 25 weeks of age demonstrated that SIGFRKO mice, at both ages, had a higher VO2 and increased energy expenditure when compared with controls. The calculated respiratory exchange ratio (RER) was lower in the younger SIGFRKO mice compared to controls. No differences in food consumption or in either ambulatory or total activity were seen between SIGFRKO and control mice in either age group. These studies highlight the role of GH in adipose deposition and its influence on the expression of lipolytic genes resulting in an altered metabolic state, thus providing a mechanism for the decrease in weight gain seen in the SIGFRKO mouse model.
Keywords: Growth hormone, Adipose, Indirect Calorimetry
1. INTRODUCTION
Growth hormone (GH), which is most well-known for its effect on the musculoskeletal system leading to increased somatic growth, also plays an important metabolic role by its effect on lipid deposition [1-4]. Given the continued rise in the rates of obesity worldwide, there is ongoing interest in defining a role for GH to limit the morbidity related to excess adiposity [5]. Several studies, which demonstrate GH stimulation of lipolysis as well as a decrease in fatty acid synthesis have been performed in both rodents and humans [6-12]. In addition, transgenic animal models in which GH production or action have been altered provide further insight into the complexity of metabolic targets for GH [13-20]. Therefore, a physiologic mechanism(s) by which GH can either limit fat deposition and/or reverse obesity still requires further investigation. Although adipose tissue plays an important endocrine role [21], mechanisms by which GH can directly or indirectly target specific lipolytic genes have not been clearly elucidated [11, 22-24]. In addition to targeting white adipose tissue, GH has also been studied for its possible role in the function and regulation of brown adipose tissue (BAT), which is metabolically more active. The thermogenic properties of BAT may also play a significant role in total white adipose tissue mass and may account for susceptibility to obesity. Studies in both animal models and humans offer a promising outlook in determining GH’s role in BAT regulation and function [24-26].
Recently, our group has characterized the somatotroph insulin-like growth factor-1 receptor knockout (SIGFRKO) mouse as a model of disrupted feedback in the somatotroph. This model, in which the IGF-1 receptor is selectively ablated from the somatotroph to prevent IGF-1 feedback, demonstrated moderately increased serum GH levels by 3.5 fold, but with no alteration in linear growth and a decrease in adiposity. [27]. Initial metabolic studies demonstrated no differences in insulin action compared to controls, thus highlighting disconnect between the effect of GH on growth and metabolism and therefore, making this model intriguing for further study. We hypothesized this decrease in fat mass was secondary to elevated serum GH levels, which altered metabolism in this mouse model. In this report, we present studies designed to characterize the metabolic differences in the SIGFRKO male mice to account for its phenotype. Indirect calorimetry studies completed in both younger (8 weeks of age) and older SIGFRKO (25 weeks of age) male mice show an increase in metabolic activity despite a lack of differences in feeding activity. We demonstrate that the SIGFRKO mice have decreased fat mass and gene expression studies of potential targets of GH action point to a mechanism to account for the decreased adiposity. Our research thus provides further evidence for the importance of GH’s role in altering metabolism and insight into potential mechanisms by which GH could minimize or limit the deposition of adipose tissue in the body.
2. Materials and methods
2.1 Animals and diet
Male SIGFRKO mice were developed by cross-breeding the GHpCre and Insulin-like growth factor 1 receptor (IGF1-R) floxed mouse lines as previously described [27]. Control littermates were mice lacking the Cre transgene or the IGF-1R floxed allele. Genotyping was performed using genomic tail DNA and PCR as previously described [27]. All animal procedures were performed under standard light and dark cycles with approval of the Johns Hopkins Animal Care and Use Committee. Mice were allowed ad libitum access to water and food.
2.2 Metabolic studies
Indirect calorimetry experiments were performed using the Columbus Instruments Comprehensive Lab Animal Monitoring System (CLAMS, Columbus, OH). Studies were designed to measure two age groups: male mice between 6-8 weeks denoted as younger mice and male mice at 25 weeks of age denoted as older mice. Data for each figure was compiled using 6-8 mice for each group. Male animals were singly housed in metabolic chambers with ad libitum access to normal chow and water throughout the experiment. Each animal was given approximately 24 hours for acclimation to the environment. Oxygen consumption and carbon dioxide production were measured at 10 min intervals. Food consumption was calculated using a center spring-loaded feeder. Animal activity was detected with a dual axis detection system using IR photocell technology. The interruption of an IR beam was recorded as one “count”. The ambulatory activity of the animals was recorded as X ambulatory and defined as when an animal breaks a series of infra-red beams consecutively in series. The total activity (X total) was recorded at any time an infra-red beam was broken. The height of the beams was situated so that they intersect the animal midway vertically.
2.3 Adipocyte histology
Adipose tissue from the visceral, subcutaneous and brown adipose tissue (subscapular) depots was harvested for histology after animal euthanization. Tissues were weighed immediately after dissection. Tissues were fixed in 10% formalin phosphate buffer and sectioned to 5 microns thickness by Johns Hopkins Medical Laboratories (Histology group). Sections were stained with hematoxylin and eosin. These were examined with a Zeiss microscope. Several sections (6-8) for each tissue were visualized and cells counted. This was repeated for 4-5 animals in each group. Sections were photographed with an AxioCamMR camera and exported to AxioVision Software.
2.4 Gene expression analysis
Adipose RNA from visceral, subcutaneous and brown adipose tissue depots was extracted by Trizol (Invitrogen, Grand Island, NY) according to the manufacturer’s protocol. One microgram of total RNA was reverse transcribed (iScript cDNA Synthesis Kit, BioRad, Hercules, CA) to cDNA. mRNA level of genes (Hsl, Lpl, Atgl, Fas, Glut4, Cide-a, leptin and adiponectin) related to adipose metabolic function were measured by iQSYBR green according to the manufactory protocol (Bio-Rad) using specified primers for HSL (forward 5’-ACGGATACCGTAGTTTGGTGC-3’, reverse 5’-TCCAGAAGTGCACATCCAGGT), LPL (forward 5’-CTGCTGGCGTAGCAGGAAGT-3’, reverse 5’-GCTGGAAAGTGCCTCCATTG-3’), ATGL (forward 5’-ACTGTGGCCTCATTCCTCCT-3’, reverse 5’-AACTGGATGCTGGTGTTGGT-3’), FAS (forward 5’-GAGGACACTCAAGTGGCTGA-3’, reverse 5’-GTGAGGTTGCTGTCGTCTGT-3’), GLUT4: forward 5’-TGATTCTGCTGCCCTTCTGT-3’, reverse 5’-GGACATTGGACGCTCTCTCT-3’), CIDE-A (forward 5’-CTCGGCTGTCTCAATGTCAA-3’, reverse 5’-CCGCATAGACCAGGAACTGT-3’), Leptin (forward 5’-GGGCTTCACCCCATTCTGA-3’, reverse 5’-TGGCTATCTGCAGCACATTTTG-3’), Adiponectin (forward 5’-GATGGCACTCCTGGAGAGAA-3’, reverse 5’-TCTCCAGGCTCTCCTTTCCT-3’), UCP1 (forward 5’-GTGAAGGTCAGAATGCAAGC-3’, reverse 5’-AGGGCCCCCTTCATGAGGTC-3’), UCP2 (forward 5’-ACAAGACCATTGCACGAGAG-3’, reverse 5’-CATGGTAAGGGCACAGTGAC-3’), UCP3 (forward 5’-ATGCATGCCTACAGAACCAT-3’, reverse 5’-CTGGGCCACCATCCTCAGCA-3’) and GAPDH control (forward 5’-GGGCATCTTGGGCTACACT-3’, reverse 5’-GGCATCGAAGGTGGAAGAGT-3’). PCR conditions were optimized to generate more than 95% PCR efficiency. Cycle threshold (Ct) was obtained for each sample. A corrected Ct (ΔCt) was calculated by subtracting the GAPDH Ct from the unknown sample Ct for each sample. Relative differences from the control sample were then calculated by using the formula: fold change = 2^(control ΔCt − sample ΔCt).
2.5 Statistical analysis
Data was analyzed by unpaired Student’s t test using GraphPad 4 Prism (GraphPad Software, Inc. San Diego, California). Data are expressed as means ± S.E.M. Significance was assigned for a value of P ≤0.05.
3. RESULTS
3.1 Adipose depots from SIGFRKO mice have decreased lipid content
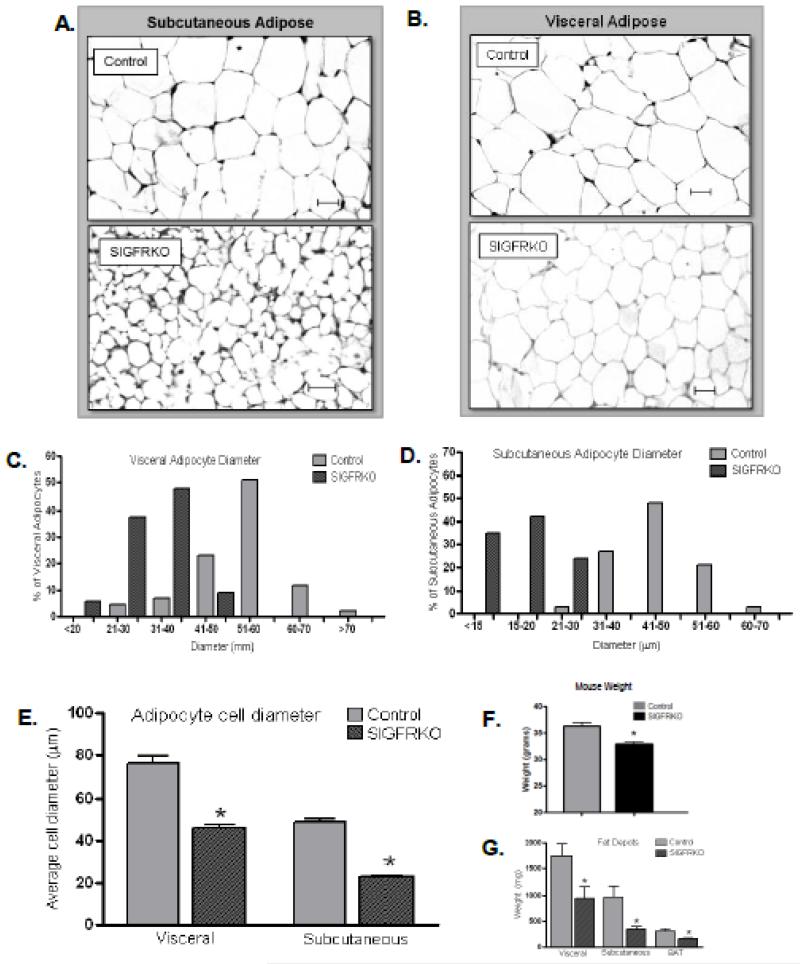
Our previous studies demonstrated that despite modestly elevated serum GH levels in SIGFRKO mice, there were no differences in length measurements through 6 months of age; however, SIGFRKO mice did weighed less than controls beginning at 3-4 months of age, which was associated with a lower fat mass as determined by EchoMRI body composition analyzer [27]. In order to investigate the lower fat mass in SIGFRKO mice, individual fat pads were histologically analyzed. Figure 1A and 1B shows hematoxylin and eosin stained sections of subcutaneous and visceral adipose tissue depots from SIGFRKO and control mice at 25 weeks of age. Figure 1C, which graphs the measured diameters of the adipocytes, illustrates that the majority of adipocytes in the visceral fat from SIGFRKO mice have diameters less than 50 μm, while the majority of adipocytes from control mice exceeded 50 μm. Figure 1D shows decreased cell diameter size in subcutaneous adipose tissue of the SIGFRKO (less than 30 μm) vs. control mice (greater than 30 μm). The overall average diameter of adipocytes in the visceral and subcutaneous tissue depots was lower in SIGFRKO mice than controls (Fig 1E, visceral: 46.13 ± 1.401 vs 75.89 ± 3.659 μm, subcutaneous: 23.05 ± 0.442 vs 49.03 ± 1.388 μm, p<0.001). Figure 1F displays the average weight of mice (control vs. SIGFRKO) used in the experiments, which correlates with our previous report (36.35 ± 0.56 vs. 32.89 ± 0.39 gm, respectively, p<0.05 [27]). The average weight of the visceral and subcutaneous tissue depots was also lower in the SIGFRKO mice vs controls (Fig. 1G, visceral: 937.8 ± 200.1 vs1743 ± 239.3 gm, subcutaneous: 346.8 ± 53.16 vs 968.3 ± 188.1 gm and brown adipose tissue (BAT: 157.0 ± 9.687 vs. 307.0 ± 46.47 gm, p<0.05).
Figure 1.
Characterization of adipocytes in SIGFRKO mice. Adipocyte morphology analyzed by H&E staining of dissected fat depots show that SIGFRKO mice have decreased adipocyte size compared to control mice. (A) Visceral fat depot. (B) Subcutaneous fat depot. Sections photographed are 200× magnification. Scale bar: 20 μm. The average measured cell diameter of both visceral and subcutaneous adipocytes is less in SIGFRKO vs. control mice. (C) The average cell diameter of visceral adipocytes was plotted based on different ranges of a measured diameter. A majority of SIGFRKO mice cell diameters are less than control adipocytes with no cell diameter >50 μm. (D) Measurements of subcutaneous adipocytes also show the majority of cell diameters fall into a smaller range for SIGFRKO mice. (E) The total average adipocyte cell diameter for each depot is plotted for control vs SIGFRKO mice. * p<0.001. (F) Mouse weights of control and SIGFRKO mice measured at approximately 25 weeks (G) Fat depots were measured in mice after euthanasia and graphed. SIGFRKO mice demonstrated less fat in all depots dissected including visceral, subcutaneous and brown adipose tissue (*p<0.05, bars represent S.E.M.).
3.2 SIGFRKO mice have altered expression of lipolytic genes
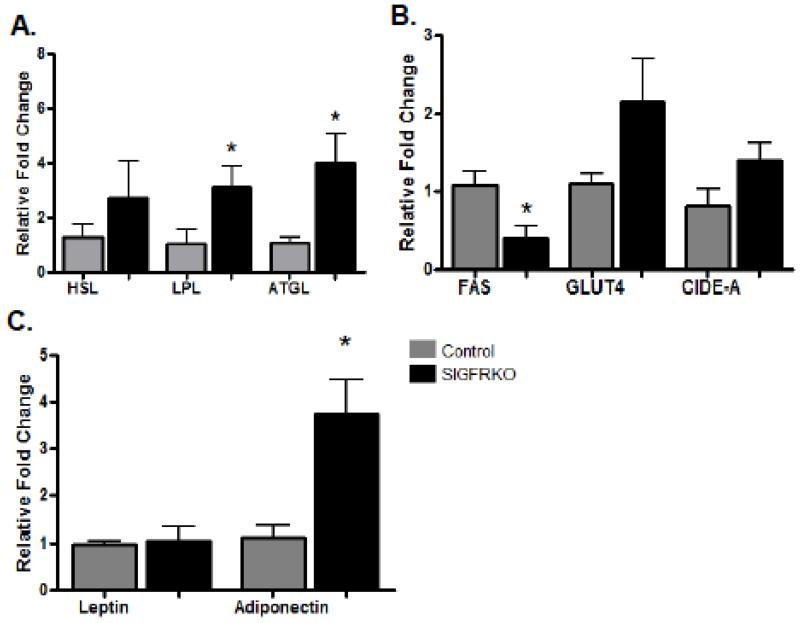
Although the role of growth hormone in lipolysis has been well documented, the mechanism by which growth hormone leads to the described metabolic effects remains unclear. Quantitative-real time PCR was performed with RNA obtained from visceral adipose tissue to measure the relative expression of genes known to be involved in adipocyte metabolism and possible targets of GH action [28]. Figure 2A illustrates the significantly higher level of lipoprotein lipase (LPL) and adipocyte triglyceride lipase (ATGL) gene expression in the SIGFRKO vs control mice, (3.12 ± 0.75 and 3.99 ± 1.10 fold increase, respectively, p<0.05). A higher level of hormone sensitive lipase (HSL) gene expression was also noted, but did not reach significance (2.72 ± 1.35 fold increase). In contrast, Figure 2B shows lower fatty acid synthetase (FAS) gene expression in SIGFRKO vs control mice (2.65 fold decrease, p<0.05). No significant differences in glucose transporter 4 (GLUT4) or cell death-inducing DNA fragmentation factor-alpha-like effector A (CIDE-A) gene expression was found between SIGFRKO and control mice (Figure 2B). Adiponectin gene expression levels were higher in the SIGFRKO vs. control mice (3.74 ± 0.72 fold increase, p < 0.05), but no significant differences in leptin gene expression were noted (Figure 2C).
Figure 2.
Metabolic gene expression studies in visceral adipose tissue depot. (A) Quantitative RT-PCR demonstrated a significant relative fold increase in gene expression for both LPL and ATGL in the SIGFRKO vs control mice; an increase in HSL expression was also detected, but did not reach significance. (B) In contrast, a decrease in FAS expression was measured in SIGFRKO vs control mice. Although there was a trend for higher expression of GLUT4 and CIDE-A in SIGFRKO mice, results did not reach significance. (C) No differences in leptin gene expression were seen between the two groups; however, adiponectin levels were higher in the SIGFRKO mice. (* p<0.05, bars represent S.E.M.)
3.3 GH targets brown adipose tissue (BAT)
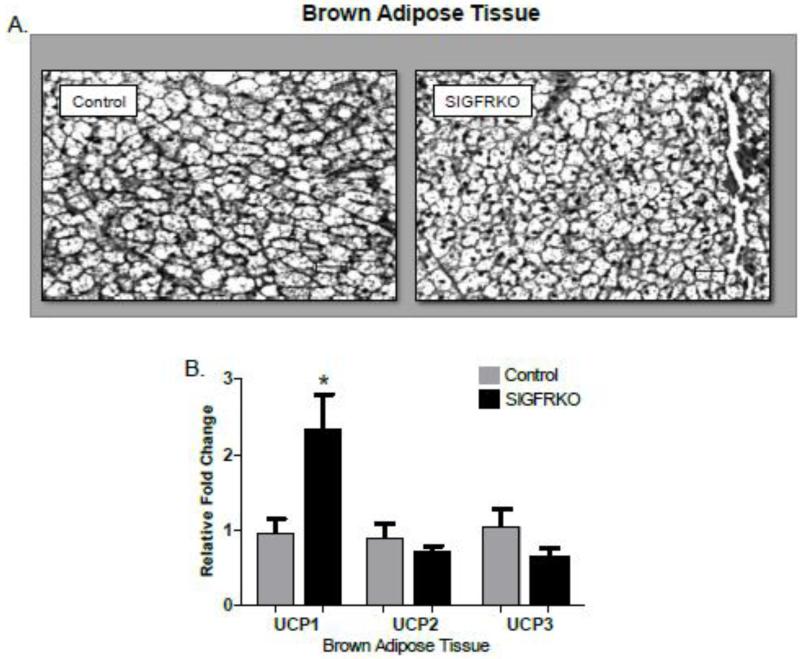
Figure 3A shows hematoxylin and eosin stained sections of brown adipose tissue depots from SIGFRKO and control mice at 25 weeks of age. Despite the cells from the SIGFRKO mice appearing smaller, gene expression studies demonstrates a 2.46 fold increase in expression of UCP1, a marker for BAT (Fig 3B, p<0.05). No significant differences were seen in UCP2 or UCP3 gene expression.
Figure 3.
Brown adipocyte tissue morphology analyzed by H&E staining and gene expression. (A) Brown adipocyte tissue depot (B) Quantitative RT-PCR demonstrated a significant relative fold increase in gene expression of UCP1, but no significant differences were found in UCP2 or UCP3. (*p<0.05, bars represent S.E.M.)
3.4 Chow consumption by SIGFRKO mice is not changed
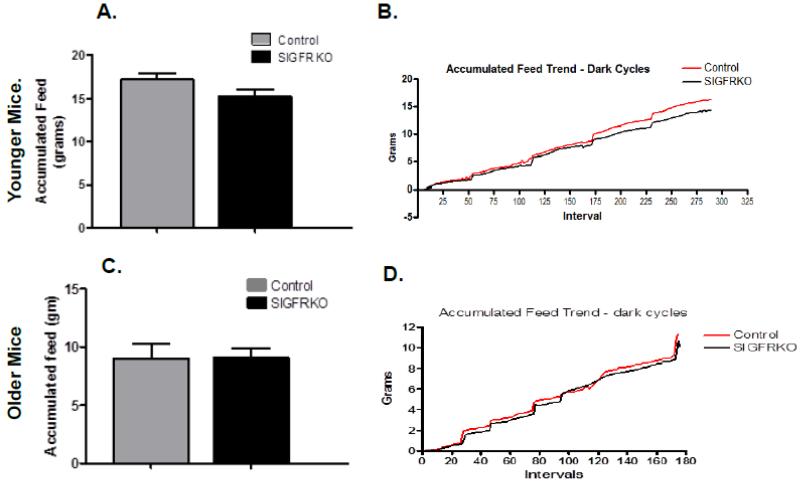
Despite the difference in adiposity, metabolic studies revealed no difference in food consumed between SIGFRKO and control groups. Figure 4A graphs the average food accumulation by the end of the experiments for younger mice and display no significant differences (Fig 4A 15.29 ± 0.701 vs. 17.24 ± 0.642 gm). Figure 4B shows the average calculated weight of food consumed during recorded dark cycle intervals throughout the experiment, providing further evidence that both genotypes consumed equal amounts of chow at a similar rate. The analysis of the average accumulated feed during the experiments of older mice showed no differences in food consumed throughout the experiment, similar to the younger mice (Fig 4C, 9.068 ± 0.798 vs 8.997 ± 1.269 gm). Figure 4D tracks the trend of accumulated food weight throughout the dark cycles and similarly demonstrates no differences in the total amount or rate of food consumed.
Figure 4.
Both younger SIGFRKO mice (6-8 weeks of age) and SIGFRKO mice (25 weeks of age) demonstrate no differences in food consumption vs control mice. (A) At the completion of the experiment no significant differences were found in the total average final accumulated weight of food consumed between the two groups. (B) The trend of chow consumption during the dark cycle is graphed and further supports the lack of differences in caloric intake is seen between the groups. (C) Over the course of the experiments the final average weight of food consumption for older mice was also no different between control and SIGFRKO groups. (D) The trend of food consumption during each dark cycle between the two groups is graphed to further demonstrate no significant differences in feeding habits between groups.
3.5 Changes in indirect calorimetry measurements of younger SIGFRKO mice
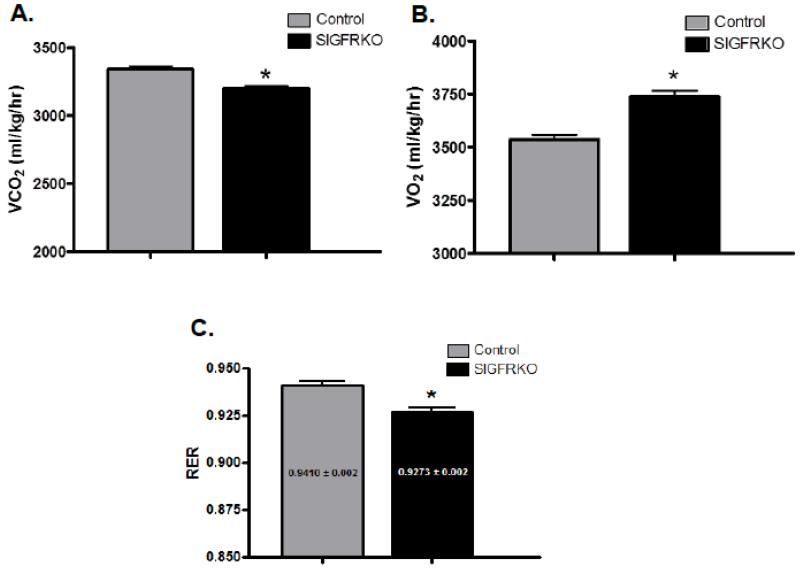
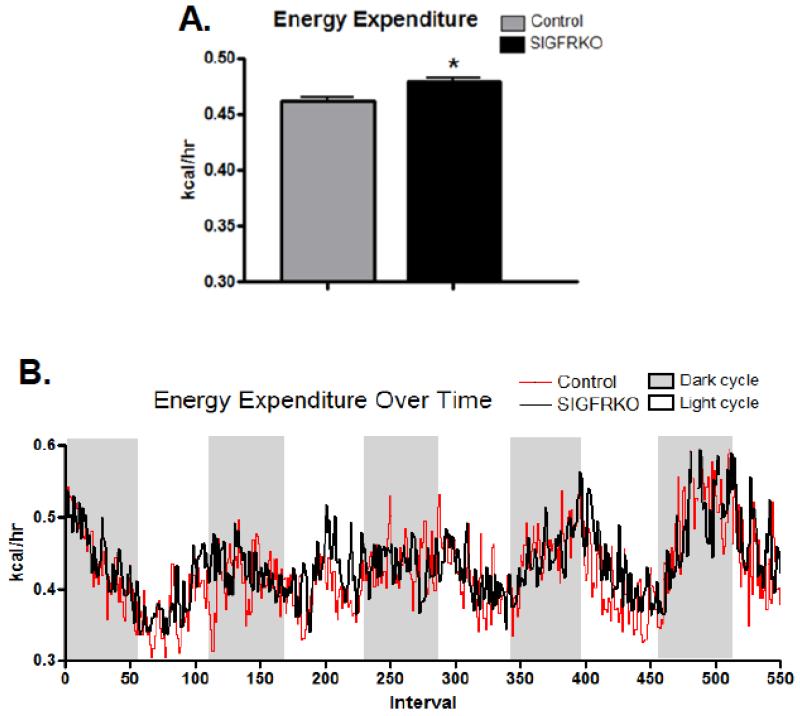
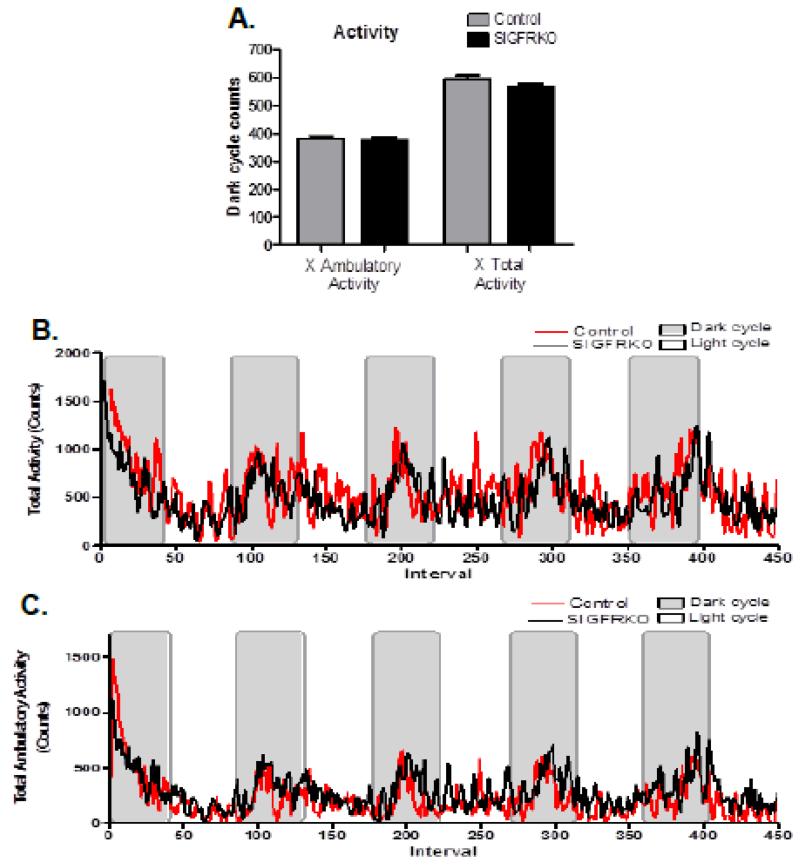
Indirect calorimetry was used to characterize the metabolic phenotype of the male SIGFRKO mouse model. Figure 5 illustrates that SIGFRKO mice between 6-8 weeks of age had a lower calculated VCO2, but a higher VO2 during the dark cycles than control mice (Fig 5A, VCO2 3200 ± 17.67 vs. 3341 ± 21.50 ml/kg/hr and 5B, VO2 3743 ± 26.05 vs. 3537 ± 22.05 ml/kg/hr, p<0.0001). The calculated average respiratory exchange ratio (RER) during the dark cycles was significantly lower in the SIGFRKO mice vs control mice (Fig 5C, 0.92 ± 0.002 vs. 0.94 ± 0.002). Energy expenditure, which is primarily dependent on VO2 and reflective of the metabolic rate, was significantly higher in the SIGFRKO mice (Fig. 6A 0.48 ± 0.003 vs. 0.46 ± 0.003 kcal/hr, p<0.05). Figure 6B displays the trend of calculated energy expenditure during dark and light cycles in order to appreciate the consistent elevation in SIGFRKO mice. Figure 7A shows that the average total ambulatory activity during the dark cycles was no different between the SIGFRKO vs. control mice (380.1 ± 9.011 vs 376.7 ± 8.021 counts). Furthermore, no differences were found in the average total activity between these animal groups (593.4 ± 12.81 vs. 565.3 ± 11.64 counts). The graphs in Figure 7B and 7C, which display the average ambulatory activity and total activity, respectively, show no significant differences between the SIGFRKO and control mice during both dark and light cycles.
Figure 5.
Indirect calorimetric experiments were performed on both young control and SIGFRKO mice on regular chow diet. (A) SIGFRKO mice demonstrated an overall lower VCO2; (B) however they had a higher VO2. (C) Therefore, overall calculated RER was lower in the SIGFRKO vs. control mice. (* p<0.0001, bars represent S.E.M.)
Figure 6.
(A) The calculated energy expenditure, which is dependent on VO2 measurement, was shown to be increased in younger SIGFRKO vs. control mice. (B) Shown is the trend of energy expenditure during dark and light cycles. (* p<0.0001, bars represent S.E.M.)
Figure 7.
The activity of younger mice was recorded throughout the experiment. (A) Ambulatory activity, which represents the animal breaking a series of infrared beams in sequence, demonstrates that there are no differences of activity during the dark cycles between SIGFRKO and control mice. Also the total nocturnal activity demonstrated no significant differences between groups. (B) The trend of ambulatory activity during both dark and light cycles between groups is shown. (C) This is compared to the trend of total activity throughout the experiment between groups.
3.6 Older SIGFRKO mice continue to demonstrate increased metabolic activity
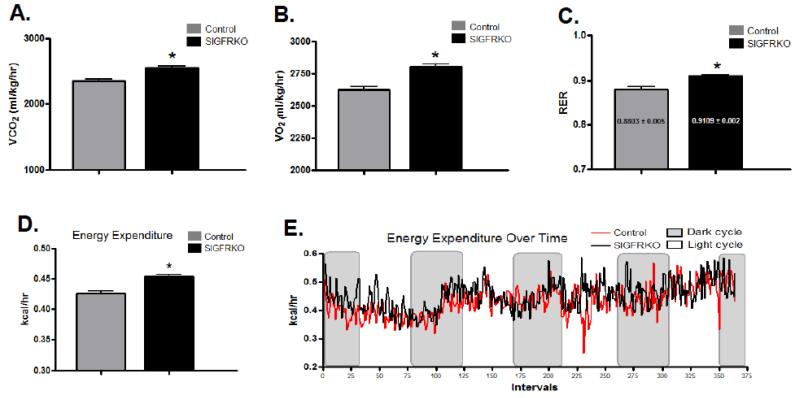
Since the previous experiments were performed at 6-8 weeks of age when SIGFRKO mice were phenotypically identical to control mice and before they demonstrated a lower weight, we repeated the indirect calorimetry experiments when male mice were 25 weeks of age and demonstrate a lower fat mass [27]. Indirect calorimetry demonstrated a higher average VCO2 and VO2 in the SIGFRKO compared to the control mice (Fig 8A, 2554 ± 23.27 vs. 2351 ± 27.58 ml/kg/hr and Fig 8B, 2807 ± 20.24 vs. 2626 ± 26.11 ml/kg/hr respectively, p<0.0001). The average calculated RER during the dark cycles was also higher in the SIGFRKO vs. control mice (Fig 8C, 0.91 ± 0.002 vs. 0.88 ± 0.005, p<0.0001). As with the younger mice, energy expenditure was greater in the older SIGFRKO vs control mice (Fig. 8D, 0.45 ± 0.003 vs 0.42 ± 0.005 kcal/hr, p<0.0001). The higher metabolic rate of SIGFRKO mice coincides with the higher VO2 levels and can be visualized in Figure 8E.
Figure 8.
Indirect calorimetric experiments were performed using older mice on regular chow diet. (A) The calculated VCO2 during dark cycles was higher in SIGFRKO vs. control mice. (B) In addition, VO2 during the dark cycles, similar to younger mice, was also higher in the SIGFRKO mice. (C) These changes led to an overall higher calculated RER for the SIGFRKO vs. control mice. (* p<0.0001, bars represent S.E.M.) (D) The calculated energy expenditure was also higher in the SIGFRKO vs. controls control. (E) The overall average trend of energy expenditure during both dark and light cycles is graphed over the course of the experiment.
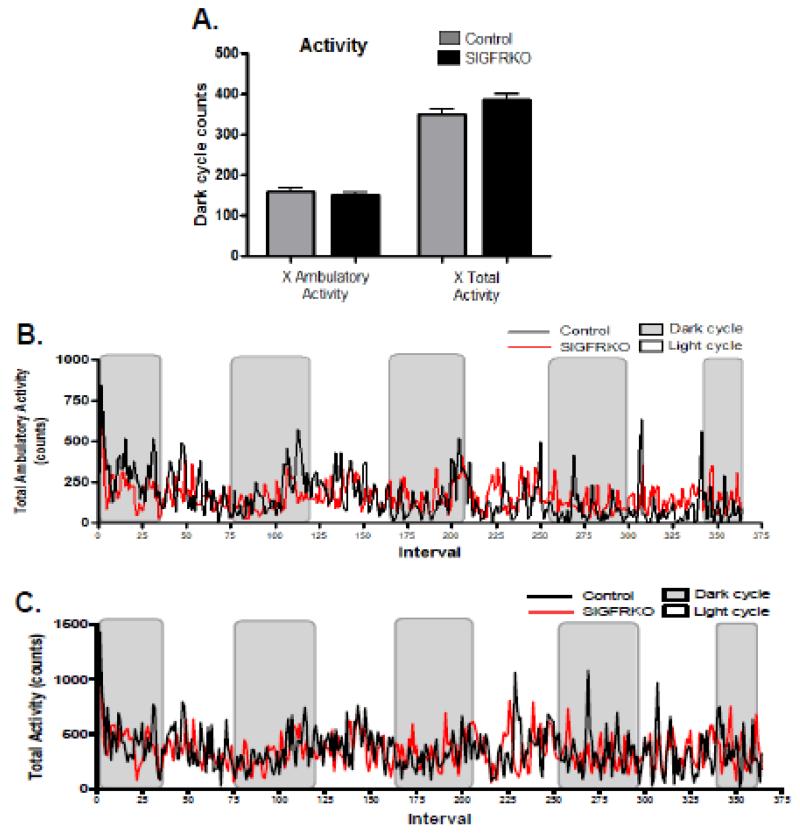
The activity of the older mice was recorded and analyzed as both ambulatory and total activity. Similar to the younger mice, SIGFRKO vs control mice showed no differences in the average ambulatory activity during the dark cycles (Fig. 9A 160.5 ± 7.12 vs. 150.6 ± 7.22 counts). In addition, there was no difference in the total dark cycle activity between the two groups (Fig 9A, 386.1 ± 14.55 vs 351.5 ± 12.24 counts). The trend of the average ambulatory activity and total activity between the mouse groups demonstrates overall similar counts between SIGFKRO and control mice (Fig 9B and 9C).
Figure 9.
No significant differences in both ambulatory activity and overall total activity were measured in older SIGFRKO mice. (A) Ambulatory activity is defined as an animal breaking a series of IR beams in sequence. The cumulative average of counts during the dark cycle was no different between groups. No significant total activity differences were noted between groups during the dark cycles. (B) The overall trend of ambulatory activity between the two groups is graphed for all dark and light cycles. (C) Also, the overall trend for total activity throughout the experiment is graphed.
4. Discussion
GH is a potent modulator of cellular metabolism and specifically stimulates lipolysis and regulates targeted deposition of adipose tissue. The goal of this study was to determine the role of GH in targeting adipose tissue deposition and energy metabolism using the previously described genetically modified mouse model, the SIGFRKO mouse, bearing a deletion of the somatotroph IGF-1 receptor [27]. We focused on these mice at two different ages: 1) at 6-8 weeks of age when SIGFRKO weight and fat mass were equal to control littermates, and 2) 25 weeks of age when SIGFRKO mice weigh less and were leaner than controls. Several studies have provided some insight into the metabolic effects of GH, however, the model systems, the methods of data collection and the analysis differ widely, thus making it difficult to clearly determine its role. Table 1 summarizes the metabolic parameters of the SIGFRKO mouse model in comparison to several other mouse models in which the GH axis has been altered [13-15, 19, 29]. Increased energy expenditure is demonstrated in the SIGFRKO mouse model, in addition to mice with GH overexpression (bGH, GH increases greater than 50 fold), and the mouse model harboring somatotroph inactivation of both the IGF-1R. and insulin receptor (HiGH). These presented models point out, however, that excess GH does not consistently lead to increased energy expenditure as noted in the liver-specific GHR knockout (LiGHRKO). Although VCO2 is inconsistently reported, RER calculations differ among the mouse models, which is likely a result of other metabolic alterations resulting from the gene manipulation. Most of the models had no difference reported in RER in a setting of elevated GH as demonstrated in the LiGHRKO mouse with disrupted GH signaling only in the liver. Conversely, the HiGH mouse, which has very elevated serum GH levels, has a lower RER than wild type controls. Our findings suggest the effect of GH on RER appears to be dependent on the amount of adipose tissue, which differs with the age of the SIGFRKO mouse. Certainly, the age at which measurements are performed, timing (light vs. dark cycle) and type of diet ultimately affects these results and may account for the inconsistency among the studies. Consequently, although GH’s ability to limit adiposity is clear, its mechanism of action remains difficult to discern given the variability in these mouse models and methods. Our studies confirm the importance, but also the complexity of GH’s role in regulating adiposity and metabolism (Table 1).
Table 1. Comparison of metabolic studies in mouse models with disrupted GH axis.
| Mouse | Phenotype | VCO 2 |
VO 2 |
RE R |
EE | Food Intake |
ActivityAmbulatory | ActivityTotal | Reference |
|---|---|---|---|---|---|---|---|---|---|
| SIGFRKOyoung | Incr. GH, weight gain velocity |
↓ | ↑ | ↓ | ↑ | ↔ | ↔ | ↔ | |
| SIGFRKOolder | Incr. GH, weight gain velocity |
↑ | ↑ | ↑ | ↑ | ↔ | ↔ | ↔ | |
| FIGIRKO | marked decr WAT/BAT, no differences IGF-1 (presume no change GH) |
NR | ↑ | ↔ | ↑? | ↔ | NR | ↔ | 14 |
| GHR−/− | dwarf mice, incr total fat mass |
NR | ↑ | ↔ | ↓/↑ * |
↓ | NR | NR | 13 |
| mGHRKO | Inactivation of the GH receptor in mouse skeletal mouse (data based on mice given HFD) |
↑ | ↑ | ↑(lig ht) ↔(d ark) |
↑ | NR | NR | NR | 15 |
| bGH | excess GH (>50 fold nl), incr growth |
NR | ↔ | ↔ | ↑ | ↑ | NR | NR | 13 |
| HiGH | Incr. GH & IGF-1, No weight difference (decr. Visceral fat depot) |
↔ | ↔ | ↓ ** | ↔ | ↔ | NR | ↔ | 19 |
| LiGHRKO | Incr. GH, Decr. IGF-1, decr. Body weight and length decreased. |
NR | ↔ | ↔ | ↔ | NR | NR | NR | 29 |
A summary of metabolic findings in the SIGFRKO mouse model at younger and older ages is graphed along with metabolic findings reported in several previously characterized genetically modified mouse models in which there is disruption or alteration of the GH axis. The table is a compilation of the reported metabolic changes for each model; therefore, comparisons are possible for all parameters. Of note, metabolic studies on the mGHRKO only were reported on a high fat diet (HFD). SIGFRKO (somatotroph IGF-1R knockout), FIGIRKO (double tissue-specific knockout of insulin and IGF-1 receptors in fat), GHR−/− (GH receptor/binding protein knockout), bGH (bovine GH transgene overexpression), mGHRKO (skeletal muscle GH receptor knockout), HiGH (somatotroph inactivation of IGF-1R and Insulin receptor), LiGHRKO (liver-specific GHR gene knockout), ↑ - increase, ↓ - decrease, ↔ – no difference, NR – not reported.
The calculated EE was reported differently in the citations.
We have already reported that GH levels in male SIGFRKO mice are approximately 3.5 times those measured in controls at 8 weeks of age (2.51 vs 0.71 ng/ml p<0.01) as well still significantly higher at older ages; whereas, other models overexpressing the GH gene have reported levels up to 400-600 times the levels in controls [27, 30]. SIGFRKO mice also show a lower weight gain velocity and have lower fat mass than controls. In this study, indirect calorimetry experiments demonstrate SIGFRKO mice have increased energy expenditure (EE) with concomitant changes in RER. These changes occurred with no differences in food consumption or overall activity. Adipocytes were found to be smaller in the SIGFRKO mice and genes involved in lipid breakdown, including LPL and ATGL, were expressed at higher levels than those in control mice. This is consistent with mice, which bear an adipocyte-specific deletion of JAK2 leading to GH resistance; there is increased body fat and decreased lipolysis [20]. This mouse model, however, had no changes in energy intake or expenditure and inguinal adiposity predominated. The differences in fat mass and metabolism in SIGFRKO mice thus likely reflect distinctions in the physiology of fat accumulation and may explain the increase in adiposity associated with GH deficiency.
At an early age, SIGFRKO mice have elevated serum GH levels when compared to controls, yet weights and lengths are comparable between the groups. VO2 was higher in these mice compared to controls, yet VCO2 was lower. The lower RER suggests a relative predominance of fat utilization in SIGFRKO mice and consistent with an elevated serum GH. Similarly a mouse model lacking both IGF-1R and insulin receptors in somatotrophs was found to have a 3.5 fold elevation in serum GH levels and a lower RER than controls. However, in this model, differences in VO2 or VCO2 were not reported [31]. Interestingly, at the time when SIGFKRO mice exhibited a decrease in weight gain velocity both VO2 and VCO2 are elevated; the average RER was therefore higher in SIGFRKO mice than controls. Since the older mice have less fat mass, it appears that relative fuel utilization is transitioned predominantly to carbohydrates; suggesting that the ability of GH to sustain a lower RER may be limited with age.
Despite these change in RER, energy expenditure (EE), which is dependent on VO2, is persistently higher in both the younger and older SIGFRKO groups. Thus, over time, SIGFRKO mice have a sustained increased metabolic rate. Interestingly, there was a relatively small difference in the average RER in younger and older SIGFRKO mice. In contrast, in the control male group, there was a more profound difference in RER between age groups. This reflects an age-related decrease in metabolic efficiency in the controls associated with a relative decrease in the ratio of carbohydrate/fat utilized. However, the SIGFRKO mice did not sustain an age related decrease in metabolic efficiency, supporting a role for GH in sustaining a higher EE during the aging process.
The difference in weight and EE between the SIGFRKO and control groups was not affected by food intake or activity. To our knowledge, there are no studies directly exploring the effect of GH on activity in animal models. Studies using the GH receptor knockout female mice (GHR−/−) studied at 17 weeks of age report a decrease in activity, correlating with lower EE and VO2 when compared to control mice [32]. The calculated energetic cost of locomotion for GHR−/− mice was greater than controls. The complex metabolic interplay is further demonstrated in another study that showed a stronger correlation between locomotor activity and RER in GHR−/− mice, than the correlation with EE; but overall appears affected by aging [33]. In the SIGFRKO model, EE is sustained without an increase in energy intake (accumulated food consumption) or activity.
In addition to a higher serum GH levels, SIGFRKO mice also had higher serum IGF-1 levels (1.6 fold). IGF-1 is believed to predominantly targets adipocyte development and differentiation [14] versus deposition (39-41). Studies in mice selectively lacking both the IGF-1 and insulin receptors in the adipocyte demonstrate defects in both white and brown fat development as well as adipocyte metabolism [14]. GH secretion and GHR signaling were not assessed in the study, but were likely altered. Mice with selectively disrupted GHR in adipose tissue (assuming normal IGF-1 levels and signaling) experienced normal adipocyte development, but significantly increased adipocyte size [34]. Therefore, the balance of adipose tissue accrual appears more directly related to GH action [35]. The 1.6 fold-elevation in serum IGF-1 levels likely had no significant effect on the metabolic phenotype of SIGFRKO mice; however, these conclusions are still somewhat complicated by earlier studies of mice lacking the IGF-1 receptor in adipocytes, which reported elevated IGF-1 levels, no differences in serum GH and increased adiposity [36]. Interestingly, a model in which both the IGF-1R and the insulin receptor were selectively ablated on the adipocyte, the mice were reported to have no differences in serum IGF-1 along with decreased weight and fewer, not smaller, adipocytes [14] .
The reduced BAT depot in SIGFRKO mice is consistent with their increased EE. Others studies using both human and animal models have shown a role for BAT in lipid deposition [26, 37-40]. Although GH receptors have been localized to BAT, the role of GH on BAT metabolism is not well defined [25, 40]. Studies in mice with either excess GH or loss of GH signaling suggest a role for GH in BAT development [25]. Dwarf mice lacking GH signaling have enlarged WAT and BAT depots, again implicating GH in BAT development [25]. Interestingly, our data shows increased expression of UCP1, suggesting GH may have a metabolic effect via BAT activity [20, 24, 25].
Given the clinical interest of using GH as a therapeutic agent to ‘treat’ obesity, this study has significant translational implications. The metabolic complications of GH deficiency (GHD) have been well documented, as have those for states of extreme excess of serum GH seen in acromegaly [7, 41]. Furthermore, decreasing serum GH concentrations with aging are associated with increased fat mass along with other associated metabolic derangements, which can be reversed with very low doses of recombinant GH replacement regimens [42-44]. We recognize that limitations to our studies include that in vivo mouse data may not directly correlate to human physiology. In addition, our results reflect metabolic changes at only two time points in the life of this mouse model and perhaps a better understanding of GH’s role may be elucidated by looking at repeated metabolic profiles over time. Finally, the complexities of adipose deposition and utilization can not necessarily been solely explained via elevated GH; especially since we recognize, for example, these mice also produce elevated IGF-1 levels. Nevertheless, the targeted approach used to alter GH levels is novel and given the various effects GH levels impose on an in vivo model, the strength in our work lies in the relative ability to focus only on GH’s metabolic role. More importantly, we believe our studies demonstrate that a critical balance of GH may be required for metabolic homeostasis; the SIGFRKO mouse model as wells as others with an altered GH axis, provide a means in delineating a mechanism of GH’s effects on metabolism. We hope this work will aid in the understanding of the mechanisms leading to obesity as well as provide insight into potential novel therapeutic regimens.
Highlights.
SIGFRKO mice demonstrate elevated growth hormone and decreased weight gain.
Elevations of GH improve metabolic efficiency with no change in eating and activity.
Lipolytic genes and possibly BAT are primarily targeted by GH to decrease adiposity.
The SIGFRKO mouse provides a means to study mechanisms of GH’s lipolytic action.
Acknowledgements
We gratefully acknowledge the initial collaboration with Dr. Rhonda Kineman (Research and Development Division, Jesse Brown VA Medical Center, Chicago, IL) and her gift of the GHpCre mouse used to first develop the SIGFRKO mouse. This appreciation also extends to both Linda Koch and Jens C. Bruning (University of Cologne, Cologne, Germany) for their previous collaboration and gift of the IGF-1 receptor floxed mouse.
Source of Support:
Funding for this research reported in this publication was supported by the National Institute of Diabetes And Digestive And Kidney Diseases of the National Institutes of Health under Award Number K08DK088996. The content is solely the responsibility of the authors and does not necessarily represent the official views of the National Institutes of Health. Additional funding was provided by the Baltimore Diabetes Research and Training Center (Integrated Physiology Core; P60 DK079637).
Footnotes
Publisher's Disclaimer: This is a PDF file of an unedited manuscript that has been accepted for publication. As a service to our customers we are providing this early version of the manuscript. The manuscript will undergo copyediting, typesetting, and review of the resulting proof before it is published in its final citable form. Please note that during the production process errors may be discovered which could affect the content, and all legal disclaimers that apply to the journal pertain.
Conflict of Interest
The authors have no relevant conflict of interest to disclose.
REFERENCES
- 1.Gertner JM. Growth hormone actions on fat distribution and metabolism. Horm Res. 1992;38(Suppl 2):41–3. doi: 10.1159/000182592. [DOI] [PubMed] [Google Scholar]
- 2.Moller N, Jorgensen JO. Effects of growth hormone on glucose, lipid, and protein metabolism in human subjects. Endocr Rev. 2009;30(2):152–77. doi: 10.1210/er.2008-0027. [DOI] [PubMed] [Google Scholar]
- 3.Vijayakumar A, Novosyadlyy R, Wu Y, et al. Biological effects of growth hormone on carbohydrate and lipid metabolism. Growth Horm IGF Res. 2010;20(1):1–7. doi: 10.1016/j.ghir.2009.09.002. [DOI] [PMC free article] [PubMed] [Google Scholar]
- 4.Carmean CM, Cohen RN, Brady MJ. Systemic regulation of adipose metabolism. Biochim Biophys Acta. 2014;1842(3):424–30. doi: 10.1016/j.bbadis.2013.06.004. [DOI] [PubMed] [Google Scholar]
- 5.Berryman DE, Glad CA, List EO, et al. The GH/IGF-1 axis in obesity: pathophysiology and therapeutic considerations. Nat Rev Endocrinol. 2013;9(6):346–56. doi: 10.1038/nrendo.2013.64. [DOI] [PubMed] [Google Scholar]
- 6.Johansen T, Richelsen B, Hansen HS, et al. Growth hormone-mediated breakdown of body fat: effects of GH on lipases in adipose tissue and skeletal muscle of old rats fed different diets. Horm Metab Res. 2003;35(4):243–50. doi: 10.1055/s-2003-39481. [DOI] [PubMed] [Google Scholar]
- 7.Freda PU, Shen W, Heymsfield SB, et al. Lower visceral and subcutaneous but higher intermuscular adipose tissue depots in patients with growth hormone and insulin-like growth factor I excess due to acromegaly. J Clin Endocrinol Metab. 2008;93(6):2334–43. doi: 10.1210/jc.2007-2780. [DOI] [PMC free article] [PubMed] [Google Scholar]
- 8.Samra JS, Clark ML, Humphreys SM, et al. Suppression of the nocturnal rise in growth hormone reduces subsequent lipolysis in subcutaneous adipose tissue. Eur J Clin Invest. 1999;29(12):1045–52. doi: 10.1046/j.1365-2362.1999.00577.x. [DOI] [PubMed] [Google Scholar]
- 9.Ng FM, Jiang WJ, Gianello R, et al. Molecular and cellular actions of a structural domain of human growth hormone (AOD9401) on lipid metabolism in Zucker fatty rats. J Mol Endocrinol. 2000;25(3):287–98. doi: 10.1677/jme.0.0250287. [DOI] [PubMed] [Google Scholar]
- 10.Heffernan MA, Jiang WJ, Thorburn AW, et al. Effects of oral administration of a synthetic fragment of human growth hormone on lipid metabolism. Am J Physiol Endocrinol Metab. 2000;279(3):E501–7. doi: 10.1152/ajpendo.2000.279.3.E501. [DOI] [PubMed] [Google Scholar]
- 11.Malmlof K, Johansen T. Growth hormone-mediated breakdown of body fat: insulin and leptin responses to GH are modulated by diet composition and caloric intake in old rats. Horm Metab Res. 2003;35(4):236–42. doi: 10.1055/s-2003-39480. [DOI] [PubMed] [Google Scholar]
- 12.Rosenbaum M, Gertner JM, Gidfar N, et al. Effects of systemic growth hormone (GH) administration on regional adipose tissue in children with non-GH-deficient short stature. J Clin Endocrinol Metab. 1992;75(1):151–6. doi: 10.1210/jcem.75.1.1619004. [DOI] [PubMed] [Google Scholar]
- 13.Berryman DE, List EO, Kohn DT, et al. Effect of growth hormone on susceptibility to diet-induced obesity. Endocrinology. 2006;147(6):2801–8. doi: 10.1210/en.2006-0086. [DOI] [PubMed] [Google Scholar]
- 14.Boucher J, Mori MA, Lee KY, et al. Impaired thermogenesis and adipose tissue development in mice with fat-specific disruption of insulin and IGF-1 signalling. Nat Commun. 2012;3:902. doi: 10.1038/ncomms1905. [DOI] [PMC free article] [PubMed] [Google Scholar]
- 15.Vijayakumar A, Wu Y, Sun H, et al. Targeted loss of GHR signaling in mouse skeletal muscle protects against high-fat diet-induced metabolic deterioration. Diabetes. 2012;61(1):94–103. doi: 10.2337/db11-0814. [DOI] [PMC free article] [PubMed] [Google Scholar]
- 16.Olsson B, Bohlooly-Y M, Fitzgerald SM, et al. Bovine growth hormone transgenic mice are resistant to diet-induced obesity but develop hyperphagia, dyslipidemia, and diabetes on a high-fat diet. Endocrinology. 2005;146(2):920–30. doi: 10.1210/en.2004-1232. [DOI] [PubMed] [Google Scholar]
- 17.Sackmann-Sala L, Berryman DE, Lubbers ER, et al. Age-related and depot-specific changes in white adipose tissue of growth hormone receptor-null mice. J Gerontol A Biol Sci Med Sci. 2014;69(1):34–43. doi: 10.1093/gerona/glt110. [DOI] [PMC free article] [PubMed] [Google Scholar]
- 18.Palmer AJ, Chung MY, List EO, et al. Age-related changes in body composition of bovine growth hormone transgenic mice. Endocrinology. 2009;150(3):1353–60. doi: 10.1210/en.2008-1199. [DOI] [PMC free article] [PubMed] [Google Scholar]
- 19.Gahete MD, Cordoba-Chacon J, Anadumaka CV, et al. Elevated GH/IGF-I, due to somatotrope-specific loss of both IGF-I and insulin receptors, alters glucose homeostasis and insulin sensitivity in a diet-dependent manner. Endocrinology. 2011;152(12):4825–37. doi: 10.1210/en.2011-1447. [DOI] [PMC free article] [PubMed] [Google Scholar]
- 20.Nordstrom SM, Tran JL, Sos BC, et al. Disruption of JAK2 in adipocytes impairs lipolysis and improves fatty liver in mice with elevated GH. Mol Endocrinol. 2013;27(8):1333–42. doi: 10.1210/me.2013-1110. [DOI] [PMC free article] [PubMed] [Google Scholar]
- 21.Harwood HJ., Jr. The adipocyte as an endocrine organ in the regulation of metabolic homeostasis. Neuropharmacology. 2012;63(1):57–75. doi: 10.1016/j.neuropharm.2011.12.010. [DOI] [PubMed] [Google Scholar]
- 22.Richelsen B, Pedersen SB, Kristensen K, et al. Regulation of lipoprotein lipase and hormone-sensitive lipase activity and gene expression in adipose and muscle tissue by growth hormone treatment during weight loss in obese patients. Metabolism. 2000;49(7):906–11. doi: 10.1053/meta.2000.6738. [DOI] [PubMed] [Google Scholar]
- 23.Frick F, Bohlooly-Y M, Linden D, et al. Long-term growth hormone excess induces marked alterations in lipoprotein metabolism in mice. Am J Physiol Endocrinol Metab. 2001;281(6):E1230–9. doi: 10.1152/ajpendo.2001.281.6.E1230. [DOI] [PubMed] [Google Scholar]
- 24.Hioki C, Yoshida T, Kogure A, et al. Effects of growth hormone (GH) on mRNA levels of uncoupling proteins 1, 2, and 3 in brown and white adipose tissues and skeletal muscle in obese mice. Horm Metab Res. 2004;36(9):607–13. doi: 10.1055/s-2004-825905. [DOI] [PubMed] [Google Scholar]
- 25.Li Y, Knapp JR, Kopchick JJ. Enlargement of interscapular brown adipose tissue in growth hormone antagonist transgenic and in growth hormone receptor gene-disrupted dwarf mice. Exp Biol Med (Maywood) 2003;228(2):207–15. doi: 10.1177/153537020322800212. [DOI] [PubMed] [Google Scholar]
- 26.van Marken Lichtenbelt WD, Vanhommerig JW, Smulders NM, et al. Cold-activated brown adipose tissue in healthy men. N Engl J Med. 2009;360(15):1500–8. doi: 10.1056/NEJMoa0808718. [DOI] [PubMed] [Google Scholar]
- 27.Romero CJ, Ng Y, Luque RM, et al. Targeted deletion of somatotroph insulin-like growth factor-I signaling in a cell-specific knockout mouse model. Mol Endocrinol. 2010;24(5):1077–89. doi: 10.1210/me.2009-0393. [DOI] [PMC free article] [PubMed] [Google Scholar]
- 28.Vijayakumar A, Yakar S, Leroith D. The intricate role of growth hormone in metabolism. Front Endocrinol (Lausanne) 2011;2:32. doi: 10.3389/fendo.2011.00032. [DOI] [PMC free article] [PubMed] [Google Scholar]
- 29.List EO, Berryman DE, Funk K, et al. Liver-specific GH receptor gene disrupted (LiGHRKO) mice have decreased endocrine IGF-1, increased local IGF-1 as well as altered body size, body composition and adipokine profiles. Endocrinology. 2014 doi: 10.1210/en.2013-2086. en20132086. [DOI] [PMC free article] [PubMed] [Google Scholar]
- 30.Kopchick JJ, Bellush LL, Coschigano KT. Transgenic models of growth hormone action. Annu Rev Nutr. 1999;19:437–61. doi: 10.1146/annurev.nutr.19.1.437. [DOI] [PubMed] [Google Scholar]
- 31.Gahete MD, Cordoba-Chacon J, Luque RM, et al. The rise in growth hormone during starvation does not serve to maintain glucose levels or lean mass but is required for appropriate adipose tissue response in female mice. Endocrinology. 2013;154(1):263–9. doi: 10.1210/en.2012-1849. [DOI] [PMC free article] [PubMed] [Google Scholar]
- 32.Longo KA, Berryman DE, Kelder B, et al. Daily energy balance in growth hormone receptor/binding protein (GHR −/−) gene-disrupted mice is achieved through an increase in dark-phase energy efficiency. Growth Horm IGF Res. 2010;20(1):73–9. doi: 10.1016/j.ghir.2009.08.002. [DOI] [PMC free article] [PubMed] [Google Scholar]
- 33.Hong SL, Longo KA, Gosney E, et al. Increased metabolic flexibility and complexity in a long-lived growth hormone insensitive mouse model. J Gerontol A Biol Sci Med Sci. 2014;69(3):274–81. doi: 10.1093/gerona/glt090. [DOI] [PMC free article] [PubMed] [Google Scholar]
- 34.List EO, Berryman DE, Funk K, et al. The role of GH in adipose tissue: lessons from adipose-specific GH receptor gene-disrupted mice. Mol Endocrinol. 2013;27(3):524–35. doi: 10.1210/me.2012-1330. [DOI] [PMC free article] [PubMed] [Google Scholar]
- 35.Baquedano E, Ruiz-Lopez A, Sustarsic E, et al. The absence of GH signaling affects the susceptibility to high fat diet induced hypothalamic inflammation in male mice. Endocrinology. 2014 doi: 10.1210/en.2014-1367. en20141367. [DOI] [PubMed] [Google Scholar]
- 36.Kloting N, Koch L, Wunderlich T, et al. Autocrine IGF-1 action in adipocytes controls systemic IGF-1 concentrations and growth. Diabetes. 2008;57(8):2074–82. doi: 10.2337/db07-1538. [DOI] [PMC free article] [PubMed] [Google Scholar]
- 37.Lee P, Swarbrick MM, Ho KK. Brown adipose tissue in adult humans: a metabolic renaissance. Endocr Rev. 2013;34(3):413–38. doi: 10.1210/er.2012-1081. [DOI] [PubMed] [Google Scholar]
- 38.Lowell BB, S-Susulic V, Hamann A, et al. Development of obesity in transgenic mice after genetic ablation of brown adipose tissue. Nature. 1993;366(6457):740–2. doi: 10.1038/366740a0. [DOI] [PubMed] [Google Scholar]
- 39.Kontani Y, Wang Y, Kimura K, et al. UCP1 deficiency increases susceptibility to diet-induced obesity with age. Aging Cell. 2005;4(3):147–55. doi: 10.1111/j.1474-9726.2005.00157.x. [DOI] [PubMed] [Google Scholar]
- 40.Carvalho SD, Negrao N, Bianco AC. Hormonal regulation of malic enzyme and glucose-6-phosphate dehydrogenase in brown adipose tissue. Am J Physiol. 1993;264(6 Pt 1):E874–81. doi: 10.1152/ajpendo.1993.264.6.E874. [DOI] [PubMed] [Google Scholar]
- 41.Katznelson L. Alterations in body composition in acromegaly. Pituitary. 2009;12(2):136–42. doi: 10.1007/s11102-008-0104-8. [DOI] [PubMed] [Google Scholar]
- 42.Florini JR, Prinz PN, Vitiello MV, et al. Somatomedin-C levels in healthy young and old men: relationship to peak and 24-hour integrated levels of growth hormone. J Gerontol. 1985;40(1):2–7. doi: 10.1093/geronj/40.1.2. [DOI] [PubMed] [Google Scholar]
- 43.Rudman D, Feller AG, Nagraj HS, et al. Effects of human growth hormone in men over 60 years old. N Engl J Med. 1990;323(1):1–6. doi: 10.1056/NEJM199007053230101. [DOI] [PubMed] [Google Scholar]
- 44.Arvat E, Ceda G, Ramunni J, et al. The IGF-I response to very low rhGH doses is preserved in human ageing. Clin Endocrinol (Oxf) 1998;49(6):757–63. doi: 10.1046/j.1365-2265.1998.00613.x. [DOI] [PubMed] [Google Scholar]


