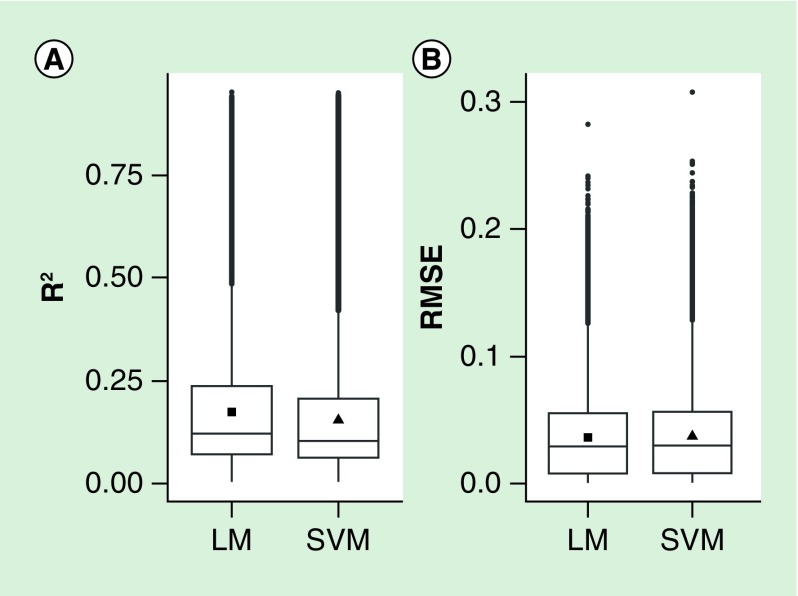
Figure 1. . Prediction accuracy of both linear models and support vector machine models was evaluated by using R2 and root mean square error between measured and predicted methylation values.
For both models, the distribution of R2 (A) and root mean square error (B) in all CpG sites are shown. The filled square and triangle represent the mean. LM: Linear model; RMSE: Root mean square error; SVM: Support vector machine.

