

Abstract
Detailed knowledge about the neural circuitry connecting the hippocampus and entorhinal cortex is necessary to understand how this system contributes to spatial navigation and episodic memory. The two principal cell types of the dentate gyrus, mossy cells and granule cells, are interconnected in a positive feedback loop, by which mossy cells can influence information passing from the entorhinal cortex via granule cells to hippocampal pyramidal cells. Mossy cells, like CA3 pyramidal cells, are characterized by thorny excrescences on their proximal dendrites, postsynaptic to giant terminals of granule cell axons. In addition to disynaptic input from the entorhinal cortex and perforant path via granule cells, mossy cells may also receive monosynaptic input from the perforant path via special dendrites ascending to the molecular layer. We here report qualitative and quantitative descriptions of Golgi-stained hippocampal mossy cells in mink, based on light microscopic observations and three-dimensional reconstructions. The main focus is on the location, branching pattern, and length of dendrites, particularly those ascending to the granular and molecular layers. In mink, the latter dendrites are more numerous than in rat, but fewer than in primates. They form on average 12% (and up to 29%) of the total dendritic length, and appear to cover the terminal fields of both the lateral and medial perforant paths. In further contrast to rat, the main mossy cell dendrites in mink branch more extensively with distal dendrites encroaching upon the CA3 field. The dendritic arbors extend both along and across the septotemporal axis of the dentate gyrus, not conforming to the lamellar pattern of the hippocampus. The findings suggest that the afferent input to the mossy cells becomes more complex in species closer to primates.
Keywords: hippocampus, Golgi stain, mossy cell, dendrites, dentate gyrus, hilus, fascia dentata
INTRODUCTION
The hippocampal mossy cells, first named so by Amaral (1978), are thought to be a key element in hippocampal function (Buckmaster and Schwartzkroin, 1994; Henze and Buzsáki, 2007; Scharfman and Myers, 2012; Jinde et al., 2013). In all mammals that have been examined, including humans, mossy cells constitute a major component of the neurons located in the polymorph layer (also referred to as the hilus, or Z zone as used by Blackstad, 1963) of the dentate gyrus (Amaral, 1978; Ribak et al., 1985; Frotscher et al., 1991; Seress and Mrzljak, 1992; Amaral et al., 2007). It is well established that perforant path projections from the entorhinal cortex terminate on granule cells in the dentate gyrus, and that these project to CA3 pyramidal cells, which in turn project back to the entorhinal cortex via CA1 pyramidal cells. The mossy cells of the dentate gyrus receive disynaptic input from the entorhinal cortex via collaterals from dentate granule cell axons (Ramón y Cajal, 1911/1955; Blackstad et al., 1970; Claiborne et al., 1986). Besides contacting local interneurons (Scharfman and Schwartzkroin, 1988; Sloviter, 1994; Scharfman, 1995; Zappone and Sloviter, 2004; Larimer and Strowbridge, 2008; Scharfman and Myers, 2012), the mossy cells project back to the granule cells at other septotemporal levels both ipsi-laterally and contralaterally (Zimmer, 1971; Swanson et al., 1978; Laurberg and Sørensen, 1981; Ribak et al., 1985; Scharfman, 1999; Scharfman and Myers, 2012). It is suggested that through this circuitry the mossy cells modulate the stream of information passing from the entorhinal cortex via the granule cells to the hippocampus proper, and thus contribute to spatial navigation, memory, or other functions of this network (Buckmaster and Schwartzkroin, 1994; Lisman, 1999; Henze and Buzsáki, 2007; Myers and Scharfman, 2009; Scharfman and Myers, 2012; Jinde et al., 2013).
A less emphasized, but conspicuous feature of hippocampal mossy cells is the additional monosynaptic input from the perforant path to dendrites ascending to the granular and molecular layers. Such dendrites are reported occasionally in rodents (rat: Amaral, 1978; Scharfman, 1991; Scharfman and Myers, 2012; Buckmaster, 2012; guinea pig: Blackstad, 1985) and routinely in primates including humans (monkey: Buckmaster and Amaral, 2001; human: Frotscher et al., 1991; Seress and Mrzljak, 1992). In hippocampal slices of rat, evidence of both a disynaptic and monosynaptic excitation of mossy cells by stimulation of perforant path fibers has been described (Scharfman, 1991; Buckmaster and Schwartzkroin, 1994). The dentate gyrus is the part of the hippocampus that shows the largest differences across species (Seress, 2007). To advance our understanding of the functional role of the hippocampal circuitry, detailed characterization of mossy cells and their dendrites in the granular and molecular layers are needed from additional species. The American mink (Neovison vison) is a carnivore with a larger and more complex gyrencephalic brain, relative to the lissencephalic rodents. It shares a later common ancestor with primates and has a relatively high learning capacity (Doty et al., 1967), and is more interesting than rat for studies of complex behavior (e.g., Malmkvist et al., 2012; Svendsen et al., 2012; Brandt et al., 2013). But so far little is known about the anatomy of the mink hippocampus (Gościcka et al., 1993; Malmkvist et al., 2012).
Theodor W. Blackstad (TWB), a pioneer in hippocampal anatomical research with profound interest in comparative studies across species, observed in the 1980s that, in mink, the mossy cells extend dendrites into the granular and molecular layers more frequently than apparent in published reports at that time about other mammals. TWB worked for several years on a computer-aided quantitative study of Golgi-impregnated mossy cells in mink. Many years after his death we, his grandson and near colleagues, have completed this work. We here present a detailed qualitative and quantitative characterization of hippocampal mossy cells in mink with material preserved from TWB’s laboratory, with particular emphasis on dendrites of mossy cells extending into the granular and molecular layers.
MATERIALS AND METHODS
Material
The brains of nine healthy young adult mink (Neovison vison), 6-month old, weight ~2 kg (males) and 1 kg (females) were used (Table 1). The animals were obtained from and euthanized at the experimental breeding facility (at Dal, Asker, Norway) of the Norwegian Veterinary College. The animals had been selected by the staff for other purposes, and were euthanized according to standard procedures employed in fur industry in the 1980s: In brief, unconsciousness was produced with an electrical shock, the neck was broken, and the animal exsanguinated. The brain was removed within 0.5–2 h and immersion-fixed (see below). To facilitate access of the fixative to the hippocampal region, some brain tissue around the hippocampus was removed. Five brains were used for Golgi impregnation, and four brains for Timm-thionin staining. Additional documentation about the general morphology of the mink hippocampus was derived from Gościcka et al. (1993), and the public comparative mammalian brain collection (http://brainmuseum.org/).
TABLE 1.
Origin of the Reconstructed and Measured Mossy Cells and Dendrites
| Animal ID | Animal 84 | Animal 85 | Animal 87 | Animal 88 |
|---|---|---|---|---|
| Sex | Male | Male | Male | Female |
| Body weight | ~2 kg | ~2 kg | ~2 kg | ~1 kg |
| Age | 6 months | 6 months | 6 months | 6 months |
| Mean section thickness | 100 μm | 120 μm | 190 μm | 114 μm |
| Number of consecutive sections used for reconstruction | 18 | 6 | 1 | 10 |
| Section stack thickness | 1,800 μm | 720 μm | 1,140 μm | |
| Number of elements studied | 12 cells | 2 cells | 34 gm-dendrites | 3 cells |
| Nick names of cells | mc#1-12 | mc#13-14 | mc#15-17 |
Histological Processing and Staining
The brains destined for Timm-thionin staining were fixed in 3% glutaraldehyde, 30% sucrose, and 0.3–0.4% Na2S in 0.15M phosphate buffer at pH 7.4 for 24 h, transferred to 30% sucrose in 0.1M phosphate buffer at pH 7.4 for 28 h, and then frozen. Cryostat sections (40 μm thick) were made and subjected to Timm staining (Haug, 1973; Zimmer and Haug, 1978). The sections were counterstained with thionin to visualize cell bodies.
Brains for Golgi impregnation (three males, animals 84, 85, 87; one female, animal 88; Table 1) were fixed at room temperature, in 3% paraformaldehyde, 1.25% glutaraldehyde, and 1% sucrose in 0.1M phosphate buffer at pH 7.4. After 3 weeks in the fixative, the brains were trimmed again to further facilitate penetration of liquids. In some brains, the entire (banana-shaped) hippocampus was isolated. The left hippocampus of animal 88 was embedded in one piece, while the others were cut across their longitudinal (septotemporal) axis into 2 to 3 mm thick blocks. Other blocks were cut from whole hemispheres or parts of hemispheres, in various, selected planes. The location of the blocks along the septotemporal axis was determined post hoc by evaluation of the shape of the dentate gyrus and its surroundings.
Chromation was done in 2.4% potassium dichromate with 0.2% osmium tetroxide for 2 days, and 3.0% potassium dichromate for a further few days. Following silver impregnation in 0.75% silver nitrate for 2 days, blocks were taken through a series of ascending ethanol concentrations (1 day) followed by propylene oxide and a propylene oxide-epoxy resin (Araldite) mixture and pure Araldite (1 day), similar to processing for electron microscopy. The next step was polymerization. Dehydration liquids were saturated with silver chromate to prevent precipitated silver chromate (i.e., Golgi impregnation) in fine structures to be washed out. Blocks were covered in a thin shell of agar before silver impregnation to reduce unwanted precipitates on the surface. The agar was removed after the silver impregnation since it impedes penetration of epoxy resin.
Polymerized Golgi blocks were sectioned with a steel knife on a sledge microtome with electronically regulated heating elements in the knife holder, keeping the knife at a temperature of about 70°C. At this temperature, the knife cut compression-free serial sections from hard epoxy resin blocks. Serial sections cut at 100–190 μm were mounted on slides under a coverslip, in unpolymerized resin used for embedding. The slides were then covered with heavy weights to secure flattened sections, and cured at about 60°C.
Microscopy and 3D Reconstruction
Golgi-stained sections were inspected and measured using a Leitz Ortholux microscope equipped with a Leitz drawing tube and a 1–3.23× Leitz Variomat zooming device, using (1) an oil immersion objective with 650 μm working distance (Leitz KS 100×, NA 1.32), (2) a dry objective with working distance of 1,000 μm (Leitz KS 53×, NA 0.95), and (3) a water immersion objective with a working distance of 1.8 mm (Zeiss Orthoplan 40×, NA 0.75). Camera lucida drawings of Golgi-impregnated cells, laminar borders, and fiducial points were made on moisture resistant paper at a magnification of 580× in most cases or 1,524× in rare instances. Drawings of consecutive sections were manually aligned, joining upper and lower ends of cut dendrites at section surfaces, a process much facilitated by the embedding and sectioning procedures. The x and y coordinates of regularly spaced points along mossy cell dendrites were collected from the drawings using a digitizing table (Calcomp 9680) and a custom software tool MicroTrace (Leergaard and Bjaalie, 1995). The z coordinates of the points were read from an enlarged dial on the fine focus knob of the microscope, registered on the drawings, and entered interactively during digitization. Cells located within the same resin block were recorded in the same coordinate system. Z values were corrected for the effects of the difference in refractive indexes of the embedding and immersion media. For resin embedded tissue studied with a 40× water immersion lens an empirically determined factor of 1.167 (Blackstad et al., 1984) was used. This correction was also applied for measurements of section thickness.
Several unpublished custom software tools (developed by TWB) were used for editing of spatial coordinate values and calculation of segment lengths, numbers, and topological order. Three-dimensional (3D) reconstructions were viewed using custom software running on Silicon Graphics Indigo computers, exploiting OpenGL graphic library for rotation, scaling, translation, coloring, and control of vector appearance. Stereoscopic image pairs were generated by applying ~8 degree rotation along one axis. High-resolution digital images of histological sections were acquired using an automated slide scanner system (Axio Scan Z1, Carl Zeiss MicroImaging, Jena, Germany). Images were captured at multiple focal depths, and merged using the extended focus depth tools provided in the Zen Blue software from Carl Zeiss.
Morphological Measurements and Statistical Analyses
Seventeen Golgi-stained mossy cells (Table 2) were selected by TWB and reconstructed from up to 1,800 μm thick stacks of consecutive sections cut from three tissue blocks, one block from each of three animals (Table 1). The cells were sampled from sections cut transverse to the septotemporal axis of the dentate gyrus. Sections were taken from caudal (animal 88) and progressively more rostral locations (animals 85 and 84) in the temporal limb of the left dentate gyrus (Fig. 1). In addition, a group of 34 mossy cell dendrites extending into the granular and molecular layers (in the following referred to as gm-dendrites) was reconstructed from a single 190 μm thick section (also cut transverse to the septotemporal axis of the dentate gyrus) from animal 87 (Table 1). Of these, 21 could be traced microscopically to characteristic main mossy cell dendrites in the polymorph layer within the same section, and were used for quantitative analysis.
TABLE 2.
Measurements of the 17 Golgi-stained Mossy Cells
| Cell names | Start point # |
Branch point # |
End point # |
Segm. # | Mean segm. length (μm) |
Total dendr. length (μm) |
Gm- dendr.# |
Summed length gm-dendr. (μm) |
Summed gm-dendr. length/total dendr. length (%) |
|---|---|---|---|---|---|---|---|---|---|
| mc #1 | 4 | 41 | 45 | 86 | 86 | 7,917 | 0 | 0 | 0 |
| mc #2 | 7 | 60 | 67 | 127 | 97 | 12,349 | 2 | 771 | 6 |
| mc #3 | 3 | 26 | 29 | 55 | 104 | 5,765 | 1 | 250 | 4 |
| mc #4 | 3 | 28 | 31 | 59 | 78 | 4,403 | 3 | 1,153 | 26 |
| mc #5 | 3 | 21 | 24 | 45 | 134 | 5,353 | 3 | 1,217 | 23 |
| mc #6 | 2 | 36 | 38 | 74 | 100 | 7,236 | 0 | 0 | 0 |
| mc #7 | 6 | 44 | 50 | 94 | 103 | 9,684 | 5 | 2,767 | 29 |
| mc #8 | 5 | 36 | 41 | 77 | 107 | 8,218 | 4 | 1,775 | 22 |
| mc #9 | 9 | 61 | 70 | 131 | 102 | 9,700 | 1 | 339 | 3 |
| mc #10 | 7 | 30 | 37 | 67 | 130 | 7,144 | 2 | 946 | 13 |
| mc #11 | 7 | 47 | 54 | 101 | 110 | 10,933 | 3 | 735 | 7 |
| mc #12 | 6 | 41 | 47 | 88 | 123 | 10,189 | 2 | 624 | 6 |
| mc #13 | 5 | 64 | 69 | 133 | 118 | 15,192 | 5 | 1,881 | 12 |
| mc #14 | 3 | 49 | 52 | 101 | 107 | 10,622 | 5 | 2,013 | 19 |
| mc #15 | 4 | 44 | 48 | 92 | 139 | 12,758 | 8 | 3,379 | 26 |
| mc #16 | 4 | 22 | 26 | 48 | 116 | 5,603 | 2 | 761 | 14 |
| mc #17 | 4 | 35 | 39 | 74 | 117 | 8,687 | 1 | 167 | 2 |
| Mean | 4.8 | 40.3 | 44.5 | 85.3 | 110.1 | 8,926.6 | 2.8 | 1,104.5 | 12 |
| SD | 1.9 | 13.1 | 14.5 | 27.4 | 16.1 | 2,928.3 | 2.1 | 971.1 | 10 |
FIGURE 1.

Gross anatomy of the mink hippocampus. (A–C) Illustration of mink brain redrawn from photographs (www.brain-museum.org, Neovison vison, #58-324): (A) The whole brain seen from above with the outlines of the hippocampus (in grey, derived from Gościcka et al., 1993) superimposed. (B) A frontal section (approximate position indicated with arrow in A), with the septal and temporal limbs of the hippocampus interconnected by the fimbria (f). (C) Higher magnification of the boxed area in B with the hippocampal region. (D–G) Microphotographs of the temporal limb of the hippocampus with the dentate gyrus cut transverse to its septotemporal axis from levels approximately corresponding to B and C. (D,E) Golgi impregnation. (D) Border of polymorph layer (p) with CA3 is marked by stippled line. (E) Higher magnification of boxed area (E) in (D), shows the plexus of mossy fiber collaterals in the polymorph layer versus the parallel mossy fibers (arrowheads) in the oriens layer. Mossy cell dendrites crossing the border are indicated by arrow. (F,G) Timm-thionin stain. Mossy fiber bundle marked by arrowhead. (G) Higher magnification of boxed area in (F). The boxed area marked “2B” in (D) is shown at higher magnification in Figure 2B. Fissura hippocampi is indicated by asterisks. Abbr.: a, alveus; CA1, cornu ammonis area 1; CA3, cornu ammonis area 3; DG, dentate gyrus; eb, exposed blade; EC, entorhinal cortex; f, fimbria; g, granular layer; hb, hidden blade; l-m, lacunar-molecular layer; m, molecular layer; mb, middle blade; mc, mossy cell; o, oriens layer; p, polymorph layer; py, pyramidal layer; r, radiate layer. Calibration bars: B, 1 mm; C, 500 μm; D & F, 250 μm; E & G, 100 μm.
Morphological measurements, including total dendritic lengths, were derived from 3D reconstructions of camera lucida drawings. The length of gm-dendrites were in part estimated on the basis of additional manual measurements derived from two-dimensional (2D) camera lucida drawings. These measurements were confirmed in digital section images. For 12 of the cells, two-dimensional dendritic diagrams (Claiborne et al., 1990) were generated, providing linear representations of single stem dendrites from the cell body through branch points to the observed end points, with “straightened” individual dendritic segment lengths, i.e., distance between branch points, measured in 3D space along the dendrite. Descriptive statistical measures were generated using Microsoft Excel. Measurements are reported as mean values with standard deviation (SD). No corrections were made for possible shrinkage of tissue.
Nomenclature
The hippocampal region is anatomically complex, and variable use of terminology and boundary definitions poses researchers with additional challenges. We have adopted the nomenclature of the Terminologia Anatomica (Federative Committee on Anatomical Terminology, 1998) for the dentate gyrus, which is in agreement with Amaral et al. (2007). Also, in accordance with Terminologia Anatomica, we use the term “granular layer” for the layer of granule cell somata, rather than “granule cell layer” which logically would include also the granule cell dendrites, but these dendrites are located in the molecular layer. In contrast to Terminologia Anatomica, we use the term CA3 to include the end portion of the hippocampus proper, instead of the term CA4, which is ill defined with respect to the polymorph layer of the dentate gyrus (Cappaert et al., 2014).
RESULTS
The mink dentate gyrus shares its basic morphology with other mammals, but with some specific traits that to our knowledge have not been described earlier. Therefore, before presenting the mossy cells, we give a brief orientation of the mink hippocampus, with a comparative perspective and focus on the dentate gyrus.
Main Features of the Mink Dentate Gyrus
The mink hippocampus has a c-shaped longitudinal (septotemporal) axis (Gościcka et al., 1993) (Fig. 1A), and therefore occurs twice in frontal sections at certain rostrocaudal levels (Fig. 1B). The septal (dorsal) limb forms a caudally convex curvature extending from near the midline dorsally toward the incipient temporal lobe ventrolaterally. The slightly longer and straighter temporal (ventral) limb (Fig. 1C), from where our cells are sampled, extends rostrally, medially, and ventrally. The dentate gyrus caps the end of CA3. It is curved both along its septotemporal and transverse axis and is located medially in the hippocampus with its concavity toward the fimbria (Figs. 1C,D,F). In sections cut transverse to the septotemporal axis, instead of forming a simple V-shape septally, and a U-shape temporally, as seen in rat (Scharfman and Witter, 2007; Kjonigsen et al., 2015), the mink dentate gyrus at all septotemporal levels forms two crests (one hidden and one exposed), and three blades, here defined as the hidden blade (corresponding to the suprapyramidal blade of rat), the middle blade, and the exposed blade (corresponding to the infrapyramidal blade of rat) (Figs. 1D,F). The crests are about 2 mm apart. Only the exposed blade is exposed to the (medial) surface of the hemisphere, the others line the obliterated hippocampal fissure.
The mammalian dentate gyrus is a three-layered cortex which besides other types of neurons contains two types of interconnected, excitatory glutamatergic projection neurons, granule cells and mossy cells (Amaral and Lavenex, 2006). The granule cell somata are densely packed in the granular layer while the unipolar dendritic trees permeate the molecular layer (Figs. 1D, 5, and 7B). The mossy cells with their somata and main dendrites occupy the polymorph layer (Figs. 2B and 4). In Golgi impregnated sections from mink, cut transverse to the septotemporal axis, the granular layer is roughly 100-μm thick and the molecular layer about 270 μm thick (Fig. 1D). The two layers together are sometimes referred as fascia dentata (Blackstad, 1956, 1958). Microscopic examination of mink granule cells reveals that the thickness and spine density of dendrites vary between cells (Figs. 5 and 7B). The thin granule cell axon (mossy fiber), extends from the cell body to the mossy fiber bundle in CA3 (Figs. 1F and 9). With in the polymorph layer, the axon is seen to give off collaterals (Fig. 2A), which feature large terminals (Figs. 7A,B), somewhat smaller than those of the parent fiber (Fig. 2A). These collaterals form a dense plexus throughout the polymorph layer (Figs. 1D,E), as also observed in other species (Blackstad, 1963, his Figs. 12B and 17C; Claiborne et al., 1986), and used here to define the dentate gyrus/CA3 borderline. The terminals are rich in zinc, and thus responsible for the dense, black staining of the polymorph layer and mossy fiber bundle observed in Timmthionin sections (Figs. 1F,G; see, also Blackstad, 1963, 1985; Haug, 1967, 1974; Wenzel et al., 1997; Blaabjerg and Zimmer, 2007). In Golgi-impregnated sections, the density and extent of the plexus depends on the number of impregnated granule cells (Figs. 1D,E and 7A,B).
FIGURE 7.

Gm-dendrites. Photomicrographs of Golgi sections, (A) two gm-dendrites (arrows) from one mossy cell, with color-coded labels for the polymorph (red), granular (green), and molecular (blue) layers. (B) Four granule cells (gc) with dendrites of various thickness and spine density. Granule cell axons are marked by white arrowheads, their terminals by black arrowheads. Both fields are from the hidden blade. (C) Stereo view of 34 gm-dendrites reconstructed from the hidden blade, with sectors color-coded corresponding to (A). The hippocampal fissure is marked by asterisks. Abbr.: g, granular layer; gc, granule cell; m, molecular layer; p, polymorph layer. Calibration bar in B (100 μm) is also valid for A.
FIGURE 2.

Comparison of mossy cells and CA3 pyramidal cells. Photomicrographs of Golgi sections, (A) two pyramidal cells (py) in CA3 near its end (see, inset), and granule cells (gc) in the hidden (hb) and middle blades (mb) of the dentate gyrus. (B) Higher magnification of boxed area 2B in Figure 1D. Mossy cell mc#13 with two gm-dendrites (arrows) in this section (same cell as in Fig. 3A). (C) A mossy cell from animal 84 (not in the sample used for quantitative analysis). Both mossy cells are from the hidden blade of the dentate gyrus. Excrescences are marked by tailed arrows, mossy fibers by large arrowheads, mossy fiber collaterals by small arrowheads, and the hippocampal fissure by asterisks. Stippled lines indicate border of CA3. Abbr.: g, granular layer; gc, granule cell; hb, hidden blade; l-m, lacunar-molecular layer; m, molecular layer; mb, middle blade; o, oriens layer; p, polymorph layer; py, pyramidal cell; r, radiate layer. Calibration bars: A–C, 50 μm.
FIGURE 4.

Shape and location of mossy cell arbors in stereo view. (A–C) Reconstructed dendritic arbors of four mossy cells shown as stereo pairs. (A) mc #8, (B) mc #15 (also shown in C), and (C): mc #15 (white), #16 (yellow) and #17 (red). Inset figures (right hand side) show the cells reconstructed in A and B projected onto a drawing of the dentate gyrus. In (A) the entrance of gm-dendrites into the granular layer is indicated by arrows, while in (B) both the inner and outer border of the granular layer and the hippocampal fissure are traced at two levels with the upper contours stippled. Borders in (B) also apply to (C). All four cells have gm-dendrites. Together the cells illustrate the space-filling type of arborization of the main dendrites within the polymorph layer. Abbr.: eb, exposed blade; g, granular layer; hb, hidden blade; m, molecular layer; mb, middle blade; o, oriens layer; p, polymorph layer; py, pyramidal layer; r, radiate layer. Calibration bars in B (100 μm) are valid also for A.
FIGURE 5.

Mossy cell in septotemporally cut section. Photomicrograph of a Golgi section cut parallel to the septotemporal axis of the dentate gyrus, with an impregnated mossy cell (mc) (not in the sample used for quantitative analysis) showing a gm-dendrite (arrow), and a few granule cells (gc) with axons (arrowheads). A dendrite oriented perpendicular to the plane of sectioning is marked by a plus symbol, the hippocampal fissure by asterisks. Abbr.: g, granular layer; gc, granule cell; m, molecular layer; mc, mossy cell; p, polymorph layer. Calibration bar, 100 μm.
FIGURE 9.
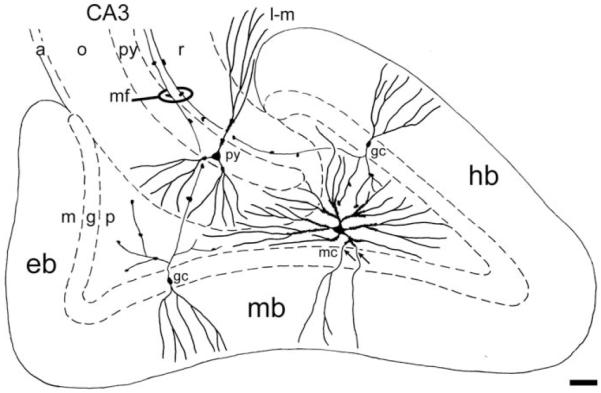
Concluding diagram. Semidiagrammatic drawing of the dentate gyrus and adjacent part of CA3 with focus on the shape of the dendritic arbors of granule cells (gc), mossy cells (mc) and CA3 pyramidal cells (py) and their relation to subdivision boundaries. Axons are not included except for the granule cell axons (mossy fibers, mf), which feature giant terminals synapsing with the thorny excrescences of both mossy and pyramidal cells. The somata and excrescence covered proximal dendrites of mossy cells are confined to the polymorph layer. Special, so-called gm-dendrites (arrows), extend into the granule and molecular layers. Distal dendrites of mossy cells may extend into the subjacent CA3, while dendrites of pyramidal cells seem to respect the border. Abbr.: a, alveus; g, granular layer; eb, exposed blade; gc, granule cell; hb, hidden blade; l-m, lacunar-molecular layer; m, molecular layer; mb, middle blade; mc, mossy cell; mf, mossy fibers; o, oriens layer; p, polymorph layer; py, pyramidal layer/cell; r, radiate layer. Calibration bar, 100 μm.
In mink, the polymorph layer is slimmer and more concave than in rat. At the center of the middle blade, it is only about 100- to 150-μm thick, i.e., only slightly thicker than the granular layer (Figs. 1D–G). Although a subgranular germinal matrix has been identified also in mink (Malmkvist et al., 2012), there is no consistent Timm-negative “subgranular zone” immediately beneath the granular layer (Figs. 1F,G) as described, e.g., in guinea pig (Blackstad, 1963, his Fig. 12C).
As in rat, but in contrast to many other species including primates (Amaral et al., 2007), CA3 in mink remains stratified with a distinct pyramidal layer until its end. Because in mink, the tip of the CA3 pyramidal layer bends toward the hidden blade, the cell- and zinc-poor oriens layer becomes situated adjacent to the cell- and zinc-rich polymorph layer, with a sharp borderline (Figs. 1F,G). In Golgi sections, the border between the polymorph layer and CA3 is also demarcated by the fading root of the alveus (Fig. 1D), through which fibers pass to and from the fimbria. The basal dendrites of CA3 pyramidal cells do not seem to extend beyond the oriens layer and alveus (Figs. 2A and 9). The apical dendrites of the pyramidal cells also avoid the polymorph layer, but achieve this by bending around the tip of the granular and molecular layers of the dentate gyrus, on their way to the lacunar-molecular layer of CA3, as also observed in rat (Amaral, 1978; Buckmaster et al., 1993). The transition between the CA3 and the polymorph layer in mink seems indistinct only at the tip of the pyramidal layer (Fig. 1F), where some modified cell forms occur, as also described in rat (Amaral, 1978; Scharfman, 1993). We have not reconstructed or measured pyramidal cells, but their main features are shown in Figure 2A.
Mossy Cells
Because of certain structural similarities with CA3 pyramidal cells, the mossy cells were originally classified as “modified pyramids” (Lorente de Nó, 1934; Blackstad et al., 1970). As later research has shown, mossy cells and CA3 pyramidal cells are distinct cell types (Amaral, 1978; Buckmaster et al., 1993; Seress, 2007) although they share some conspicuous structural features, notably the thorny excrescences which are postsynaptic to the large mossy fiber terminals. In Golgi impregnated sections, the mossy cells in mink are readily identified by their relatively large soma and their thick proximal dendrites covered with thorny excrescences, with both soma and excrescences slightly larger than those of CA3 pyramidal cells (Figs. 2A–C). There may be some smaller mossy cells without exuberant excrescences (see Scharfman and Myers, 2012 for discussion), but for the purposes of this study, mossy cells were defined by anatomical criteria that could be determined by Golgi staining, which included excrescences. Interneurons (here defined by their lack of excrescences) are scattered between the mossy cells, some with spiny, others with aspiny dendrites (Amaral, 1978; Freund and Buzsáki, 1996; Houser, 2007). We have inspected a large number of Golgi impregnated mossy cells in mink, but the quantitative data are based on the 17 cells sampled by TWB and measured using camera lucida drawings, and computerized 3D reconstructions.
Mossy Cell Somata with Primary Dendrites
Both bi- and multipolar mossy cell somata were observed, depending on the number of primary dendrites (Figs. 3 and 4), which in our sample (n = 17) varies between 2 and 9 per cell (average 4.8, SD 1.9; Table 2). The somata appear to be of the same size or possibly slightly larger than in CA3 pyramidal cells (Fig. 2). Nearly all somata observed (~250) had smooth surfaces (Fig. 2C), but for occasional irregularities (Fig. 3C). The primary dendrites have a broad tapering base that makes it difficult to set a border between soma and dendrite. The initial part of primary dendrites also has a smooth surface, before the characteristic excrescences occur (see below).
FIGURE 3.

Camera lucida drawings of complete mossy cell arbors. (A, B) Two mossy cell arbors drawn at 580× from several sections and projected onto a single plane, (A): mc #13 (same cell as shown in Fig. 2B). (B), mc #2 (caricatured in Fig. 9). The soma and proximal dendrites with excrescences are filled apart from a few dendrites that course perpendicular to the main plane of the drawing. The proximal dendrites are covered with coarse excrescences which are replaced distally by regular spines. The gm-dendrites are marked by arrows. (C) Represents roughly the squared area in (B) drawn at higher magnification (1,524×). Excrescences are indicated by tailed arrows. Dendrites 1 and 2 in B are represented as stem dendritic diagrams in Figure 6B. Abbr.: a, axon. Calibration bars: A, 100 μm (also applies to B); C, 10 μm.
Dendritic Arbors
Complete or nearly complete mossy cell dendritic arbors were reconstructed from several consecutive sections about 100 to 120 μm thick from the temporal limb of the hippocampus in three animals. The mossy cells exhibit a space-filling type of arborization (Fiala and Harris, 1999), with the shapes of the somata and arbors varying with the number of primary dendrites, and the space available in the polymorph layer (Fig. 4). At the two crests, the mossy cell dendrites tend to radiate from the soma in all directions, the arbors filling the polymorph layer, and often extending throughout half of the hidden—exposed dimension of the dentate gyrus, i.e., up to about 1 mm in the transverse dimension (Fig. 4B). In the narrow portion of the polymorph layer at the middle of the dentate gyrus, however, the arbor appears as if it were flattened to fit between the granular layer and CA3 (Fig. 4A).
Upon reaching the deep border of the granular layer (the border with the polymorph layer), the mossy cell dendrites bend and run parallel to the border, indicating a barrier limiting entry of the main dendrites (Figs. 2B and 4), as also described in rat (Scharfman, 1991). It is from these dendrites that we frequently observe special, perpendicularly oriented branches extending into the granular and molecular layers. In the following, we will refer to the granular-molecular mossy cell dendrites as gm-dendrites. At the deep border of the polymorph layer (the border with CA3), on the other hand, the distal end of regular mossy cell dendrites often extend into CA3 (Figs. 1E, 4B, and 9). The excrescence covered proximal parts of the dendrites, however, are confined to the polymorph layer with its plexus of mossy fiber collaterals.
Arbors also extend for a considerable distance in the septotemporal dimension. The arbor of the mossy cell shown in Figure 5 was measured in a single longitudinal section to extend septotemporally for about 900 μm, which is in accordance with data for cells reconstructed from a series of transverse sections. This explains the smaller and less dense appearance of arbors in images of single sections compared to reconstructions of the same arbors, based on several sections (Figs. 2B versus 3A).
Mossy cell dendrites in mink have brush-like arborizations with several generations of branch points close to the cell body, giving rise to long, undivided or sparsely branched distal dendrites (Figs. 2C, 3A,B, and 4A,B). The primary segments are short and the majority of branch points are located within about 200 μm from the cell body (Figs. 6A,B).
FIGURE 6.

Dendritic measurements. (A) Graphic representation of the total number of dendritic branch points as a function of dendritic length from soma estimated for 54 stem dendritic diagrams from 12 mossy cells. Most of the branch points are within 200 μm from the soma with the highest frequency of branching between 60 and 140 μm. This trend is visualized by the grey area interconnecting (A) with (B), the latter figure showing two stem dendritic diagrams (dendrite 1 and 2 from Fig. 3B, mc#2) with branch points. The thicker lines in (B) indicate the stretches covered with excrescences, arrows point to gm-dendrites. (C,D) The total dendritic length per cell seems to be largely independent of the mean segment length per cell (C), but positively correlated with the number of branch points per cell (D).
In our sample, the total dendritic length per mossy cell ranges from 4,403 to 15,192 μm (n = 17), with an average of 8,927 μm (SD 2,928; Table 2). This average may be an underestimate since at least in five of the 3D-reconstructed cells the shape of the impregnated soma indicated the existence of an unimpregnated dendritic stem. Incomplete impregnation of minor, distal dendrites cannot be excluded. In agreement with the presence of many miniature segments proximally at the base of the brush (Fig. 6B), the total dendritic length is more closely related to the number of branch points (Fig. 6D) than to the mean segment length (Fig. 6C), which is remarkably short (110 μm, SD 16, Table 2) in view of the long “brushes.”
In our material, thorny excrescences occur on primary dendrites (Figs. 2B,C and 3) on average 18 μm (n = 36, SD 8) from the soma, and continue past two to five branch points (average 2.74, SD 1.27, n = 36; Fig. 6B), usually covering a branch point before they decrease in size and are replaced by regular spines on the distal dendrites, which are thinner and non-tapering (Figs. 2B,C and 3A,B). An exact border between the excrescence-covered and spine-covered portions was not set. We estimate that the excrescences typically extend about 110 μm from the soma, to a large extent including the parts of the dendrites with extensive branching (Fig. 6A,B). The width of the excrescences over the dendritic shaft is difficult to measure accurately due to the dense Golgi impregnation.
Granular-Molecular Mossy Cell Dendrites (gm-Dendrites)
Fifteen of the 17 sampled mossy cells (88%) were found to have one or more gm-dendrites (Table 2). Typically a distal mossy cell dendrite courses in the polymorph layer close to the border with the granular layer, and upon reaching the border makes an abrupt, often Z-shaped turn, reducing its spine density, and penetrating the granular layer (Figs. 2B, 3A,B, 4, 5, and 7A), similar to the situation described in rats (Scharfman, 1991), guinea pig (Blackstad, 1985), and primates (Buckmaster and Amaral, 2001; Seress, 2007). The gm-dendrites are remarkably slim and straight, and are directed toward the hippocampal fissure. They typically ramify once or twice within the molecular layer. Some gm-dendrites appear to end within the granular or molecular layers (perhaps because of incomplete impregnation?), while others reach the hippocampal fissure.
Within the granular layer, the gm-dendrites may be devoid of spines for a shorter or longer distance (Fig. 7A). The spine density increases toward the molecular layer, but they remain thinner with less spine density than most granule cell dendrites. If viewed in isolation from their dendrites of origin, gm-dendrites may be difficult to distinguish from the thinner variety of granule cell dendrites (Fig. 7B). The number of gm-dendrites per mossy cell (n = 17 cells) in our sample ranges from 0 to 8, with an average of 2.8 gm-dendrites (SD 2.1) per cell (Table 2). The summed length of gm-dendrites per mossy cell ranges from 0 to 3,379 μm, on average 1,105 μm (SD 971) per cell (Table 2). The number and summed length of gm-dendrites per cell are strongly correlated (Fig. 8B), consistent with their uniform structure. The summed length of gm-dendrites per cell constitutes up to 29% of the total dendritic length, but the average is 12% (SD 10; Table 2).
FIGURE 8.

Relation between cell soma location and gm-dendrites; summed gm-dendritic length per cell. (A) Contour of the mink dentate gyrus with the location of the somata (black dots) of the 17 mossy cells sampled for the present study, with cell numbers (Table 2). The deep border of the polymorph layer is indicated by a stippled line. Cells with gm-dendrites extending to two opposing blades are marked by a triangle around the dot, cells with gm-dendrites to one blade by the dot only, while cells without registered gm-dendrites are indicated by a circle around the dot. Abbr.: eb, exposed blade; hb, hidden blade; mb, middle blade. Calibration bar, 100 μm. (B) The number and summed length of gm-dendrites per cell are closely related.
The summed length of the part of the gm-dendrites within the molecular layer (molecular sectors) was measured in one cell (mc#15, Fig. 4B) with 8 gm-dendrites and found to be 2,569 μm, which is one fourth the summed length of the gm-dendrites (3,379 μm, Table 2) and 321 μm per gm-dendrite. This is consistent with measurements in 21 reconstructed gm-dendrites from a single 190 μm thick section (animal 87), where the mean summed length of the molecular sectors was found to be 373 μm. Because the molecular layer is only about 270-μm thick, the calculated mean lengths of the molecular sectors reflect branching, as also visualized in Figure 7C. In this figure, the 21 gm-dendrites are seen intermingled with 13 others which were excluded from the quantitation because, as apparent from the stereo image, their connection with the main mossy cell dendrites in the polymorph layer was not within the section.
Relationship of gm-Dendrite Number and Soma Location
Our cell sample represents all depths and the entire hidden-exposed axis of the polymorph layer (Fig. 8A). Cells feature gm-dendrites irrespective of the depth of their soma in the polymorph layer. The occurrence of gm-dendrites could, however, be influenced by the position of the soma along the hidden-exposed axis. In our sample, the only cells without gm-dendrites were located in the exposed crest and none of the sampled cells had dendrites in the exposed blade. We have observed other mossy cells with gm-dendrites in the exposed blade, but in a systematic registration of gm-dendrites in a series of 15 sections (about 120 μm thick) from animal 85, and 12 sections (about 190 μm thick) from animal 87, we found four times as many gm-dendrites both in the hidden and middle blade as in the exposed blade. The three cells in the exposed crest that are reconstructed together in Figure 4C all had dendrites in the middle blade, but none in the exposed blade. On the contrary, four of the five sampled cells in the hidden crest had gm-dendrites in both the hidden and the middle blade (Fig. 8A), although with a larger number in the nearest blade.
DISCUSSION
We have investigated Golgi-impregnated sections from the mink hippocampus and provided detailed qualitative and quantitative morphological descriptions of the mossy cells in the dentate gyrus, with particular focus on gm-dendrites. We have found that (1) the somata and excrescence-covered proximal dendrites of mossy cells are confined to the polymorph layer, (2) there seems to be a barrier for mossy cell dendrites to enter the granular and molecular layers, except for the special gm-dendrites, (3) the shape of the dendritic arbors depends upon the space available in the polymorph layer, although distal dendrites may cross the border to the subjacent CA3, (4) the total dendritic lengths of Golgi impregnated mossy cells vary considerably, (5) 88% of them have gm-dendrites, which constitute on average 12% of the total dendritic length, while (6) the frequency of gm-dendrites per cell may be less in the exposed blade than in the middle and hidden blades. The overall shape of the dentate gyrus in mink, the relative size and shape of its three layers, the topographic relation of the dentate gyrus to CA3, the topographic relationship between the dendritic arbors of granule cells, mossy cells, and pyramidal cells, the relation of the three cell types to the mossy fibers as well as the relation of their dendritic arbors to subdivision boundaries are summarized in Figure 9.
Methodological Considerations
The Golgi method allows impregnation of a limited, and possibly random, fraction of cells and unmyelinated fibers (Spielmeyer, 1924; Baloyannis, 2015). Topographic relationships between cell types and their locations within subfields may be studied, and it occasionally happens that elements of a circuit (such as granule cells and mossy cells, Fig. 5) are found together without other disturbing elements. Because of incomplete impregnation and sampling problems, however, the quantitative results will be uncertain. Consequently, the total dendritic lengths reported here may be underestimated. In our study, a bias in cell sampling with respect to the proportion of cells with gm-dendrites cannot be excluded. Furthermore, we cannot exclude that some morphological changes may have occurred during the up to 2 h interval between time of death and immersion fixation, but the absence of obvious artifacts indicates that such changes, if any, are subtle. A strength of our approach is that resin embedding minimizes distortion of the tissue and makes 3D reconstructions and measurements more accurate. A comparison of our quantitative data with previous studies in other species based on different methods may be subject to systematic errors, but as a whole, the results seem coherent and consistent with other information. As the cells are all sampled from the temporal limb of the dentate gyrus, possible septotemporal gradients are not addressed.
General Morphology of Mossy Cells
Mossy cells are characterized by the same morphological features in mink as in other mammals, with a relatively large soma and thick dendrites covered proximally with thorny excrescences (rat: Amaral, 1978; Buckmaster, 2012; Scharfman and Myers, 2012; hamster: Murakawa and Kosaka, 2001; guinea pig; Blackstad, 1985; rat and monkey: Frotscher et al., 1991; monkey: Seress and Ribak, 1995; Buckmaster and Amaral, 2001; human: Seress and Mrzljak, 1992). The width and extension of the excrescences vary somewhat across species. Although not measured systematically, the excrescences in mink seem to be intermediate in size to those of rodents and primates. In mink, the soma and initial part of the primary segments have a smooth surface, as in guinea pig (Blackstad, 1985), monkey (Seress and Ribak, 1995; Buckmaster and Amaral, 2001), and human (Seress and Mrzljak, 1992), while in hamster the excrescences also cover these parts of the cell (Murakawa and Kosaka, 2001). In rat, likewise the vast majority of excrescences are on the proximal portions of the dendrites, but a few may also occur on the soma (Amaral, 1978; Frotscher et al., 1991; Buckmaster and Schwartzkroin, 1994; Buckmaster et al., 1996; Scharfman and Myers, 2012).
Buckmaster et al. (1993) found that in rat the mean total length of segments covered with excrescences measured 912 μm (SEM 72), with a range of 676–1,102 μm (n = 6). We did not do corresponding measurements in mink, but we found that the excrescences extended on average to about 110 μm from the cell soma, covering part of the zone of most heavy branching. In rat, Amaral (1978) described a “total encrustation of 40–80 μm of the proximal dendrites with thorny excrescences.”
Mossy Cell Dendritic Arbors
Our findings indicate that mossy cell dendritic arbors in mink largely adapt to the available space within the polymorph layer, as also observed in rat (Amaral, 1978; Claiborne et al., 1986; Scharfman and Myers, 2012) and monkey (Seress and Ribak, 1995), with distal dendrites often extending into the CA3 as in monkey (Buckmaster and Amaral, 2001) and sheep (K.K. Osen, unpublished observation). Unlike mossy cells, the pyramidal cells in the subjacent CA3 do not appear to extend dendrites across the polymorph layer/CA3 border, an observation consistent with findings at least in the rat (Buckmaster et al., 1993; Buckmaster, 2012). It is tempting to speculate that the difference might be related to the source of afferents, based on the idea that pre- and postsynaptic processes provide mutual trophic support during development, but further studies are needed to answer the question.
The size of the dentate gyrus and the mossy cell dendritic arbors (Table 3) vary across species both in absolute and relative terms. Accordingly, while in rat a single mossy cell arbor may span the entire hidden-exposed (transverse) dimension of the polymorph layer (Amaral, 1978; Scharfman and Schwartzkroin, 1988; Buckmaster et al., 1996; Amaral et al., 2007), in mink it may span only one-half of it, and in primates merely a small fraction (Buckmaster and Amaral, 2001).
TABLE 3.
Mossy Cell Total Dendritic Lengths in Various Species
| Species | Range (μm) | Mean of total dendritic length (μm) |
|---|---|---|
| Mousea | NA | 5,392 (SEM 313) |
| Ratb | 7,428–10,924 | 8,292 (SD 1,200) |
| Minkc | 4,403–15,192 | 8,927 (SD 2,928) |
| Monkeyd | 7,338–15,339 | 12,101 (SEM) |
Data from Kowalski et al., 2010 (n = 13).
Based on data from Buckmaster, 2012 (n = 12).
Present study (n = 17).
Data from Buckmaster and Amaral, 2001 (n = 6).
Mossy cell axons, besides innervating the polymorph layer locally, project to the deep molecular layer at distances 1–2 mm from the soma in the septal and temporal directions (Ribak et al., 1985; Buckmaster et al., 1996; Scharfman and Myers, 2012). This commissural/associational pathway is bilateral in rodents (Blackstad, 1956). As shown in mink, the mossy cell dendrites may extend up to 1 mm in the septotemporal dimension. Therefore these cells do not conform to the anisotropic, lamellar organization typical of hippocampal structures (Sloviter and Lømo, 2012), neither with respect to axons nor dendrites. Accordingly, as pointed out by Buckmaster and Amaral (2001), both mossy cell axons and dendrites may be severely amputated by the hippocampal slice procedure.
Total Dendritic Length
In the 17 mink mossy cells the total dendritic length varied between 15,192 and 4,403 μm, mean 8,927 μm. Previous measurements of total dendritic length of mossy cells are available from 12 rat cells intracellularly labelled with biocytin in vivo (Buckmaster, 2012), as well as in 6 monkey cells (Buckmaster and Amaral, 2001), and 13 wild type mouse cells (Kowalski et al., 2010) filled with biocytin in acute slices. In Table 3, these data are compared with the present findings from mink. All groups show variability. The mean total length of mossy cell dendrites in mink (8,927 μm, SD 2,928) is about the same as in rat (8,292 μm, SD 1,200), larger than in mice (5,392 μm, SEM 313 μm) and smaller than in monkey (12,101 μm, SEM 1,265). However, the largest arbor in mink (15,192 μm) is about the same size as the largest arbor in monkey (15,339 μm), both being considerably larger than the largest arbor in rat (10,924 μm). At the same time, the smallest arbor in mink (4,403 μm) is considerably smaller than the smallest arbor both in rat (7,428 μm) and monkey (7,338 μm). It seems reasonable to assume that the larger variability in the total dendritic length of mossy cells in mink, compared to both rat and monkey, is due to the capriciousness of the Golgi method, and that the mossy cells in mink in reality may have a larger mean total dendritic length than in rat, somewhat between rat and monkey despite the relatively small calculated mean.
In rat, the total dendritic lengths of mossy cells and CA3 pyramidal cells are about equal (8,292 μm vs. 8,805 μm; Buckmaster, 2012), whereas in monkey, mossy cells have a larger total dendritic length than the “classical” proximal CA3 pyramidal cells (12,101 μm vs. 9,375 μm; Buckmaster and Amaral, 2001). Mossy cell arbors thus are 1.5 times larger in monkey than in rat, while CA3 pyramidal cell arbors are only 1.1 times larger, which supports the notion of larger species differences in the dentate gyrus than in the hippocampus proper (Seress, 2007). We have not provided quantitative data for CA3 pyramidal cells in mink, but by mere inspection, the mossy cells seem to have a somewhat larger soma and total dendritic length than the CA3 pyramidal cells. The granule cells obviously have smaller total dendritic length than both mossy cells and CA3 pyramidal cells in all of the three species, as also documented quantitatively in rat (Pierce et al., 2011; Buckmaster, 2012).
Branching Pattern
The branching of mossy cell dendrites in mink appears more extensive than in rat. While the mean number of primary dendrites is only slightly larger in mink than in rat (4.8 in mink versus 4 in rat, Buckmaster, 2012), the mean number of dendritic segments per cell is almost three times larger in mink than in rat (85 in mink versus 31 in rat, Buckmaster, 2012), but interestingly enough similar to mouse (80 segments per cell, Kowalski et al., 2010). In addition, the majority of branch points are located closer to the soma in mink than in rat, most branch points occurring within 200 μm (peak at 60–140 μm) from the soma in mink (Fig. 6A), against 400 μm (peak at 180 μm) in rat (Buckmaster, 2012, his Fig. 5E). Although the measures may be influenced by different quantitative methods, i.e., dendritic diagrams (in the present study) versus Sholl analyses (Buckmaster, 2012), the numerical data support our visual impression of a more brush-like arborization of mossy cell dendrites in mink compared with rat, a pattern reminiscent of CA3 pyramidal cells in both species. The extensive branching of mossy cell dendrites in mink is reflected in the fact that the total dendritic length is more strongly correlated with number of branch points than with mean segment length (Fig. 6C,D).
Gm-Dendrites
Special mossy cell dendrites extending into the granular and molecular layers seem to be a general phenomenon, but with some variation across species. In mink, most of the observed mossy cells (88%), had from 1 to 8 gm-dendrites each, on average 2.8 gm-dendrites per cell. According to Buckmaster and Amaral (2001), 90% of mossy cells in monkey have at least one dendritic branch that projects into the molecular layer, on average five per cell. Such dendrites also occur regularly in human (Seress and Mrzljak, 1992). In rodents they may occur less frequently. Amaral (1978) found them only in Golgi material of very young rats, while Blackstad (1985) observed some in guinea pig. In rat studies based on intracellular labelling, Scharfman (1991) found at least one gm-dendrite in many so-called spiny hilar cells (i.e., mossy cells) particularly when the cell body was close to the granular layer. Buckmaster et al. (1993) found a gm-dendrite in 4 out of 34 (12%) biocytin-labelled mossy cells in acute slices, and Buckmaster (2012) found one gm-dendrite in 3 out of 12 (25%) in vivo labelled mossy cells. In wild type mice 2 of 13 (15%) mossy cells labelled with biocytin in acute slices had “two short” dendrites extending into the granular and molecular layers (Kowalski et al., 2010). The diverging results with respect to the frequency of gm-dendrites could perhaps be due to sampling from different septotemporal or hidden-exposed parts of the dentate gyrus. As mentioned, the present material does not provide information on septotemporal gradients. A possible hidden-exposed gradient is discussed below.
In mink, the gm-dendrites constitute on average 12% of the total dendritic length of mossy cells, with about three fourth of the length being located within the molecular layer. Corresponding measures have, as far as we know, not been published in other species. The main afferents to the molecular layer are organized in three levels, the outer third being supplied by the lateral perforant path, the middle third by the medial perforant path, and the inner third by the commissural/associational pathway (Blackstad, 1956; Amaral et al., 2007). While some branches of gm-dendrites do not reach the outer levels, other branches provide gm-dendrites to these levels, right out to the dentate surface (Fig. 7C). Mossy cells, thus, have dendrites in the terminal area of the medial as well as the lateral perforant path. It is noteworthy that at the inner level of the molecular layer, where the mossy cell axons synapse with granule cell dendrites (Ribak et al., 1985; Amaral and Witter, 1989; Buckmaster et al., 1996), they are in a position also to synapse on gm-dendrites belonging to mossy cells of a different septotemporal level than their own level of origin.
Spatial Distribution Gradients in the Dentate Gyrus
In spite of the large variation in arbor shape and total dendritic length, we found no indication of specific subgroups of mossy cells. Mink mossy cells, however, appear to have more gm-dendrites in the hidden (suprapyramidal) and middle blades than in the exposed (infrapyramidal) blade. A difference between the supra- and infrapyramidal blades has been described in rat with respect to granule cells, which have greater total dendritic length, greater number of dendritic segments, and more flattened dendritic arbors in the suprapyramidal blade (Claiborne et al., 1990). In rat, gm-dendrites are found in mossy cells throughout the polymorph layer and both blades (H.E. Scharfman, unpublished data), which is actually also true in mink where it is the frequency that seems to differ.
Spine Density of Granule Cell Dendrites
The differences between granule cells with respect to dendritic spine density observed by us in mink, agree with Golgi studies in mouse (Williams and Matthysse, 1983) and primates (Seress and Frotscher, 1990; Seress, 1992) in which two types of granule cells have been defined, spine rich and spine poor. Because in these studies, the animals were fixed by transcardial perfusion, the findings are unlikely to be an artifact of postmortem changes. Similar variations in granule cell dendrites have been observed by us in either perfusion- or immersion-fixed Golgi material of rat, guinea pig, cat, pig, and sheep (K.K. Osen, unpublished observations). Variation in granule cell spine density has been related to animal age (Duffy and Rakic, 1983). Dentate granule cells are generated throughout life from a germinal center deep to the granular layer (Deshpande et al., 2013; Liu et al., 2014; Pallotto and Deprez, 2014; Yamada et al., 2015), as also demonstrated in mink (Malmkvist et al., 2012), suggesting a relation between spine density, cell age, and functional properties (see e.g., Brunner et al., 2014). This warrants further investigation.
Implications and Perspectives
It seems reasonable to conclude from the available data that mossy cells have more gm-dendrites in mink (about 3 per cell in 88% of the cells) than in rat (1 per cell in <25% of the cells, Buckmaster, 2012), but fewer than in monkey (about 5 per cell in 90% of the cells, Buckmaster and Amaral, 2001). Interestingly, the threshold of mossy cells to perforant path stimulation may be lower when thin distal gm-dendrites are present (Scharfman, 1991). Mossy cells, thus, may be under a more direct influence from the entorhinal cortex in mink than in the much studied rat, but less than in primates. It remains to be elucidated whether the number of gm-dendrites, together with the extensive branching of mossy cell dendrites in general, relates to the relatively high learning capability in mink which in certain aspects approaches that of primates (Doty et al., 1967).
It is also an open question, why gm-dendrites normally are the only mossy cell dendrites that enter the granular layer. The border is open for certain interneurons (Amaral, 1978) and in monkey for the so-called dentate pyramidal cells (Buckmaster and Amaral, 2001). In reeler mutant mice the stratification of the dentate gyrus is disturbed, with both somata and main dendrites of mossy cells being intermingled with granule cells throughout the structure (Kowalski et al., 2010). It also remains to be unresolved why mossy cell dendrites become thinner when they enter into the granular and molecular layer, i.e., the domain of the granule cells, and why the change in diameter is so abrupt.
The new data presented here thus highlight important aspects of the mossy cells in the dentate gyrus of the hippocampus, and emphasize that these cells should be taken into account in attempts to construct computational models of hippocampal function. The structural data about mossy cells in mink support the notion that mossy cells may play a more important role in the hippocampal circuitry in primates and humans than in rat. Increased knowledge about mossy cells is needed, and to this end the mink may provide an interesting model.
Acknowledgments
The authors thank Menno P. Witter, Enrico Mugnaini, and late Carole Hackney for valuable discussions, Sigbjörn Dalum from the Norwegian Veterinary College at Dal (Asker, Norway) for selection and euthanasia of animals, Karen Steentoft for expert histotechnical assistance, Carina Knudsen, Sveinung Lillehaug, Hong Qu, Grazyna Babinska, and Yun Zhou for valuable aid with image acquisition and processing, and Truls Osen for artistic contributions. Histological images were acquired at the Norbrain Slidescanning Facility at the Institute of Basic Medical Sciences, University of Oslo.
REFERENCES
- Amaral DG. A Golgi study of cell types in the hilar region of the hippocampus in the rat. J Comp Neurol. 1978;182:851–914. doi: 10.1002/cne.901820508. [DOI] [PubMed] [Google Scholar]
- Amaral DG, Lavenex P. Hippocampal neuroanatomy. In: Andersen P, Morris R, Amaral D, Bliss T, O’Keefe J, editors. The Hippocampus Book. Oxford University Press; New York: 2006. pp. 37–114. [Google Scholar]
- Amaral DG, Witter MP. The three-dimensional organization of the hippocampal formation: A review of anatomical data. Neuroscience. 1989;31:571–591. doi: 10.1016/0306-4522(89)90424-7. [DOI] [PubMed] [Google Scholar]
- Amaral DG, Scharfman HE, Lavenex P. The dentate gyrus: Fundamental neuroanatomical organization (dentate gyrus for dummies) Prog Brain Res. 2007;163:3–22. doi: 10.1016/S0079-6123(07)63001-5. [DOI] [PMC free article] [PubMed] [Google Scholar]
- Baloyannis SJ. Staining of dead neurons by the Golgi method in autopsy material. Methods Mol Biol. 2015;1254:167–179. doi: 10.1007/978-1-4939-2152-2_13. [DOI] [PubMed] [Google Scholar]
- Blaabjerg M, Zimmer J. The dentate mossy fibers: Structural organization, development and plasticity. Prog Brain Res. 2007;163:85–107. doi: 10.1016/S0079-6123(07)63005-2. [DOI] [PubMed] [Google Scholar]
- Blackstad TW. Commissural connections of the hippocampal region in the rat, with special reference to their mode of termination. J Comp Neurol. 1956;105:417–537. doi: 10.1002/cne.901050305. [DOI] [PubMed] [Google Scholar]
- Blackstad TW. On the termination of some afferents to the hippocampus and fascia dentata: An experimental study in the rat. Acta Anatom. 1958;35:202–214. doi: 10.1159/000141409. [DOI] [PubMed] [Google Scholar]
- Blackstad TW. Ultrastructural studies on the hippocampal region. Prog Brain Res. 1963;3:122–148. [Google Scholar]
- Blackstad TW. Laminar specificity of dendritic morphology: Examples from the guinea pig hippocampal region. In: Agnati L, Fuxe K, editors. Quantitative Neuroanatomy in Transmitter Research. Vol. 42. Plenum Press; New York and London: 1985. pp. 55–69. [Google Scholar]
- Blackstad TW, Brink K, Hem J, Jeune B. Distribution of hippocampal mossy fibers in the rat. An experimental study with silver impregnation methods. J Comp Neurol. 1970;138:433–449. doi: 10.1002/cne.901380404. [DOI] [PubMed] [Google Scholar]
- Blackstad TW, Osen KK, Mugnaini E. Pyramidal neurones of the dorsal cochlear nucleus: A Golgi and computer reconstruction study in cat. Neuroscience. 1984;13:827–854. doi: 10.1016/0306-4522(84)90099-x. [DOI] [PubMed] [Google Scholar]
- Brandt C, Malmkvist J, Nielsen RL, Brande-Lavridsen N, Surlykke A. Development of vocalization and hearing in American mink (Neovison vison) J Exp Biol. 2013;216:3542–3550. doi: 10.1242/jeb.080226. [DOI] [PubMed] [Google Scholar]
- Brunner J, Neubrandt M, Van-Weert S, Andrasi T, Kleine Borgmann FB, Jessberger S, Szabadics J. Adult-born granule cells mature through two functionally distinct states. eLife. 2014;3:e03104. doi: 10.7554/eLife.03104. [DOI] [PMC free article] [PubMed] [Google Scholar]
- Buckmaster PS. Mossy cell dendritic structure quantified and compared with other hippocampal neurons labeled in rats in vivo. Epilepsia. 2012;53(Suppl 1):9–17. doi: 10.1111/j.1528-1167.2012.03470.x. [DOI] [PMC free article] [PubMed] [Google Scholar]
- Buckmaster PS, Amaral DG. Intracellular recording and labeling of mossy cells and proximal CA3 pyramidal cells in macaque monkeys. J Comp Neurol. 2001;430:264–281. doi: 10.1002/1096-9861(20010205)430:2<264::aid-cne1030>3.0.co;2-3. [DOI] [PubMed] [Google Scholar]
- Buckmaster PS, Schwartzkroin PA. Hippocampal mossy cell function: A speculative view. Hippocampus. 1994;4:393–402. doi: 10.1002/hipo.450040402. [DOI] [PubMed] [Google Scholar]
- Buckmaster PS, Strowbridge BW, Schwartzkroin PA. A comparison of rat hippocampal mossy cells and CA3c pyramidal cells. J Neurophysiol. 1993;70:1281–1299. doi: 10.1152/jn.1993.70.4.1281. [DOI] [PubMed] [Google Scholar]
- Buckmaster PS, Wenzel HJ, Kunkel DD, Schwartzkroin PA. Axon arbors and synaptic connections of hippocampal mossy cells in the rat in vivo. J Comp Neurol. 1996;366:271–292. doi: 10.1002/(sici)1096-9861(19960304)366:2<270::aid-cne7>3.0.co;2-2. [DOI] [PubMed] [Google Scholar]
- Cappaert N, Van Strien N, Witter M. Hippocampal formation. In: Paxinos G, editor. The Rat Brain. Elsevier Academic Press; San Diego: 2014. pp. 511–574. [Google Scholar]
- Claiborne BJ, Amaral DG, Cowan WM. A light and electron microscopic analysis of the mossy fibers of the rat dentate gyrus. J Comp Neurol. 1986;246:435–458. doi: 10.1002/cne.902460403. [DOI] [PubMed] [Google Scholar]
- Claiborne BJ, Amaral DG, Cowan WM. Quantitative, three-dimensional analysis of granule cell dendrites in the rat dentate gyrus. J Comp Neurol. 1990;302:206–219. doi: 10.1002/cne.903020203. [DOI] [PubMed] [Google Scholar]
- Deshpande A, Bergami M, Ghanem A, Conzelmann KK, Lepier A, Götz M, Berninger B. Retrograde monosynaptic tracing reveals the temporal evolution of inputs onto new neurons in the adult dentate gyrus and olfactory bulb. Proc Natl Acad Sci USA. 2013;110:E1152–E1161. doi: 10.1073/pnas.1218991110. [DOI] [PMC free article] [PubMed] [Google Scholar]
- Doty BA, Jones CN, Doty LA. Learning-set formation by mink, ferrets, skunks, and cats. Science. 1967;155:1579–1580. doi: 10.1126/science.155.3769.1579. [DOI] [PubMed] [Google Scholar]
- Duffy CJ, Rakic P. Differentiation of granule cell dendrites in the dentate gyrus of the rhesus monkey: A quantitative Golgi study. J Comp Neurol. 1983;214:224–237. doi: 10.1002/cne.902140210. [DOI] [PubMed] [Google Scholar]
- Federative Committee on Anatomical Terminogy . Terminologia Anatomica: International Anatomical Terminology. Thieme; Stuttgart: 1998. [Google Scholar]
- Fiala J, Harris K. Dendrite structure. In: Stuart G, Spruston N, Häusser M, editors. Dendrites. Oxford University Press; Oxford, UK: 1999. pp. 1–34. [Google Scholar]
- Freund TF, Buzsáki G. Interneurons of the hippocampus. Hippocampus. 1996;6:347–470. doi: 10.1002/(SICI)1098-1063(1996)6:4<347::AID-HIPO1>3.0.CO;2-I. [DOI] [PubMed] [Google Scholar]
- Frotscher M, Seress L, Schwerdtfeger WK, Buhl E. The mossy cells of the fascia dentata: A comparative study of their fine structure and synaptic connections in rodents and primates. J Comp Neurol. 1991;312:145–163. doi: 10.1002/cne.903120111. [DOI] [PubMed] [Google Scholar]
- Gościcka D, Stankiewicz W, Szpinda M. Hippocampus in the N. American mink (Mustela vison Brisson, 1756) Arch Vet Polonicum. 1993;33:129–34. [PubMed] [Google Scholar]
- Haug FM. Electron microscopical localization of the zinc in hippocampal mossy fibre synapses by a modified sulfide silver procedure. Histochemie. 1967;8:355–368. doi: 10.1007/BF00401978. [DOI] [PubMed] [Google Scholar]
- Haug FM. Heavy metals in the brain. A light microscope study of the rat with Timm’s sulphide silver method. Methodological considerations and cytological and regional staining patterns. Adv Anat Embryol Cell Biol. 1973;47:1–71. [PubMed] [Google Scholar]
- Haug FM. Light microscopical mapping of the hippocampal region, the pyriform cortex and the corticomedial amygdaloid nuclei of the rat with Timm’s sulphide silver method. I. Area dentata, hippocampus and subiculum. Zeitschrift Für Anatomie Und Entwicklungsgeschichte. 1974;145:1–27. doi: 10.1007/BF00519123. [DOI] [PubMed] [Google Scholar]
- Henze DA, Buzsáki G. Hilar mossy cells: Functional identification and activity in vivo. Prog Brain Res. 2007;163:199–216. doi: 10.1016/S0079-6123(07)63012-X. [DOI] [PubMed] [Google Scholar]
- Houser CR. Interneurons of the dentate gyrus: An overview of cell types, terminal fields and neurochemical identity. Prog Brain Res. 2007;163:217–232. doi: 10.1016/S0079-6123(07)63013-1. [DOI] [PubMed] [Google Scholar]
- Jinde S, Zsiros V, Nakazawa K. Hilar mossy cell circuitry controlling dentate granule cell excitability. Front Neural Circ. 2013;7:14. doi: 10.3389/fncir.2013.00014. [DOI] [PMC free article] [PubMed] [Google Scholar]
- Kjonigsen LJ, Lillehaug S, Bjaalie JG, Witter MP, Leergaard TB. Waxholm Space atlas of the rat brain hippocampal region: Three-dimensional delineations based on magnetic resonance and diffusion tensor imaging. Neuroimage. 2015;108:441–449. doi: 10.1016/j.neuroimage.2014.12.080. [DOI] [PubMed] [Google Scholar]
- Kowalski J, Geuting M, Paul S, Dieni S, Laurens J, Zhao S, Vida I. Proper layering is important for precisely timed activation of hippocampal mossy cells. Cereb Cortex. 2010;20:2043–2054. doi: 10.1093/cercor/bhp267. [DOI] [PubMed] [Google Scholar]
- Larimer P, Strowbridge BW. Nonrandom local circuits in the dentate gyrus. J Neurosci. 2008;28:12212–12223. doi: 10.1523/JNEUROSCI.3612-08.2008. [DOI] [PMC free article] [PubMed] [Google Scholar]
- Laurberg S, Sørensen KE. Associational and commissural collaterals of neurons in the hippocampal formation (hilus fasciae dentatae and subfield CA3) Brain Res. 1981;212:287–300. doi: 10.1016/0006-8993(81)90463-7. [DOI] [PubMed] [Google Scholar]
- Leergaard TB, Bjaalie JG. Semi-automatic data acquisition for quantitative neuroanatomy. MicroTrace–computer programme for recording of the spatial distribution of neuronal populations. Neurosci Res. 1995;22:231–243. doi: 10.1016/0168-0102(95)00899-6. [DOI] [PubMed] [Google Scholar]
- Lisman JE. Relating hippocampal circuitry to function: Recall of memory sequences by reciprocal dentate-CA3 interactions. Neuron. 1999;22:233–242. doi: 10.1016/s0896-6273(00)81085-5. [DOI] [PubMed] [Google Scholar]
- Liu S, Li C, Xing Y, Tao F. Effect of transplantation of human embryonic stem cell-derived neural progenitor cells on adult neurogenesis in aged hippocampus. Am J Stem Cells. 2014;3:21–26. [PMC free article] [PubMed] [Google Scholar]
- Lorente de Nó R. Studies of the structure of the cerebral cortex. II. Continuation of the study of the ammonic system. J Psychol Neurol. 1934;46:113–177. [Google Scholar]
- Malmkvist J, Brix B, Henningen K, Wiborg O. Hippocampal neurogenesis increase with stereotypic behavior in mink (Neovison vison) Behav Brain Res. 2012;229:359–364. doi: 10.1016/j.bbr.2012.01.027. [DOI] [PubMed] [Google Scholar]
- Murakawa R, Kosaka T. Structural features of mossy cells in the hamster dentate gyrus, with special reference to somatic thorny excrescences. J Comp Neurol. 2001;429:113–126. doi: 10.1002/1096-9861(20000101)429:1<113::aid-cne9>3.0.co;2-d. [DOI] [PubMed] [Google Scholar]
- Myers CE, Scharfman HE. A role for hilar cells in pattern separation in the dentate gyrus: A computational approach. Hippocampus. 2009;19:321–337. doi: 10.1002/hipo.20516. [DOI] [PMC free article] [PubMed] [Google Scholar]
- Pallotto M, Deprez F. Regulation of adult neurogenesis by GABAergic transmission: Signaling beyond GABAA-receptors. Front Cell Neurosci. 2014;8:166. doi: 10.3389/fncel.2014.00166. [DOI] [PMC free article] [PubMed] [Google Scholar]
- Pierce JP, McCloskey DP, Scharfman HE. Morphometry of hilar ectopic granule cells in the rat. J Comp Neurol. 2011;519:1196–1218. doi: 10.1002/cne.22568. [DOI] [PMC free article] [PubMed] [Google Scholar]
- Ramón y Cajal SS. Histologie du systeme nerveux de l’homme et des vertebres. T.II. A. Maloine 1911; Paris: 1955. reprinted Madrid: Instituto Cajal 1955. [Google Scholar]
- Ribak CE, Seress L, Amaral DG. The development, ultrastructure and synaptic connections of the mossy cells of the dentate gyrus. J Neurocytol. 1985;14:835–857. doi: 10.1007/BF01170832. [DOI] [PubMed] [Google Scholar]
- Scharfman HE. Dentate hilar cells with dendrites in the molecular layer have lower thresholds for synaptic activation by perforant path than granule cells. J Neurosci. 1991;11:1660–1673. doi: 10.1523/JNEUROSCI.11-06-01660.1991. [DOI] [PMC free article] [PubMed] [Google Scholar]
- Scharfman HE. Spiny neurons of area CA3c in rat hippocampal slices have similar electrophysiological characteristics and synaptic responses despite morphological variation. Hippocampus. 1993;3:9–28. doi: 10.1002/hipo.450030103. [DOI] [PubMed] [Google Scholar]
- Scharfman HE. Electrophysiological evidence that dentate hilar mossy cells are excitatory and innervate both granule cells and interneurons. J Neurophysiol. 1995;74:179–194. doi: 10.1152/jn.1995.74.1.179. [DOI] [PubMed] [Google Scholar]
- Scharfman HE. The role of nonprincipal cells in dentate gyrus excitability and its relevance to animal models of epilepsy and temporal lobe epilepsy. Adv Neurol. 1999;79:805–820. [PubMed] [Google Scholar]
- Scharfman HE, Myers CE. Hilar mossy cells of the dentate gyrus: A historical perspective. Front Neural Circ. 2012;6:106. doi: 10.3389/fncir.2012.00106. [DOI] [PMC free article] [PubMed] [Google Scholar]
- Scharfman HE, Schwartzkroin PA. Electrophysiology of morphologically identified mossy cells of the dentate hilus recorded in guinea pig hippocampal slices. J Neurosci. 1988;8:3812–3821. doi: 10.1523/JNEUROSCI.08-10-03812.1988. [DOI] [PMC free article] [PubMed] [Google Scholar]
- Scharfman HE, Witter MP. The Dentate Gyrus: A Comprehensive Guide to Structure, Function and Clinical Implications. Elsevier; New York, NY: 2007. Preface. [Google Scholar]
- Seress L. Morphological variability and developmental aspects of monkey and human granule cells: Differences between the rodent and primate dentate gyrus. Epilepsy Res Suppl. 1992;7:3–28. [PubMed] [Google Scholar]
- Seress L. Comparative anatomy of the hippocampal dentate gyrus in adult and developing rodents, non-human primates and humans. Prog Brain Res. 2007;163:23–41. doi: 10.1016/S0079-6123(07)63002-7. [DOI] [PubMed] [Google Scholar]
- Seress L, Frotscher M. Morphological variability is a characteristic feature of granule cells in the primate fascia dentata: A combined Golgi/electron microscope study. J Comp Neurol. 1990;293:253–267. doi: 10.1002/cne.902930208. [DOI] [PubMed] [Google Scholar]
- Seress L, Mrzljak L. Postnatal development of mossy cells in the human dentate gyrus: A light microscopic Golgi study. Hippocampus. 1992;2:127–141. doi: 10.1002/hipo.450020205. [DOI] [PubMed] [Google Scholar]
- Seress L, Ribak CE. Postnatal development and synaptic connections of hilar mossy cells in the hippocampal dentate gyrus of rhesus monkeys. J Comp Neurol. 1995;355:93–110. doi: 10.1002/cne.903550111. [DOI] [PubMed] [Google Scholar]
- Sloviter RS. The functional organization of the hippocampal dentate gyrus and its relevance to the pathogenesis of temporal lobe epilepsy. Ann Neurol. 1994;35:640–654. doi: 10.1002/ana.410350604. [DOI] [PubMed] [Google Scholar]
- Sloviter RS, Lømo T. Updating the lamellar hypothesis of hippocampal organization. Front Neural Circ. 2012;6:102. doi: 10.3389/fncir.2012.00102. [DOI] [PMC free article] [PubMed] [Google Scholar]
- Spielmeyer W. Technik der mikroskopischen Untersuchung des Nervensystems. 3rd ed Verlag von Julius Springer; Berlin: 1924. p. 77p. [Google Scholar]
- Svendsen PM, Malmkvist J, Halekoh U, Mendl M. Responses of mink to auditory stimuli: Prerequisites for applying the “cognitive bias” approach. Behav Process. 2012;91:291–297. doi: 10.1016/j.beproc.2012.09.010. [DOI] [PubMed] [Google Scholar]
- Swanson LW, Wyss JM, Cowan WM. An autoradiographic study of the organization of intrahippocampal association pathways in the rat. J Comp Neurol. 1978;181:681–715. doi: 10.1002/cne.901810402. [DOI] [PubMed] [Google Scholar]
- Wenzel HJ, Cole TB, Born DE, Schwartzkroin PA, Palmiter RD. Ultrastructural localization of zinc transporter-3 (ZnT-3) to synaptic vesicle membranes within mossy fiber boutons in the hippocampus of mouse and monkey. Proc Natl Acad Sci USA. 1997;94:12676–12681. doi: 10.1073/pnas.94.23.12676. [DOI] [PMC free article] [PubMed] [Google Scholar]
- Williams RS, Matthysse S. Morphometric analysis of granule cell dendrites in the mouse dentate gyrus. J Comp Neurol. 1983;215:154–164. doi: 10.1002/cne.902150204. [DOI] [PubMed] [Google Scholar]
- Yamada M, Clark J, McClelland C, Capaldo E, Ray A, Iulianella A. Cux2 activity defines a subpopulation of perinatal neuro-genic progenitors in the hippocampus. Hippocampus. 2015;25:253–267. doi: 10.1002/hipo.22370. [DOI] [PMC free article] [PubMed] [Google Scholar]
- Zappone CA, Sloviter RS. Translamellar disinhibition in the rat hippocampal dentate gyrus after seizure-induced degeneration of vulnerable hilar neurons. J Neurosci. 2004;24:853–864. doi: 10.1523/JNEUROSCI.1619-03.2004. [DOI] [PMC free article] [PubMed] [Google Scholar]
- Zimmer JJ. Ipsilateral afferents to the commissural zone of the fascia dentata, demonstrated in decommissurated rats by silver impregnation. J Comp Neurol. 1971;142:393–416. doi: 10.1002/cne.901420402. [DOI] [PubMed] [Google Scholar]
- Zimmer J, Haug FM. Laminar differentiation of the hippocampus, fascia dentata and subiculum in developing rats, observed with the Timm sulphide silver method. J Comp Neurol. 1978;179:581–617. doi: 10.1002/cne.901790309. [DOI] [PubMed] [Google Scholar]