

Summary
The remarkable success of immune therapies emphasizes the need for immune competent cancer models. Elegant genetically engineered mouse models of a variety of cancers have been established, but their effective use is limited by cost and difficulties in rapidly generating experimental data. Some mouse cancer cell lines are transplantable to immunocompetent host mice and have been utilized extensively to study cancer immunology. Here we describe a comprehensive system of mouse melanoma cell lines that are syngeneic to C57Bl/6J, have well-defined human-relevant driver mutations, and are genomically stable. These will be a useful tool for the study of tumor immunology and genotype-specific cancer biology.
Keywords: melanoma, mouse models, cell lines, YUMM, cancer immunology
Introduction
Murine cancer cell lines have been extensively utilized in cancer biology research, and have led to the delineation of fundamental biological properties of cancer cells, the identification of new signaling pathways, the development of new therapies, and have helped to define mechanisms of therapeutic resistance (Semenza et al., 2013; Liu et al., 2010; Obenauf et al., 2015; Longley et al., 2005). Cancer cell lines have also been utilized to evaluate the response of the immune system to cancer (Gubin et al., 2014). Generally this has been achieved by deriving cancer cell lines from tumors either arising spontaneously in inbred strains of mice (Cloudman et al., 1941) or from tumors induced in inbred mice by treatment with chemical carcinogens (Takizawa et al., 1985).
The B16 mouse melanoma cell line is one of the most widely used cancer cell lines and has been cited in over 17,000 studies through 2015. The B16 cell line was derived from a spontaneously arising melanoma in an inbred C57Bl/6 mouse over 86 years ago (Harding et al., 1930). This line has been used to define basic melanoma biology, features of organ-specific metastasis, and to evaluate the tumor-immune response. While the B16 line has been extraordinarily useful, it’s utility is limited by several factors: 1) it is a relatively unique line with no obvious analogs, making validation/confirmation experiments more difficult to plan and execute, 2) the genetic drivers of B16 have not been well-defined, making it difficult to translate to genotype-specific melanoma subsets, and 3) retroviral elements in B16 have been shown to be important for tumor formation, but importantly could affect the mechanism by which tumor immune responses are generated and confound generalizability. While B16 has been very useful for the study of melanoma tumor biology, these limitations make clear that additional mouse melanoma cell lines that can engraft in immunocompetent C57Bl/6 mice would be very useful.
Advances in technology have made it possible to induce specific, human-relevant genetic changes in a cell type specific fashion in vivo. Such advances enabled the creation of the Braf/Pten melanoma genetically engineered mouse model (GEMM) described by Dankort et al. in 2009. The Braf/Pten model is a highly penetrant melanoma GEMM in which melanomas develop with very short latency. Importantly, the Braf/Pten model was designed to recapitulate genetic alterations found in a large subset of human melanomas. While this model is relatively experimentally tractable, it did not appear to induce a marked immune response, possibly because of the lack of additional somatic mutations/neoepitopes. We and others have generated several additional GEMMs based on additional specific genetic alterations relevant to melanoma biology (Nogueira et al., 2010). These different models each have different properties that recapitulate several key features of genotypically similar human melanomas. While these GEMMs are useful in the sense that they model a majority of genetically-defined human melanomas, they are limited by the need to maintain complex mouse colonies with the multiple different genotypes needed to perform the appropriate crosses to generate experimentally useful animals.
In order to make melanoma GEMMs more experimentally tractable, several of the relevant alleles have been backcrossed into C57Bl/6J mice, an immunologically-relevant mouse inbred genetic background. The congenic mice were then interbred in order to generate the relevant models so that tumors could be induced and used to establish cell lines (Jenkins et al., 2014). This approach allows for the generation of cell lines with desired genetic changes that are relevant to human melanoma formation and progression. Brinckerhoff and colleagues described lines derived from the Braf/Pten model; others groups have also recently utilized these lines in published reports (Fragomeni et al, 2013; Jenkins et al., 2015).
Here we describe a series of >37 congenic C57Bl/6J mouse melanoma cell lines derived from 10 distinct combinations of genetic drivers relevant to human melanoma. We have termed this collection of cell lines the Yale University Mouse Melanoma (YUMM) lines. We anticipate that the YUMM lines will useful for the study of cancer biology and tumor immunology and to allow for the evaluation and identification of the new therapeutic approaches, including generating novel immune based therapies.
Results
Relevant alleles for melanoma GEMMs were backcrossed to the C57Bl/6J background for at least 10 generations. The backcrossed alleles were then interbred in order to reassemble the specific genetically defined models of melanoma, many of which have been described (Supplementary Table 1). Melanomas were generated using topically applied 4-hydroxytamoxifen to induce Cre-lox recombination of conditional alleles. Cell lines were then derived from tumors that were at least 100 mm3 in size. Cell line derivation included mechanical and enzymatic dissociation of melanoma cells in preparation for in vitro culture (Fig. 1; Supp. Fig. 1). The cells were named Yale University Mouse Melanoma (YUMM) followed by a number corresponding to the genotype (Table 1). Additional lines of the same genotype were designated by a second number and separated by a period from the genotype-designated number. For instance, YUMM1.1 and YUMM1.7 represent two distinct lines derived from melanomas driven by Braf activation, Pten inactivation, and Cdkn2a inactivation. Greater than 37 congenic melanoma lines have been derived to date and are summarized in Table 1. Characterization of two lines (YUMM1.7 and YUMM1.9) revealed that only one expressed somatic nucleotide variant (with an allele frequency greater than 0.2) was evident when comparing the two lines by RNA-Seq (Supp Fig 1). This low rate of somatic mutations is in keeping with other GEMM-derived tumors (de Jel et al., 2014). Together this collection of cell lines is representative of the majority of genetic combinations observed in human melanoma, and includes BRAF mutant, NRAS mutant, and triple wildtype (lacking mutations in BRAF, NRAS, and NF1).
Figure 1. Derivation of YUMM lines.

(A) Mice containing the appropriate allele combination were activated with 4-hydroxytamoxifen (4-OHT) for tumor induction at the site of application.
(B) Depending on the allele combinations, the mice develop tumors from 1–6 months after the application of 4-OHT.
(C) Approximately 1×1×1 mm tumor pieces were removed from the tumor, washed by with 70% ethanol and sequential 1× PBS containing 2% pen-strep washes.
(D) Tumors were minced finely and added to flasks for containing DMEM-F12 with 10% FBS.
Table 1. YUMM Cell Lines.
The left column consists of the designated of the cell line based off the acronym YUMM (Yale University Mouse Melanoma). The numbers in the cell line name correspond to the genotype followed by a period and then another number for the cell line of that genotype. The alleles utilized are listed in supp Table 1. YUMM7–10 are still in the process of being isolated.
| Cell line name | Genotype | Sex | Notes |
|---|---|---|---|
| YUMM1.1 | BrafV600E/wt Pten−/− Cdkn2−/− | Male | Similar to 1.3 |
| YUMM1.2 | BrafV600E/wt Pten−/− Cdkn2−/− | Male | Spontaneous melanoma |
| YUMM1.3 | BrafV600E/wt Pten−/− Cdkn2−/− | Male | Similar to 1.1 |
| YUMM1.4 | BrafV600E/wt Pten−/− Cdkn2−/− | Male | |
| YUMM1.5 | BrafV600E/wt Pten−/− Cdkn2−/− | Male | |
| YUMM1.6 | BrafV600E/wt Pten−/− Cdkn2−/− | Male | |
| YUMM1.7 | BrafV600E/wt Pten−/− Cdkn2−/− | Male | Similar to 1.9 |
| YUMM1.8 | BrafV600E/wt Pten−/− Cdkn2−/− | Male | |
| YUMM1.9 | BrafV600E/wt Pten−/− Cdkn2−/− | Male | Similar to 1.7 |
| YUMM1.10 | BrafV600E/wt Pten−/− Cdkn2−/− | Male | |
| YUMM1.11 | BrafV600E/wt Pten−/− Cdkn2−/− | Male | |
| YUMM1.12 | BrafV600E/wt Pten−/− Cdkn2−/− | Male | |
| YUMM1.13 | BrafV600E/wt Pten−/− Cdkn2−/− | Male | |
| YUMM1.14 | BrafV600E/wt Pten−/− Cdkn2−/− | Female | |
| YUMM1.15 | BrafV600E/wt Pten−/− Cdkn2−/− | Female | |
| YUMM1.G1 | BrafV600E/wt Pten−/− Cdkn2−/− Mc1r e/e | Female | |
| YUMM1.G2 | BrafV600E/wt Pten−/− Cdkn2−/− Mc1r e/e | Female | |
| YUMM1.G3 | BrafV600E/wt Pten−/− Cdkn2−/− Mc1r e/e | Female | |
| YUMM1.G4 | BrafV600E/wt Pten−/− Cdkn2−/− Mc1r e/e | Female | |
| YUMM1.G5 | BrafV600E/wt Pten−/− Cdkn2−/− Mc1r e/e | Female | |
| YUMM2.1 | BrafV600E/wt Pten−/− Cdkn2+/−Bcat loxex3/wt | Male | Partial Bcat STA/wt recombination |
| YUMM2.1R | BrafV600E/wt Pten−/− Cdkn2+/−Bcat STA/wt | Male | Full Bcat STA/wt recombination |
| YUMM2.2 | BrafV600E/wt Pten−/− Cdkn2+/−Bcat loxex3/wt | Male | Partial Bcat STA/wt recombination |
| YUMM2.2R | BrafV600E/wt Pten−/− Cdkn2+/−Bcat STA/wt | Male | Full Bcat STA/wt recombination |
| YUMM3.1 | BrafV600E/wt Cdkn2−/− | Female | |
| YUMM3.2 | BrafV600E/wt Cdkn2−/− | Female | |
| YUMM3.3 | BrafV600E/wt Cdkn2−/− | Female | |
| YUMM3.4 | BrafV600E/wt Cdkn2−/− | Female | |
| YUMM4.1 | Pten−/− Cdkn2−/− | Female | |
| YUMM4.2 | Pten−/− Cdkn2−/− | Female | |
| YUMM4.3 | Pten−/− Cdkn2−/− | Female | |
| YUMM4.4 | Pten−/− Cdkn2−/− | Female | |
| YUMM5.1 | BrafV600E/wt p53−/− | Male | |
| YUMM5.2 | BrafV600E/wt p53−/− | Male | |
| YUMM5.3 | BrafV600E/wt p53−/− | Male | |
| YUMM5.4 | BrafV600E/wt p53−/− | Male | |
| YUMM6.1 | BrafV600E/wt Pten−/− | Female | |
| YUMM7 | BrafV600E/wt Cdkn2−/− Bcat STA/wt | Future lines | |
| YUMM8 | BrafV600E/wt Cdkn2−/−Lkb1−/− | Future lines | |
| YUMM9 | Nras Q61R Cdkn2a−/− | Future lines | |
| YUMM10 | Nras Q61R p53−/− | Future lines |
Proliferation of a subset of YUMM lines was evaluated both in vitro and in vivo. YUMM1.1 and YUMM2.1 have slower proliferation rates than YUMM1.7 and YUMM5.2 in vitro, while YUMM3.3 has an intermediate rate (Fig. 2A). YUMM1.7 and YUMM1.1 have similar tumor growth rates in vivo following subcutaneous injection of 100,000 cells in C57BL/6 mice, forming tumors 1 cm3 in volume by 5 weeks. YUMM2.1 and YUMM5.2 have a slightly slower growth rate in vivo and form 1 cm3 tumors of approximately 7 weeks after inoculation (Fig. 2B). Growth of the YUMM cell lines to 1 cm3 in vivo after subcutaneous injection is faster than development of endogenous tumors in the corresponding GEMMs. For example the Braf/Pten/Cdkn2a GEMM, which has the same genetic changes as YUMM1, takes 6–8 weeks to form 1 cm3 when tumors are induced topically in the GEMM (Sup 1). Other GEMMs, such as the p53/Braf model, typically take 3–4 months following 4-hydroxytamoxifen induction to produce a 1 cm3 tumor. When the corresponding YUMM line is injected subcutaneously, tumor growth to 1 cm3 occurs within 7 weeks (Fig. 2B). The specific histologic features observed with individual GEMMs are retained in culture and re-emerge following tumor formation after subcutaneous injection (Fig. 2). For example, the relatively pronounced degree of nuclear pleomorphism in the Braf/p53 GEMM model is also present in grafted YUMM5.2 tumors (Fig. 2C, 2D).
Figure 2. Growth characteristics of YUMM lines.
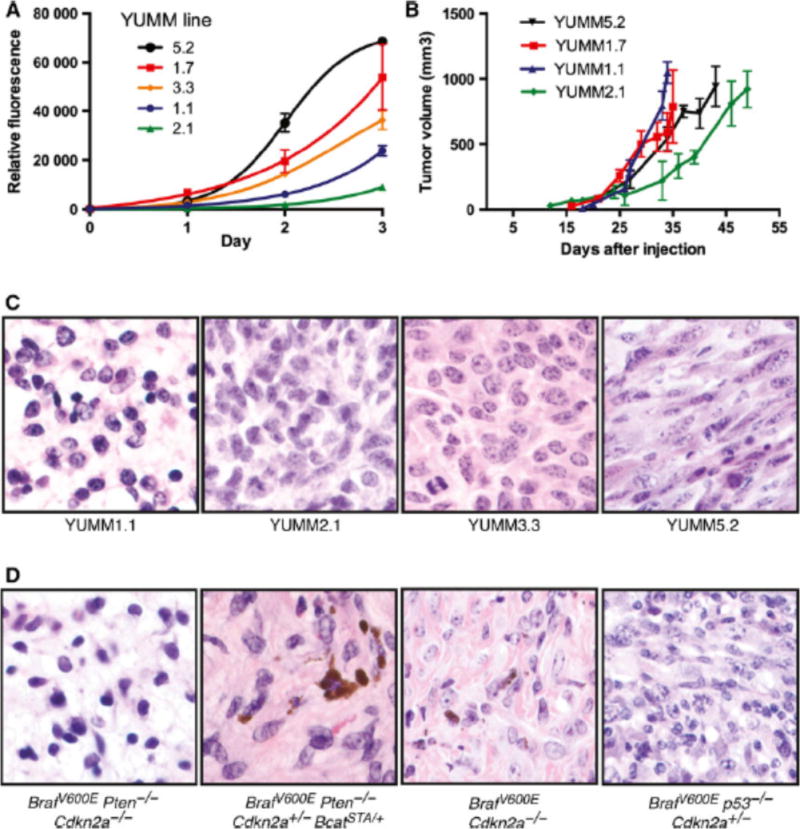
(A) In vitro growth curves over a three day window were determined by a CyQuant DNA-based assay. A range of proliferatiion rates of the YUMM lines is observed. In vivo tumor growth curves are show in (B) with the lines showing variable tumor growth rates. (C) and (D) are H& E comparisons of the YUMM lines (C) and the GEMM model (D) from which the cell lines were derived. All images are at 60× magnification.
In the evaluation of tumor formation by YUMM lines, bulky synchronous metastases were not identified, however the presence of micrometastases cannot be fully excluded. The metastatic potential of the lines will be further evaluated in future studies. The detection of micrometastases will be enhanced by the use of GFP/luciferase expressing YUMM derivatives. Also, as has been previously documented (Luo et al., 2014), surgical removal of the primary engrafted tumor will allow more time for the outgrowth of distant metastases.
BRAF and MEK inhibitors are important treatments in BRAF-mutant melanoma. In order to test the clinical applicability of the YUMM system, we evaluated the responses of Braf-driven YUMM lines to the BRAF inhibitor vemurafenib and closely related PLX4720 and found that Braf-driven YUMM melanoma cells are growth inhibited following Braf inhibition both in vitro and in vivo (Fig 3; Supp Fig. 1). The dose response curves of select YUMM lines is shown in Figure 3A. Most lines have a similar sensitivity to Braf inhibition, with an IC50 of about 1 μM, with the exception of YUMM5.2, which has a slightly higher IC50. YUMM1.1 5R, a YUMM line with acquired resistance to PLX4720, was generated by treating YUMM1.1 with 5 μM PLX4720 for 4 weeks. YUMM1.1 5R exhibited an increased IC50 of 7.86 μM Fig 3B). Analysis of MAPK pathway signaling shows that vemurafenib treatment decreases phosphorylation of ERK in the sensitive YUMM1.1 line, while ERK is phosphorylated in the resistant line at levels similar to untreated controls (Fig 3C). YUMM1.7 was injected into C57BL/6 mice and treated with PLX4720 chow diet one week later. Treatment with PLX4720 chow inhibited tumor growth until about day 50, after which tumor growth rapidly increased (Fig 3D). These findings demonstrate that the YUMM lines exhibit sensitivity to Braf inhibition followed by the emergence of resistance, mimicking clinical responses of human melanoma to BRAF inhibition.
Figure 3. Response to Braf inhibition.

YUMM cells with Braf driver mutations are able to respond to vemurafenib in vivo (A). Select YUMM cells were tested for their response and the corresponding IC50 curves were generated over a three day CyQuant DNA-based proliferation assay. (B) A resistant YUMM1.1 line was generated at 5 μM vemurafenib (YUMM1.1 5R) and the IC50 increased to 7.86 μM. (C) Analysis of the downstream signaling pathways by Western Blot analysis shows decreased p-ERK in sensitive YUMM lines and restoration of p-ERK signal in YUMM1.1 5R. YUMM1.7 was injected in C57BL/6 mice and half of the mice were treated with PLX4720 chow diet one week after injection of the YUMM cells and the non-treated mice were fed a control diet. The PLX4720 treated mice eventually develop resistant to PLX4720 around 45 days after the start of treatment.
A basic characterization of the effects of the immune system on grafted tumor growth was performed. To do this, YUMM1.7 was engrafted into wild type male C57Bl/6J and immunodeficient RAG1 C57Bl/6J mice and tumor growth characteristics were compared. No significant difference in tumor volume was observed 30 days after injection (Fig 4A). Further, all engrafted lines formed tumors in wild type mice, suggesting that an intact adaptive immune system does not reduce tumor growth in this model. The extent and characteristics of immune cell infiltration into grafted YUMM tumors was evaluated using immunohistochemistry (Fig. 4). Approximately 35–45% of total nucleated cells within the tumor were CD45+ leukocytes (Fig. 4). The majority of CD45+ cells appear to be F4/80+ tumor associated macrophages (Fig. 4). Less than 1% of the intratumoral leukocytes were CD3+ T-cells at the time point evaluated (Fig 4C). These findings suggest that leukocytes infiltrate YUMM tumors, but that the level of intratumoral T-cell infiltration is relatively low in established tumors arising from unmodified YUMM lines.
Figure 4. Immune characteristics of YUMM tumors.

(A) YUMM lines were injected into C57BL/6J mice with healthy immune systems and RAG mice without B and T cells. At day 30 after injection, no significant difference was found between the tumor volumes. (B) Select YUMM grafts were harvested at the tumor endpoint and a histological analysis was performed to determine the fraction of nucleated cells that were CD3 T cells, F4/80 macrophages, and CD45 white blood cells. (C) Representative images from the immunhistochemical stains are displayed (400×). Positive cells (brown) were counted based on the characteristic staining of the cells (surrounding the nuclei).
Discussion
GEMMs have been very useful for the evaluation of a variety of questions related to cancer biology. Strengths of this approach include: the ability to observe the phenotypic effects of specific genetic changes, development of cancers naturally within the physiologic microenvironment of their tissue of origin, and progression of neoplasia in the presence of an intact immune system. However, GEMMs are frequently characterized by variable and long tumor latency, which can reduce experimental tractability. Also, the number of somatic mutations that arise in GEMM tumors is very low, which is in contrast to most human cancers. In order to address some of these issues, we created a variety of congenic, melanoma GEMMs based on clinically relevant genetic changes in human melanoma. Using these models, we derived a comprehensive series of melanoma cell lines (YUMM) with defined genetic driver mutations. We anticipate that these YUMM lines will be useful for the evaluation of questions related to cancer biology, tumor immunology, and responses to cancer therapies.
While the murine and human immune systems are not identical, evaluation of immune responses in mouse models has provided insight into human tumor immunology. The potential of human immune therapies has recently been powerfully demonstrated in melanoma and other cancers. These therapies, including PD-1 pathway and/or CTLA-4 blockade, have been very successful, however in general, most patients do not fully respond for reasons that are not clear. These findings suggest that experimentally tractable cancer models in immune competent mice will be important to improving our understanding of tumor immune responses and the evaluation of strategies to improve responses.
Tumor cell lines derived from inbred or congenic mice have been utilized for the study of tumor immune responses. The lines are easy to use, reproducible, and experimental results can be readily attained. However, for many cancer types the number of available cell lines for study is limited, the genetic drivers in the cells are often unclear, and tumor growth characteristics are not ideal. These considerations limit the utility and predictive value of using these models in isolation. The series of YUMM lines presented here addresses most of these prior limitations. The availability of multiple lines allows for validation experiments, determination of the effects of different genetic drivers, as well as comparison with both the original GEMM models and human melanomas that share the same genetic changes. The low somatic mutation burden in nearly all mouse models of cancer may be a factor that limits tumor immune responses (Ward et al., 2016). A low mutation burden in YUMM lines may explain the similar rate of growth in the presence or absence of a functional adaptive immune system and the low number of intratumoral lymphocytes. Without further modification, the YUMM lines are suitable to model relatively non-immunogenic tumors. However with the expression of model tumor antigens or mutagenesis of the lines, it is likely that more robust tumor immune responses can be induced.
We anticipate that a variety of derivatives of the lines will be made, including use of CRISPR/Cas9 to evaluate the effects of additional genetic changes, expression of fluorescent proteins to increase the power of intravital imaging techniques, and expression of model antigens in order to more precisely track antigen specific immune responses. The YUMM lines have been utilized by numerous investigators prior to this initial description (Bertrand et al., 2015; Scortegagna et al., 2015; Ho et al., 2015; Obenauf et al., 2015; Cintolo et al., 2016; Kaur and Marchbank et al., 2016). The American Type Cell Collection (ATCC) has agreed to distribute 6 of the lines (indicated in Table 1).
Methods
Mice and alleles
The Braf/Pten GEMM and Braf/Pten/BcatSTA GEMM were previously described (Dankort et al., 2009, Damsky et al., 2011). Other alleles were previously described and published (Supplemental Table 1, Supplemental refs. 1–9). p53lox and Mc1re/e were purchased from The Jackson Laboratories (Bar Harbor, ME). The NRASQ61R and Lkb1lox were a gift from Ned Sharpless, (Departments of Medicine and Genetics, University of North Carolina). All alleles were backcross to C57BL/6J mice for at least 10 generations prior to interbreeding to re-create the models. Induction of melanoma for YUMM1, YUMM2 and YUMM6 were performed on 3–4 week old mice locally with 20 mM 4-hydroxytamoxifen (4-OHT) (Sigma). YUMM3, YUMM4, and YUMM5 were generated by inducing melanoma on pups on days 3 and 5 after birth with 130 mM 4-OHT. All animal research protocols were approved and followed according to the Yale Institutional Animal Care and Use Committee.
Derivation of cell lines
Cell lines were derived from mice with melanomas <1 cm3 in volume. Mice were euthanized and sprayed with 70% ethanol twice. The tumors were sterilely dissected with a scalpel and a 1 mm3 piece was removed from the center of the tumor. The dissected piece was washed in 70% ethanol for no more than 10 seconds and transferred sequentially into two PBS washes containing 2% Pen-strep. The small piece of tumor was minced finely with a scalpel blade and resuspended in DMEM:F12 media (Gibco) containing 10% FBS and transferred into a T25 flask. Flasks were monitored for growth of colonies. Once reaching near confluence in a T25 flask, all cells were then transferred into a T75 flask to expand and freeze down for further evaluation. A portion of each of the original tumors was submitted for formalin-fixation, paraffin-embedded sections, and confirmation of the diagnosis of melanoma based on morphological features and positive staining with the neural crest/melanoma markers Sox10 and S100.
Cell culture
Cells were derived and maintained in DMEM/F12 media containing 10% FBS and supplemented with 1% pen-strep and 1% non-essential amino acids. Several other medias have been tested with the lines, DMEM and RPMI medias have been used to culture the cells and normal growth rates were found for the cells for several of the YUMM lines tested. YUMM lines were passaged at ratios that ranged from 1:4 to 1:8.
Proliferation assays and IC50 determination
5,000 YUMM cells were seeded in triplicate in 96 well tissue culture plates. At the respective time points, a CyQuant assay (Molecular Probes, Thermo Fisher Scientific) based on DNA content was performed according to manufacturer’s instructions to monitor the growth of the cells. Briefly, the CyQuant solution was prepared immediately before adding to the cells. The media in the plate was removed and the 100 μ L of the CyQuant solution was distributed to the wells and allowed to incubate in the dark for 1 hour at 37C before reading the plate at excitation at 497 nm and emission at 520 nm. The values for each of the time points were averaged and compiled with statistical analysis using Graphpad Prism (Version 6.07 for Windows, GraphPad Software, La Jolla California USA, www.graphpad.com).
IC50s were determined by adding increasing doses of vemurafenib (Plexxikon, Berkeley, CA) and measuring cell number using CyQuant at 72 hours. The doses included 0.039 μM, 0.078 μM, 0.156 μM, 0.313 μM, 0.625 μM, 1.25 μM, 2.5 μM, 5 μM, 10 μM, including high and low DMSO controls. All samples were done in triplicate and all experiments were performed in triplicate.
Western Blot Analysis
Cells were harvested using standard methods and resuspended in RIPA Lysis and Extraction buffer (Pierce, Thermo Fisher Scientific) with Halt Protease and Phosphatase Inhibitors (Pierce, Thermo Fisher Scientific). Supernatants were collected after spinning down the cell pellets. Protein quantitation was determined using a Bradford assay (Bio-Rad) with known standards. 12 μ g of protein was loaded on to 4–12% Biorad gels and run at 100 V to 150 V. Transfers were done with PVDF membranes for 1.5 hours at 4 C. GAPDH (CST2118, 14C10), p44/42 MAPK (ERK1/2) (CST4695, 137F5), and Phospho-p44/42 MAPK (ERK1/2) (CST9101, 197G2) were used according to manufacturer’s (Cell Signaling Technology) instructions.
Grafts
YUMM cells were approximately 65–85% confluent on the day of injection. Cells were trypsinized with 0.25% trypsin for approximately 2–3 minutes before deactivated with media containing 10% serum. Cells were washed twice with sterile 1× PBS and counted with an Invitrogen Countess or with a hemocytometer. Four to five week old C57BL/6J mice were purchased from Jackson Laboratory (Bar Harbor, ME) and allowed to acclimate in the facility one week prior to injection. 100,000 cells in 100 μ L of sterile PBS were injected subcutaneously into a shaved rear flank using a 27G needle. Injections took place less than 30 minutes after preparation of the cells. Chow diet containing no drug or 470 mg/kg PLX4720 (Plexxikon, Berkeley, CA and Research Diets, New Brunswick, NJ) was given to mice with palpable tumors.
Mice were monitored for the appearance of tumor after injection to begin digital caliper measurements. Three dimensions were taken for calculation of tumor volume, use 0.5233*l*w*h. Kaplan Meier analysis and T tests statistical analysis were performed using GraphPad Prism (Version 6.0a for Mac OS X, GraphPad Software, La Jolla California USA, www.graphpad.com”). All animal experiments protocols were followed according to the Yale Office of Animal Research Support Committee guidelines.
Histological analysis
Tumors were processed for histological analysis by acquiring unstained sections of each of the YUMMs and performing immunohistochemistry using CD45 (Biolegend 103102, 30-F11), F4/80 (Abcam 6640, CI:A3-1), and CD3 (AbD Serotec MC1477, CD3-12). Representative fields were taken of the tumor samples. The positive cells (brown) were counted and compared to the total nucleated cells in the field. Five fields were taken per tumor section and accounted for in the average.
Supplementary Material
Significance.
Mouse models are of great value in the study of melanoma and the dynamic immune microenvironment within which it arises. For decades, B16 has been an attractive mouse melanoma model because of its pigmentation, rapid growth in C57BL/6 mice and metastatic potential. However, findings from B16 may lack generalizability because the model does not share the same genetic alterations found in human melanoma. Here, we present a series of cell lines derived from mouse models genetically engineered to carry human-relevant mutations. We anticipate that this series of cell lines will serve the scientific community in elucidating novel features of cancer biology and identifying new therapeutics.
Acknowledgments
We are grateful to Ned Sharpless, Departments of Medicine and Genetics at the University of North Carolina, for his generous gift of the NRAS mice. We would additionally like to thank Antoni Ribas, Jesse Zaretsky, and Siwen Hu-Lieskovan, Department of Medicine at University of California, Los Angeles, for insightful conversations. Most of all, we thank the researchers around the world that use these melanoma lines for their research and have given us feedback on their use.
References
- Bertrand F, Rochotte J, Colacios C, Montfort A, Tilkin-Mariame AF, Touriol C, Rochaix P, Lajoie-Mazenc I, Andrieu-Abadie N, Levade T, et al. Blocking Tumor Necrosis Factor alpha Enhances CD8 T-cell-Dependent Immunity in Experimental Melanoma. Cancer Res. 2015;75:2619–28. doi: 10.1158/0008-5472.CAN-14-2524. [DOI] [PubMed] [Google Scholar]
- Cintolo JA, Datta J, Xu S, Gupta M, Somasundaram R, Czerniecki BJ. Type I-polarized BRAF-pulsed dendritic cells induce antigen-specific CD8+ T cells that impact BRAF-mutant murine melanoma. Melanoma Res. 2016;26:1–11. doi: 10.1097/CMR.0000000000000203. [DOI] [PubMed] [Google Scholar]
- Cloudman AM. The Effect of an Extra-Chromo-Somal Influence Upon Transplanted Spontaneous Tumors in Mice. Science. 1941;93:380–1. doi: 10.1126/science.93.2416.380. [DOI] [PubMed] [Google Scholar]
- Damsky WE, Curley DP, Santhanakrishnan M, Rosenbaum LE, Platt JT, Gould Rothberg BE, Taketo MM, Dankort D, Rimm DL, Mcmahon M, et al. beta-catenin signaling controls metastasis in Braf-activated Pten-deficient melanomas. Cancer Cell. 2011;20:741–54. doi: 10.1016/j.ccr.2011.10.030. [DOI] [PMC free article] [PubMed] [Google Scholar]
- Dankort D, Curley DP, Cartlidge RA, Nelson B, Karnezis AN, Damsky WE, Jr, You MJ, Depinho RA, Mcmahon M, Bosenberg M. Braf(V600E) cooperates with Pten loss to induce metastatic melanoma. Nat Genet. 2009;41:544–52. doi: 10.1038/ng.356. [DOI] [PMC free article] [PubMed] [Google Scholar]
- Gubin MM, Zhang X, Schuster H, Caron E, Ward JP, Noguchi T, Ivanova Y, Hundal J, Arthur CD, Krebber WJ, et al. Checkpoint blockade cancer immunotherapy targets tumour-specific mutant antigens. Nature. 2014;515:577–581. doi: 10.1038/nature13988. [DOI] [PMC free article] [PubMed] [Google Scholar]
- Harding HE, Passey RD. A Transplantable Melanoma of the Mouse. The Journal of Pathology and Bacteriology. 1930;33:417–427. [Google Scholar]
- Ho P-C, Bihuniak JD, Macintyre AN, Staron M, Liu X, Amezquita R, Tsui YC, et al. Phosphoenolpyruvate Is a Metabolic Checkpoint of Anti-tumor T Cell Responses. Cell. 2015;162:1217–1228. doi: 10.1016/j.cell.2015.08.012. [DOI] [PMC free article] [PubMed] [Google Scholar]
- Jenkins MH, Croteau W, Mullins DW, Brinckerhoff CE. The BRAF(V600E) inhibitor, PLX4032, increases type I collagen synthesis in melanoma cells. Matrix Biol. 2015;48:66–77. doi: 10.1016/j.matbio.2015.05.007. [DOI] [PMC free article] [PubMed] [Google Scholar]
- Jenkins MH, Steinberg SM, Alexander MP, Fisher JL, Ernstoff MS, Turk MJ, Mullins DW, Brinckerhoff CE. Multiple murine BRaf(V600E) melanoma cell lines with sensitivity to PLX4032. Pigment Cell Melanoma Res. 2014;27:495–501. doi: 10.1111/pcmr.12220. [DOI] [PMC free article] [PubMed] [Google Scholar]
- Kaur A, Webster MR, Marchbank K, Behera R, Ndoye A, Kugel CH, Dang VM, Appleton J, O’Connell MP, Cheng P, et al. sFRP2 in the aged microenvironment drives melanoma metastasis and therapy resistance. Nature. 2016;532:250–254. doi: 10.1038/nature17392. [DOI] [PMC free article] [PubMed] [Google Scholar] [Retracted]
- Liu M, Sakamaki T, Casimiro MC, Willmarth NE, Quong AA, Ju X, Ojeifo J, Jiao X, Yeow WS, Katiyar S, et al. The Canonical NF-κB Pathway Governs Mammary Tumorigenesis in Transgenic Mice and Tumor Stem Cell Expansion. Cancer Res. 2010;70:10464–10473. doi: 10.1158/0008-5472.CAN-10-0732. [DOI] [PMC free article] [PubMed] [Google Scholar]
- Longley D, Johnston P. Molecular mechanisms of drug resistance. J Pathol. 2005;205:275–292. doi: 10.1002/path.1706. [DOI] [PubMed] [Google Scholar]
- Nogueira C, Kim KH, Sung H, Paraiso KH, Dannenberg JH, Bosenberg M, Chin L, Kim M. Cooperative interactions of PTEN deficiency and RAS activation in melanoma metastasis. Oncogene. 2010;29:6222–32. doi: 10.1038/onc.2010.349. [DOI] [PMC free article] [PubMed] [Google Scholar]
- Obenauf AC, Zou Y, Ji AL, Vanharanta S, Shu W, Shi H, Kong X, Bosenberg MC, Wiesner T, Rosen N, et al. Therapy-induced tumour secretomes promote resistance and tumour progression. Nature. 2015;520:368–72. doi: 10.1038/nature14336. [DOI] [PMC free article] [PubMed] [Google Scholar]
- Salas Fragomeni RA, Chung HW, Landesman Y, Senapedis W, Saint-Martin JR, Tsao H, Flaherty KT, Shacham S, Kauffman M, Cusack JC. CRM1 and BRAF inhibition synergize and induce tumor regression in BRAF-mutant melanoma. Mol Cancer Ther. 2013;12:1171–9. doi: 10.1158/1535-7163.MCT-12-1171. [DOI] [PubMed] [Google Scholar]
- Scortegagna M, Lau E, Zhang T, Feng Y, Sereduk C, Yin H, De SK, Meeth K, Platt JT, Langdon CG, et al. PDK1 and SGK3 Contribute to the Growth of BRAF-Mutant Melanomas and Are Potential Therapeutic Targets. Cancer Res. 2015;75:1399–412. doi: 10.1158/0008-5472.CAN-14-2785. [DOI] [PMC free article] [PubMed] [Google Scholar]
- Semenza GL. Cancer–stromal cell interactions mediated by hypoxia-inducible factors promote angiogenesis, lymphangiogenesis, and metastasis. Oncogene. 2013;32:4057–4063. doi: 10.1038/onc.2012.578. [DOI] [PMC free article] [PubMed] [Google Scholar]
- Takizawa H, Sato S, Kitajima H, Konishi S, Iwata K, Hayashi Y. Mouse skin melanoma induced in two stage chemical carcinogenesis with 7,12-dimethylbenz[a]anthracene and croton oil. Carcinogenesis. 1985;6:921–3. doi: 10.1093/carcin/6.6.921. [DOI] [PubMed] [Google Scholar]
- Ward JP, Gubin MM, Schreiber RD. The Role of Neoantigens in Naturally Occurring and Therapeutically Induced Immune Responses to Cancer. Adv Immunol. 2016;130:25–74. doi: 10.1016/bs.ai.2016.01.001. [DOI] [PMC free article] [PubMed] [Google Scholar]
Associated Data
This section collects any data citations, data availability statements, or supplementary materials included in this article.