Abstract
Blood velocity measurements are important in physiological science and clinical diagnosis. Doppler ultrasound is the most commonly used method but can only measure one velocity component. Ultrasound imaging velocimetry (UIV) is a promising technique capable of measuring two velocity components; however, there is a limit on the maximum velocity that can be measured with conventional hardware which results from the way images are acquired by sweeping the ultrasound beam across the field of view. Interleaved UIV is an extension of UIV in which two image frames are acquired concurrently, allowing the effective interframe separation time to be reduced and therefore increasing the maximum velocity that can be measured. The sweeping of the ultrasound beam across the image results in a systematic error which must be corrected: in this work, we derived and implemented a new velocity correction method which accounts for acceleration of the scatterers. We then, for the first time, assessed the performance of interleaved UIV for measuring pulsatile arterial velocities by measuring flows in phantoms and in vivo and comparing the results with spectral Doppler ultrasound and transit-time flow probe data. The velocity and flow rate in the phantom agreed within 5–10% of peak velocity, and 2–9% of peak flow, respectively, and in vivo the velocity difference was 9% of peak velocity. The maximum velocity measured was 1.8 m s−1, the highest velocity reported with UIV. This will allow flows in diseased arteries to be investigated and so has the potential to increase diagnostic accuracy and enable new vascular research.
Keywords: ultrasound, blood flow, atherosclerosis, haemodynamics, particle image velocimetry, echo-PIV
1. Introduction
Arterial blood velocity measurements are used as a diagnostic tool in diseases, including atherosclerosis, coarctation and dissection [1–3]. Velocity measurements in the heart provide information about valve areas and regurgitation, cardiac shunts and ventricular dysfunction [4–6]. Measurements of blood velocity are also an important tool in cardiovascular science and are used extensively in animal models of disease and development [7]. In addition, blood velocity measurements are useful in the development of medical devices such as artificial valves, stents and heart pumps [8].
Doppler ultrasound is currently the chief clinical method for measuring blood velocity [9]. However, an inherent limitation of the standard Doppler method is that only the velocity component parallel to the ultrasound beam is measured. If the angle between the direction of blood flow and the ultrasound beam is known, then it is simple to convert the velocity component to velocity magnitude. In vascular ultrasound, the blood is often assumed to flow parallel to the wall of the vessel. However, this is not always the case, and there are many situations where the blood direction is unknown, particularly in areas of non-cylindrical geometry or disease. Inaccurate angle and sample volume placement causes velocity errors up to 28% [10]. Even when angle corrections can be performed, Doppler methods suffer from several sources of error [11]. As an example of the impact these errors have in the clinic, consider diagnosis of 70% carotid stenosis. Using the peak systolic velocity measured by Doppler 7% of stenoses are undiagnosed leaving patients at risk of transitory ischaemic attack or stroke, whereas 7% of the more than 5000 patients in the UK [12] undergoing carotid endarterectomies each year may be having unnecessary surgery [13].
Many methods have been proposed to overcome these limitations (reviewed by Taylor & Draney [14] and Evans [15,16]). The most notable are vector Doppler and speckle tracking [17,18]. Since 2000, a technique known as ultrasound imaging velocimetry (UIV) or echo-particle image velocimetry (echo-PIV) by analogy with the popular optical technique, has been under development [19]. In this method, regions of two successive B-mode images of a fluid containing scatterers are cross-correlated to calculate two-dimensional velocity vectors [20–22]. Hence, the method produces instantaneous, two-dimensional velocity vector fields. UIV has been used to study flow in straight [23,24] and curved tubes [25], vessel phantoms [26] and vortex phantoms [27], and for preliminary in vivo investigations in healthy arteries [26,28–30] and the heart [28,31].
In optical PIV, images are acquired as snapshot pairs through the use of specialized cameras and the interframe time, Δt, can be freely chosen. In contrast, the B-mode ultrasound images used in UIV are formed by reading out data from groups of transducer elements, to produce image lines sequentially, and Δt is the same as the acquisition frame rate of the system. So, in UIV, Δt is determined by the speed of sound, depth and the number of lines in the image [25].
Zhou et al. [32] showed how the motion of the scatterers and the sweeping of the ultrasound beam across the frame interact to produce potentially large errors in the velocity measurements. Zhou et al. [32] also showed how to correct for beam sweeping, so that errors of just a few per cent are achieved.
Despite this advance, a problem still occurs when the velocity of the scatterers approaches that of the beam sweep. This upper limit on the measureable velocity is well known [26,33], with authors reporting velocity measurements up to around 70 cm s−1 [30]. Restricting the field of view [34], or skipping lines [35], can increase the frame rate but at the expense of reduced image width or detail. Leow et al. [36] used plane wave imaging, in which the whole image frame is captured simultaneously, to achieve frame rates of 1000 Hz and measured velocities up to 80 cm s−1. Other examples of the use of high frame rates achieved with plane wave imaging are: UIV of the common carotid [37]; vector Doppler of healthy and diseased carotid arteries [38]; and transverse oscillation of carotid and brachial arteries [39]. However, the hardware used for plane wave imaging is specialist and not widely available.
Poelma & Fraser [40] showed how interleaving images can increase the dynamic range up to at least 140 cm s−1 while maintaining the full image. The technique works by halving the beam sweep speed, so that there is time in between each line of the first image to produce a line of the second image. The moment when the second frame is started can be freely chosen, thus re-introducing control of the critical interframe time Δt. The acquisition rate for each image pair is the same as for two images in a conventional sequence; however, the time needed for one image is doubled. Correcting the velocities as described by Zhou et al. [32] is therefore crucial, but provided this is done measurement of substantially higher velocities is achievable.
To date, the interleaved method has not been tested on pulsatile flows, which have periods of accelerating and decelerating flow. As discussed by Zhou et al. [32], their velocity correction for the ultrasound beam sweep does not account for accelerating ultrasound scatterers. The aims of this work were then to devise and implement a new UIV velocity correction method for accelerating flows, and to compare velocity measurements and derived volumetric flow rates, made using our interleaved UIV method, with Doppler ultrasound velocity and transit-time flow rate measurements. The flows were chosen to be representative of those found in arteries during health and disease. The influence of Δt was investigated, and shown to be particularly important during the deceleration phase. The optimum Δt was used when subsequently employing the method to measure aortic blood velocity in the rabbit.
2. Methods
2.1. In vitro experiments
The experimental facility was similar to that used in earlier studies (see [32]), but adapted to produce pulsatile flow. A 5 mm internal diameter latex tube (098 XA/XB, Primeline Industries, Denver, CO) was held straight in a tank of water with an acoustic absorber below. The working fluid was either water or 35% w/w glycerol in water. The fluid was seeded with SonoVue® contrast medium (Bracco UK Ltd), which consists of 1–7 µm encapsulated microbubbles of SF6 gas.
Pulsatile flow was produced by a positive displacement pump (Harvard Instruments Pulsatile Blood Pump for Rabbits, model 1405). The pump was set to a frequency of either 60 or 200 beats per minute (bpm) (to mimic either human or rabbit heart rates), and the stroke volume was adjusted to give a maximum velocity of either 1.1, 1.6 or 1.8 m s−1. The flow waveforms were intended to be typical of the types of flows found in arteries, rather than matching any specific artery. The instantaneous flow rate was measured using a transit-time ultrasound flow probe (Transonic TS420) connected to a laptop running NOTOCORD-hem software (Notocord, France) which was used to perform an ensemble average of 10 cycles, aligned by the ‘foot’ of the waveform. The mean flow rate was also obtained, using a stopwatch and measuring cylinder.
An Ultrasonix RP500 (Ultrasonix Medical Corporation, Canada), with a linear 128 element, 38 mm long 5–14 MHz transducer (LP14-5/38) was used to obtain radio frequency data. The Sonix software was used for positioning the transducer, which was placed at the downstream end of the tube, allowing an entrance length of 50 cm (100 diameters). The entrance length for pulsatile flow can be estimated as L/D = 0.049Reta, where Reta is the Reynolds number based on the time averaged cross-sectional mean velocity [41]. This entrance length therefore resulted in fully developed flow for Reta < 1020, which was true for all water–glycerol experiments. For UIV data acquisition, the transducer was clamped perpendicular to the tube so as to produce an image of a longitudinal section through the mid-plane.
Following the UIV data acquisition, the position of the probe was adjusted such that an image of the same section of the tube was obtained, but with the ultrasound beam at an angle of between 54° and 60° to the tube wall. The Sonix software was again used for positioning the transducer, and to set all of the Doppler ultrasound parameters: a 1 mm Doppler sample volume was positioned in the middle of the tube; the frequency was 6.6 MHz; the wall filter was between 133 and 250 Hz; and the beam was focused on the sample volume so had a depth of between 1.7 and 2.5 cm. The pulse repetition frequency (between 6.7 and 12.5 kHz) was adjusted to give the maximum velocity resolution without aliasing. Radiofrequency data were recorded and post-processed using Matlab to give the Doppler spectrum and an ensemble average of 10 cycles was produced. Experiment parameters are given in table 1.
Table 1.
Flow-related parameters for the in vitro experiments. The viscosity, μ, and density, ρ, of 35% w/w glycerol in water were assumed to be 0.003 Pa s and 1088 kg m−3 [42]. The frequency given is the frequency set by the pump. Vmax and Vmin are the maximum and minimum velocities measured from the Doppler spectrum. Qmax and Qta are the maximum and cycle averaged flow rates measured by the transit time flow probe. Reta is the cycle averaged Reynolds number:  where D and A are the diameter and cross-sectional area of the pipe.
| flow | fluid | frequency (bpm) | Vmax (m s−1) | Vmin (m s−1) | Qmax (m min−1) | Qta (ml min−1) | Reta |
|---|---|---|---|---|---|---|---|
| a | water–glycerol | 60 | 1.1 | −0.2 | 1331 | 385 | 500 |
| b | water–glycerol | 200 | 1.1 | −0.2 | 1240 | 365 | 480 |
| c | water–glycerol | 200 | 1.8 | −0.3 | 2460 | 750 | 990 |
| d | water | 60 | 1.1 | −0.2 | 1445 | 500 | 2120 |
| e | water | 60 | 1.6 | −0.4 | 2279 | 635 | 2695 |
2.2. In vivo experiment
A male New Zealand White rabbit (Harlan Laboratories, UK) was kept in a pen in a rabbit-only room to acclimatize for two weeks under normal diet (including plain alfalfa pellets, hay and carrots). At 2.5 months old (2.33 kg), the rabbit was brought into the procedure room and wrapped in a towel for comfort. Hypnorm (0.3 ml kg−1) was injected in the calf muscle. The left ear was shaved, and marginal ear vein was cannulated using a 23G butterfly needle connected to a three-way tap with Sonovue (25 mg in 5 ml sodium chloride 0.9%) and sterile saline solution. Throughout anaesthesia (1 h), the body temperature was maintained at 37°C by a warming plate. A pulse oximeter was connected to the tail for blood oxygenation and heart rate monitoring. The fur around the abdominal region was shaved, and the rabbit was placed on its back for access to the aorta. Ultrasound gel was applied to produce an acoustic window on the abdomen. 20 min following Hypnorm injection a syringe pump was used to provide a continuous infusion of Sonovue at a rate of 2 ml min−1 for 2 min. Images of the rabbit's abdominal aorta in longitudinal section were acquired using the Ultrasonix system as above. Based on the in vitro results, the UIV data were acquired with Δt = 31τ (τ is the time taken to produce a single line of the image, see §2.3). A Doppler spectrum was then recorded at the same location on the artery. Upon completion of data acquisition, the rabbit was coming out of anaesthesia. It was given 10 ml sterile saline solution subcutaneously and kept in a box until able to walk. Body weight, food and water intake, and general condition were monitored the next day and found normal.
2.3. Interleaved ultrasound imaging velocimetry data acquisition and processing
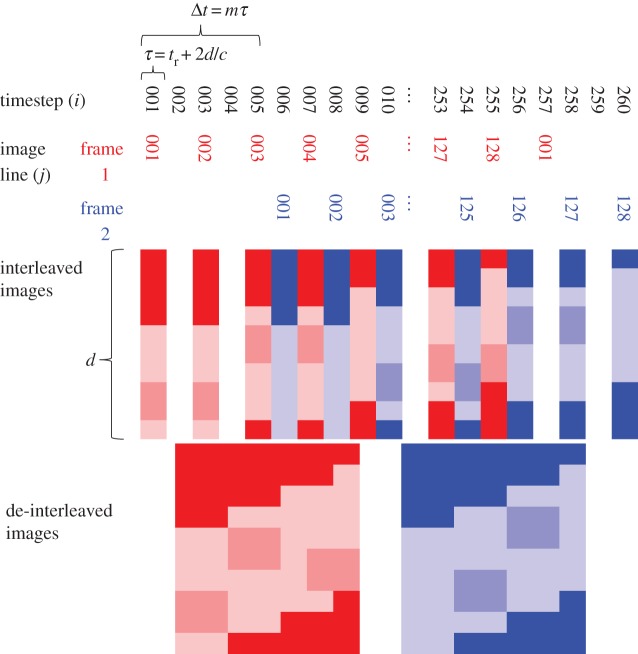
The interleaved imaging technique is outlined here; see Poelma & Fraser [40] for a more detailed explanation. In conventional B-mode imaging, the transducer elements are read out simultaneously, but so as to produce the image lines sequentially. So the image is produced starting from one side of the transducer and progressing line by line until the full image has been created. The time taken to produce each line, τ, is governed by the transducer response time (time interval between finishing receiving signals from one pulse and starting the next), tr, the image depth, d, and the speed of sound, c:
| 2.1 |
The transducer response time was 23.5 µs [32]. The time taken to produce the whole image is Jτ, where J is the total number of elements, and therefore lines in the image, which is 128 for our transducer. After sweeping across the elements to form this image, the second image is formed in the same way. The time difference between scanning a single line in the first image and the same line in the second image is the interframe time, Δt = Jτ. In interleaved imaging (figure 1), the first image is recorded using only the odd timesteps (i = 1, 3…) so line j is recorded at timestep i = 2j − 1. The even timesteps (i = 2, 4…) are used to record the second image frame of the pair. The start time for recording the second image can be any one of the even timesteps; in figure 1, for example, it is timestep 6. The time difference between scanning the same line in the two successive frames is then Δt = mτ, where m is the number of timesteps between the start of the acquisition of the two frames—m = 5 in the example.
Figure 1.
Schematic of the element scan sequence for interleaved imaging and the resulting image pair. The time taken to scan a single line, τ, is a function of the scanner (transducer response tr), the speed of sound c and the image depth d. The interframe time can be any odd multiple, m, of τ. The value m = 5 is shown here. (Online version in colour.)
Using interleaved imaging, the time taken to record a single image is double that of conventional imaging, T = 2 Jτ. In our current implementation, it is longer than double, because some of the timesteps at the beginning and end of recording the pair are empty (figure 1). However, the sequence could be arranged so that the next image pair begins in the empty timesteps at the end of the current pair, to eliminate any wasted time. The interframe time is significantly reduced, compared with conventional imaging, and is variable Δt = mτ. The theoretical lower limit of Δt is τ, which would require an image line to be recorded twice before moving to the next line.
To implement interleaved imaging, the Ultrasonix RP500 was programmed using a Matlab interface to the Texo software development toolkit. This Matlab interface was developed by Dr Jean Martial Mari (University of French Polynesia) and details are at www.ultrasonix.com/wikisonix.
Images of pulsatile flow were acquired with depths of 2 cm and 6 cm. Values of Δt were between 7τ and 63τ, corresponding to 0.35–3.1 ms (2 cm) or 0.71–6.4 ms (6 cm). A conventional imaging sequence was also used for comparison, and for that Δt was 128τ, corresponding to 6.3 ms (2 cm) or 13.0 ms (6 cm). The direction of the beam sweep was chosen to be opposite to that of the mean flow (see below). Data were acquired for 25 s, giving between 64 and 165 image pairs depending on depth and Δt. The 25 s data acquisition time gave 25 pulse cycles for the 60 bpm flow and 80 pulse cycles for the 200 bpm flow.
Data were processed using a multi-pass PIV algorithm that uses image deformation and correlation averaging [43]. The analysis started with interrogation areas (IAs) of 32 × 64 pixels and decreased to 4 × 8 pixels with 50% overlap for the final iterations. This corresponded to a spatial resolution of 0.59 × 0.08 mm2 in the x- and y-directions, respectively. Because the flow was in the x-direction, the IAs were larger in this direction, and smaller in the y-direction in which there were velocity gradients.
As the flow in this work was time-dependent, a new procedure was developed to ensemble average the correlation at each phase. To correctly bin the data for the correlation averaging, the PIV algorithm consisted of two stages. In the first stage a single PIV iteration was used to produce a rough estimate for the velocity magnitude in the region of interest. This signal was then used to align each of the cycles by using a cross correlation to determine the phase shift. This phase shift was then used to align the raw data before the second, multi-iteration PIV algorithm was applied. The temporal resolution was 50/pulse cycle, which gave 50 or 166 Hz for the 60 and 200 bpm pulse rates, respectively.
The new velocity correction method was derived as follows. Following the analysis by Zhou et al. [32], the position in the x-direction of a scatterer in an unsteady flow at the time it is detected by the sweeping ultrasound beam can be equated with the corresponding position of the beam (figure 2):
| 2.2 |
where x, Vx and ax are the x-components of the position, velocity and acceleration of the scatterer at the beginning of the image frame acquisition, and x′ is the position in the image which is also the position of the beam. If the ultrasound beam sweep velocity is Vs, the time at which the scatterer and beam meet is t = x′/Vs:
| 2.3 |
Differentiation with respect to t then gives
 |
2.4 |
Figure 2.
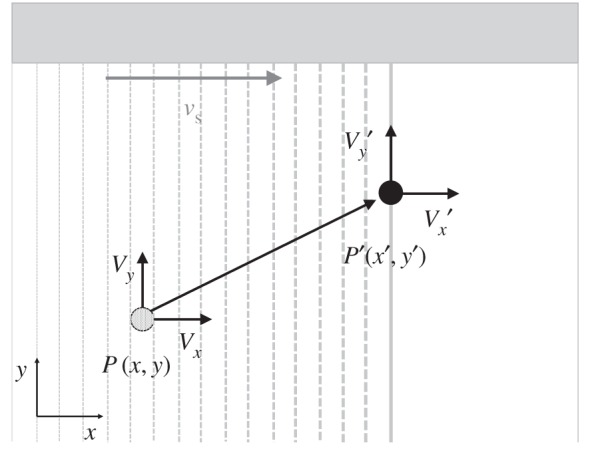
Schematic of the motion of a single scatterer during the formation of an ultrasound image. The ultrasound beam is swept from left to right. The true spatial position of the scatterer at the start of forming the image is P(x,y), where x and y are the spatial coordinates. The position of the scatterer in the image, P′(x′,y′), is the position where the moving scatterer meets the sweeping ultrasound beam. Vx and Vy are the true velocity components of the scatterer.  and
and  are the velocity components of the scatterer estimated directly from the PIV algorithm. Vs is the sweep speed of the ultrasound beam.
The velocity measurements are made over a finite time period, so at the time n the real velocity in the x-direction can be written Vxn, the real acceleration axn and the measured velocity V′xn
| 2.5 |
Then, because the velocity measurements are made over time we can introduce approximations for axn and daxn/dt as functions of Vx. For example, second-order central difference approximations are
| 2.6 |
| 2.7 |
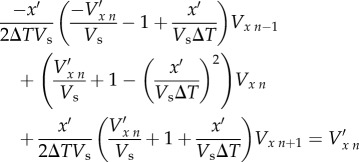
where Vxn − 1 and Vxn + 1 are the real velocities at timesteps n − 1 and n + 1, respectively, and ΔT is the time between successive image pairs (this is not the same as Δt, the time between image frames within the same pair). Making this substitution leads to a set of N simultaneous equations of the form
 |
2.8 |
which relate the real velocity Vx to the velocity  found from processing the images using the PIV algorithm. We used fourth-order approximations for axn and daxn/dt to achieve smoother results, but the method is the same as for the second-order approximations shown above. Because we are assuming that the flow is periodic—this assumption underlies the use of ensemble averaging—there are a total of N unknowns, so the system of equations can be solved. This was done using matrix left division (‘\’) in Matlab. The y-component of velocity Vy was found in the same way, and so the calculation of Vy depends on
  .
.
In steady flow, equation (2.4) simplifies and the equation for the x-velocity correction resulting from the beam sweep is
| 2.9 |
To assess the error associated with the acceleration part of the beam sweep correction, the velocity found using equation (2.9) was compared with that from equation (2.8).
Rearranging the velocity correction equation for Vx, equation (2.9), gives an equation for the observed velocity Vx′, dependent on the real velocity of the scatterer and the beam sweep
| 2.10 |
It is clear that as scatterer velocities approach the beam sweep velocity,  becomes infinite. That is, the displacement of the scatterers between the images is larger than the size of the interrogation area, even for the largest possible areas, because the sweeping beam cannot ‘catch up’ with the moving scatterers. This is true even for interleaved imaging. However, if the direction of the beam sweep is opposite to that of the scatterers, there is theoretically no maximum V′x; the denominator in (2.10) simply gets bigger. This is why the direction of the beam sweep was chosen to be opposite to that of the mean flow.
3. Results
All data and code are available for download from the University of Bath Research Data Archive [44].
3.1. In vitro experiments
3.1.1. Baseline flow condition
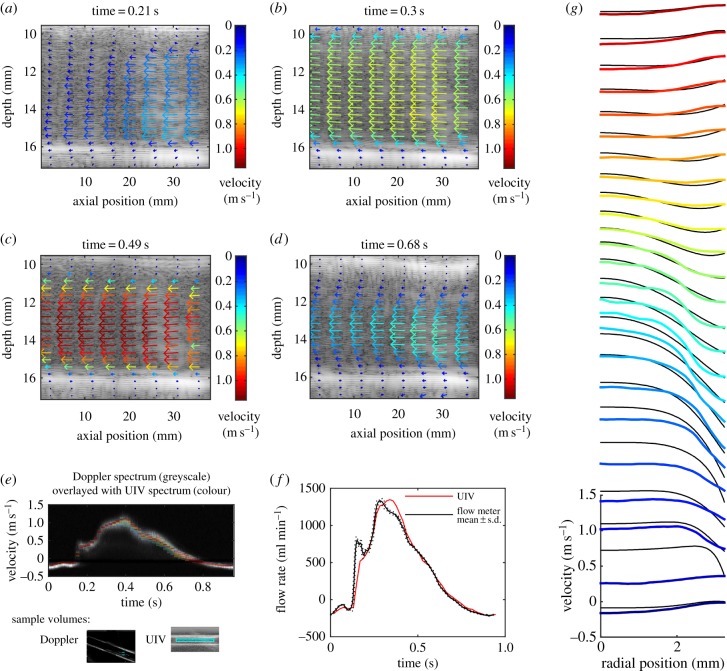
Figure 3 shows results for the straight tube containing glycerol–water, with a pulsatile frequency of 60 bpm and peak velocity around 1.1 m s−1 (flow ‘a’, parameters typical of healthy arterial flow in the human). The image depth was 2 cm and Δt = 31τ. The velocity vector plots show that the velocity can be measured across the whole width of the transducer. The resolution of the vector plots is higher than illustrated; for clarity, only every eighth vector in the x-direction and every fourth vector in the y-direction are shown.
Figure 3.
Straight tube phantom results for flow of glycerol–water at a pulse rate of 60 bpm and maximum velocity around 1.1 m s−1 (flow ‘a’ in table 1). The interleaved method was used with Δt = 31τ and image depth of 2 cm. (a–d) Velocity vector plots at selected phases of the pulse cycle. The region has been cropped in the depth direction to focus on the tube, but the entire 38 mm width of the image is shown. For clarity, only every eighth vector in the x-direction and every fourth vector in the y direction are plotted. (e) Comparison of the measured velocities with those measured by Doppler ultrasound. The standard greyscale colour map is used for the Doppler spectrum with the brightness correlated to the intensity of the Doppler signal. A rainbow colour map is used for the UIV spectrum with red representing the largest number of UIV vectors, blue representing the lowest numbers of vectors, and velocities for which there were no vectors have no colour. The sample volumes for each method are also shown. (f) Comparison of the measured flow rate with that measured using a transit-time flow meter. Flow meter results are mean ± s.d. (g) Velocity profiles at every second phase throughout the pulse cycle, obtained by averaging the velocity along the tube. Colours indicate the phase starting from blue at t = 0. Black lines are the Womersley profiles.
Figure 3e shows a comparison of the velocity in the centre of the tube with the Doppler spectrum obtained at the same positon. The Doppler spectrum shown is the ensemble average of 50 individual pulse cycles. The sample volume for the UIV (also shown in figure 3e) encompassed the width of the image, but had the same height as the Doppler sample volume. Although the temporal resolution of the Doppler measurements is much higher than the UIV ones, there is still excellent agreement between the magnitudes of the two velocity waves. To assess the difference, the maximum of the Doppler spectrum was calculated throughout the cycle, and the mean of the absolute difference between this and the average UIV was found. The difference was 7.9 cm s−1 or 7.5% of the peak velocity (table 2). The maximum of the Doppler spectrum was used because it is less sensitive to location than the mean, and provided the Doppler angle is less than 60°, the error is less than 30% [45].
Table 2.
Differences between UIV measurements and validation measurements. Table shows the data for the optimum Δt. For each method the mean absolute difference between the UIV measurement and the validation measurement is given, as well as the value as a percentage of the maximum over the pulse cycle. For the Doppler comparison, the average UIV value in the sample volume was compared with the maximum in the Doppler spectrum.
| flow | Δt τ | maximum Doppler velocity |
transit time flow rate |
||
|---|---|---|---|---|---|
| m s−1 | % | ml min−1 | % | ||
| a | 31 | 0.079 | 7.5 | 60 | 4.4 |
| b | 31 | 0.078 | 9.0 | 80 | 6.2 |
| c | 7 | 0.18 | 10 | 166 | 8.7 |
| d | 15 | data corrupted | 33 | 2.2 | |
| e | 7 | 0.086 | 5.4 | 127 | 5.9 |
The flow waveform was estimated from the UIV (figure 3f). The inner walls of the tube were detected automatically and used to predict the centre of the tube. The radial position of each velocity vector was then found, and the velocity was integrated cylindrically to find the flow rate. A comparison between this flow rate and the flow rate measured using the transit time flow meter (figure 3f) shows a very good agreement through the majority of the pulse cycle (mean absolute difference is 60 ml min−1 or 4.4% of peak flow, table 2). However, owing to the temporal resolution of the UIV, the first peak is not captured. This error could potentially be resolved by acquiring data for longer, and then using more phase bins for the correlation average in the PIV algorithm; however, for in vivo measurements, temporal flow variations limit the desirable acquisition time. There is also a difference in the shape of the main peak.
3.1.2. Influence of interframe time Δt
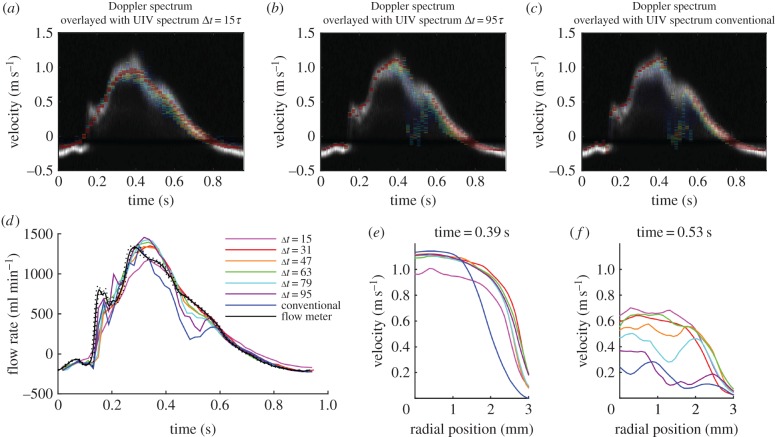
Reducing Δt to Δt = 15τ had the effect of smoothing out the velocity waveform, with the result that small peaks, such as the one occurring at 0.16 s, were not detected, and the main peak was reduced (figure 4a). The mean absolute difference compared with Doppler was 11 cm s−1 and compared with transit time flow rate was 84 ml min−1. This happens, because when Δt is smaller, the displacement of the scatterers between the two frames is smaller and hence the velocity resolution is reduced. Conversely, increasing Δt increases the velocity resolution; with Δt = 95τ (figure 4b), the UIV velocity waveform neatly outlined the top of the Doppler spectrum during the acceleration and peak phases of the pulse cycle. However, during the deceleration phase, it is clear that the longer Δt reduces the quality of the velocity measurement (mean absolute difference compared with Doppler was 11 cm s−1 and compared with transit time flow rate was 82 ml min−1). During deceleration, the flow is transitional, and the scatterers gain random three-dimensional velocity fluctuations. The in-plane velocity fluctuations mean the relative positions of the scatterers differ between the image frames, and the out-of-plane velocity component means that the scatterers might not appear in the second frame. These two effects both result in an increasing loss of correlation for longer Δt [46]. This random process results in a spread of measured velocities. The effect is even more notable in the results using the conventional, rather than interleaved, imaging method, which has Δt = 128τ (figure 4c). The flow rate measurements with lower Δt agree with the transit time flow meter; however, for Δt > 79τ, the flow is underestimated during deceleration at around 0.5 s (figure 4d). The difference between velocity profiles during peak velocity and during deceleration is shown in figure 4e,f.
Figure 4.
The influence of Δt on velocity measurement for the flow shown in figure 3 (flow ‘a’ in table 1). Comparison of the measured velocities with those measured by Doppler ultrasound with (a) interleaved imaging Δt = 15τ, (b) interleaved imaging Δt = 95τ and (c) conventional imaging Δt = 128τ. (d) Comparison of the flow rate measured with different values of Δt. Comparison of velocity profiles (e) at peak velocity and (f) during deceleration.
3.1.3. Influence of increased pulse cycle frequency
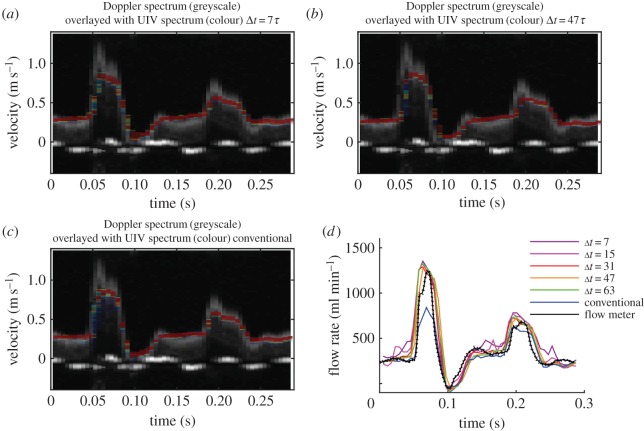
The frequency of the pulse cycle was then increased to 200 bpm (flow ‘b’, figure 5). The centreline velocities for all the values of Δt are very similar, although the longer values do give slightly better velocity resolution (most notably in the second peak.) The peak velocity was underestimated at 0.86 m s−1, compared with the 1.1 m s−1 obtained by Doppler. The short duration of this velocity ‘spike’ in the Doppler spectrum is likely to explain why it was not seen in either the UIV or flow probe results. There was no signal loss in the UIV results during deceleration, which could be because the deceleration phase is so short that there is not enough time for transition to occur [47].
Figure 5.
Straight tube phantom results for flow of glycerol–water at a pulse rate of 200 bpm and maximum velocity around 1 m s−1 (flow ‘b’ in table 1). Comparison of the measured velocities with those measured by Doppler ultrasound with (a) interleaved imaging Δt = 7τ, (b) interleaved imaging Δt = 47τ and (c) conventional imaging Δt = 128τ. (d) Comparison of the flow rate measured with different values of Δt. Flow meter results are mean ± s.d.
3.1.4. Influence of increased peak velocity
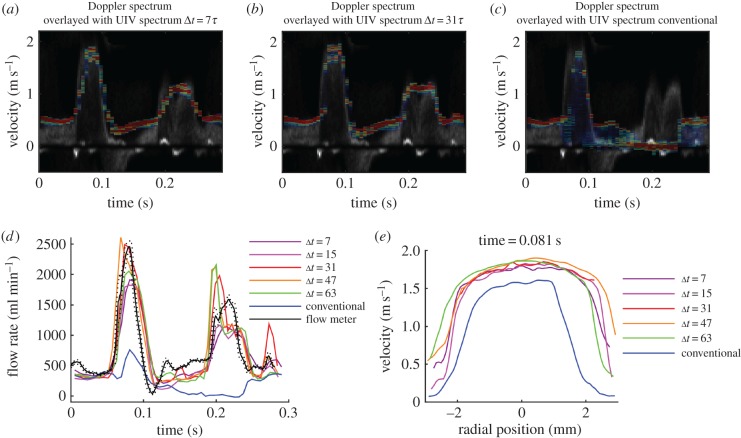
While maintaining a pulse rate of 200 bpm, the peak velocity was then increased to 1.8 m s−1 (flow ‘c’, figure 6). For this flow waveform, the main peak in the velocity wave was well matched by the interleaved UIV for values of Δt between 7τ and 63τ, whereas conventional UIV could not measure these fast velocities. None of the UIV methods could reproduce the negative velocities in the Doppler signal at around 0.12 s.
Figure 6.
Straight tube phantom results for flow of glycerol–water at a pulse rate of 200 bpm and maximum velocity around 1.6 m s−1 (flow ‘c’ in table 1). Comparison of the measured velocities with those measured by Doppler ultrasound with (a) interleaved imaging Δt = 7τ, (b) interleaved imaging Δt = 31τ and (c) conventional imaging Δt = 128τ. (d) Comparison of the flow rate measured with different values of Δt. Flow meter results are mean ± standard deviation. (e) Comparison of velocity profiles at peak velocity.
3.1.5. Influence of increased Reynolds number
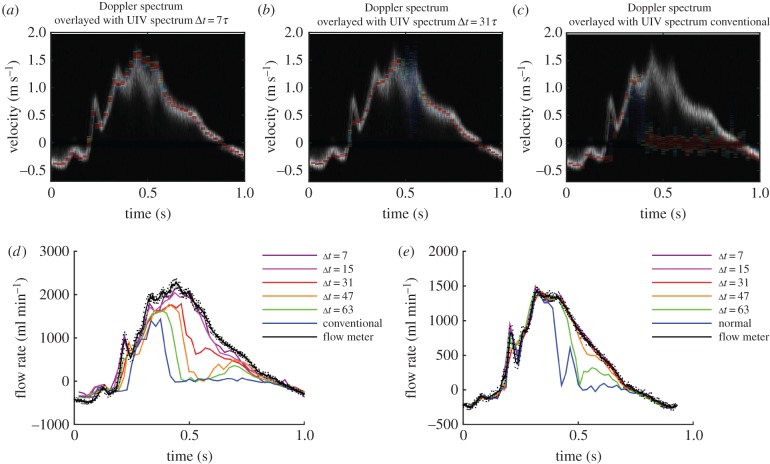
To further investigate the abilities of UIV during flow deceleration, the working fluid was switched to water (flows ‘d’ and ‘e’, figure 7). The flow waveforms in figures 7e,d are very similar (maximum velocity 1.1 m s−1, minimum velocity −0.2 m s−1); however, Reta was 2120 in the case of water, compared with 500 for water–glycerol. Comparing these flow waveforms, it is clear that with the lower viscosity fluid the signal ‘dropout’ occurs at a shorter Δt (63τ, compared with 79τ for the higher viscosity fluid). In the low viscosity (high Reynolds number) case, the transition to turbulence occurs sooner, and/or leads to more turbulent fluctuations and hence more signal loss. Increasing the peak velocity to 1.6 m s−1 required Δt ≤ 15τ to properly capture the velocity and flow waveforms throughout the entire pulse cycle.
Figure 7.
(a–d) Straight tube phantom results for flow of water at a pulse rate of 60 bpm and maximum velocity around 1.6 m s−1 (flow ‘e’ in table 1). Comparison of the measured velocities with those measured by Doppler ultrasound with (a) interleaved imaging Δt = 7τ, (b) interleaved imaging Δt = 31τ and (c) conventional imaging Δt = 128τ. (d) Comparison of the flow rate measured with different values of Δt. (e) Results with the maximum velocity reduced to around 1 m s−1 (flow ‘d’ in table 1). Comparison of the flow rate measured with different values of Δt. Flow meter results are mean ± s.d. This can be compared with figure 4d, which shows data for a similar flow waveform but with water–glycerol.
3.1.6. Influence of increased image depth
Increasing the image depth (flow ‘e’, figure 8) did not cause any problems for the velocity measurement provided that the value for Δt remained similar. For example, the flow waveforms with the depth of 2 cm and Δt = 15τ (0.74 ms) and 63τ (3.12 ms) were very similar to those with depth of 6 cm and Δt = 7τ (0.71 ms) and 31τ (3.14 ms), respectively. Likewise, the waveform with depth 6 cm and Δt = 63τ (6.39 ms) was similar to that obtained from the conventional UIV method which has Δt = 128τ (6.33 ms).
Figure 8.
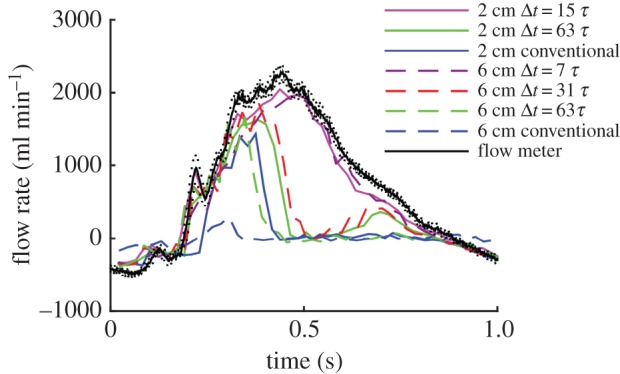
Straight tube phantom results for flow of water at a pulse rate of 60 bpm and maximum velocity around 1.6 m s−1, showing the influence of image depth on flow rate measurement (flow ‘e’ in table 1). Flow meter results are mean ± s.d.
3.1.7. Comparison with theoretical velocity profiles
Velocity profiles were produced by averaging the velocity along the length of the tube. The change in the velocity profile throughout the cycle is shown in figure 3g. Womersley solved the velocity field for pulsatile flow in a long straight tube when the pressure gradient is known [48] and using that theory the profile can be calculated from either the centreline or mean velocity [49]. The tube used here was flexible, so an exact match is not expected; however, for interest, we calculated the Womersley profiles using the flow rate from the transit time flow probe and the mean tube radius measured from the B-mode images.
The resulting theoretical profiles for flow ‘a’ are shown in figure 3g and the mean absolute difference between Womersely and UIV was found to be 6.4 cm s−1 or 6% of the peak velocity. This Womersley comparison was repeated for the remaining flows and the mean absolute difference between the Womersley profiles and the UIV profiles was 9–11% of the peak velocity.
3.1.8. Assessment of variability in the measurements and the flow
The UIV algorithm uses correlation averaging (as explained in §2.3 and [43]) over a number of pulse cycles which means there is no intrinsic estimate of the variability in the results. An estimate of the upper limit on the variability in the results was produced in the following way. The UIV processing was repeated using just 30% of the original data; this corresponded to about 7.5 pulse cycles at 60 bpm and 21 pulse cycles at 200 bpm. The first 30% was used to produce one time-dependent velocity field, the next 30% produced a second velocity field and the third 30% produced a third velocity field. The variability between these independent velocity fields was assessed by comparing the velocity in the sample volume and the flow rate, as presented above for the full data. The mean standard deviation in the velocity was between 1 and 4 cm s−1 (1–6% of peak velocity), and the mean standard deviation in the flow rate was 2–5% of the peak flow rate. The actual variability in the flow was assessed using the standard deviation of the flow rate measured using the transit time flow meter and this was 0.8–1.5% of the peak flow rate.
3.2. In vivo experiment
The UIV data were acquired for 25 s but owing to motion, possibly breathing or difficulty holding the transducer in position, only 10 s of the data were usable. This corresponded to around 40 cardiac cycles.
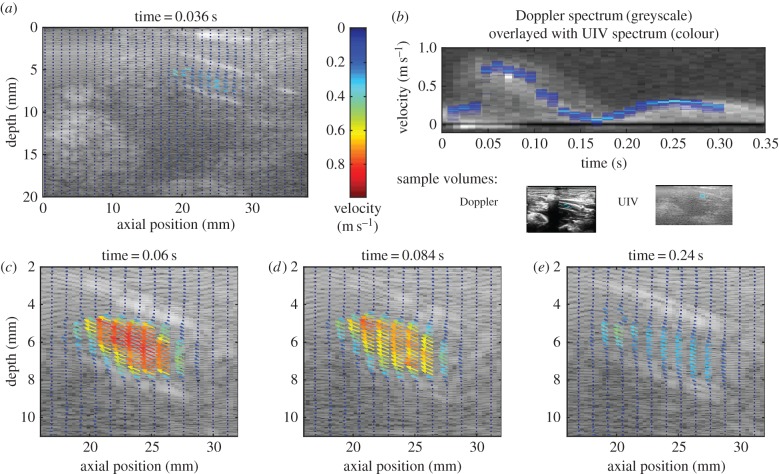
Velocity vectors are plotted for the entire field of view at 0.036 s in figure 9a, and for a subregion of interest for further timesteps in figure 9c–e. Note that for clarity not all of the vectors have been plotted; the resolution of the full vector field is twice that for the straight tube experiments in the x-direction (0.30 × 0.08 mm2, x × y directions).
Figure 9.
Velocity measurements in the rabbit aorta. (a) Velocity vector map for the whole field of view (only every fourth vector is plotted). (b) Comparison of the velocity in the selected region with that measured by Doppler ultrasound. (c–e) Velocity vector maps at selected phases of the cardiac cycle focusing only on the relevant area of the image (only every fourth vector in the x-direction and every second vector in the y-direction are plotted). The aorta goes from bottom right to top left of the field of view.
The shape of the velocity waveform measured with UIV (figure 9b) was in good agreement with the Doppler spectrum and the mean absolute difference was 7 cm s−1 or 9% of peak velocity. Peak systolic velocities were 77 and 82 cm s−1 with UIV and Doppler, respectively. The difference is likely to be due to the practical difficulty of aligning the transducer with the centre of the aorta and holding it steady, as well as the known errors in Doppler ultrasound; in vivo Doppler velocity measurement errors may be up to 75% even with an experienced sonographer [10,50]. Peak systolic flow was calculated to be 175 ml min−1, within the range found for similar anaesthetized rabbits [51].
The variability in the flow was assessed using the Doppler spectrum. The maximum velocity at peak systole was recorded for 10 successive cycles, and the standard deviation was 3 cm s−1 or 3.5% of the peak systolic velocity.
4. Discussion
In this work, a method for using conventional clinical ultrasound hardware to map arterial velocities has been developed. The method is based on interleaved imaging [40], which extends the dynamic range of UIV by enabling shorter Δt without reducing image resolution or field of view. Here the interleaved method has been extended to include phase-based correlation averaging [43] and a method of correcting the velocities for errors introduced by accelerating flows and the sweeping ultrasound beam, a problem first identified by Zhou et al. [32].
Interleaved UIV was used to measure velocity and flow in a straight tube phantom with a variety of flow waveforms. These experiments demonstrated that peak velocities of 1.8 m s−1 could be measured for heart rates of 200 bpm. With a heart rate of 60 bpm, the velocities could be accurately measured throughout the cardiac cycle, even for the highest peak velocities. Both the in-plane velocity components were measured across the entire 38 mm width of the transducer. While peak velocities in healthy arteries are usually of the order of 1 m s−1, in diseased arteries they can be much higher: for example with a carotid stenosis of 50–70%, the velocity is in the range 125–230 cm s−1 [2]. Peak velocities measured using conventional UIV are around 70 cm s−1 [30], although 110 cm s−1 was obtained in this study.
This work has revealed a previously unreported problem with conventional UIV: the measurement of velocity in decelerating flow. The transitional nature of decelerating flows means the scatterers become decorrelated within shorter times and hence require a shorter Δt. Conventional UIV was unable to measure velocity for the complete deceleration phase of the 1.1 m s−1 peak velocity, 60 bpm flow. However, reducing Δt to less than or equal to 63τ enabled accurate measurement of the velocity throughout the decelerating phase. Increasing the Reynolds number required even smaller Δt.
4.1. Acceleration correction
The problem of velocity errors introduced by ultrasound beam sweeping has been reported before [25], and velocity correction methods for the velocity components parallel and perpendicular to the direction of the ultrasound beam sweep have been derived for steady flow [32]. Zhou et al. [32] also reported that there is an additional error in accelerating flows but did not give a correction method. Here we have introduced a method for correcting this additional error which is based on finding the acceleration from the difference between consecutive velocity measurements.
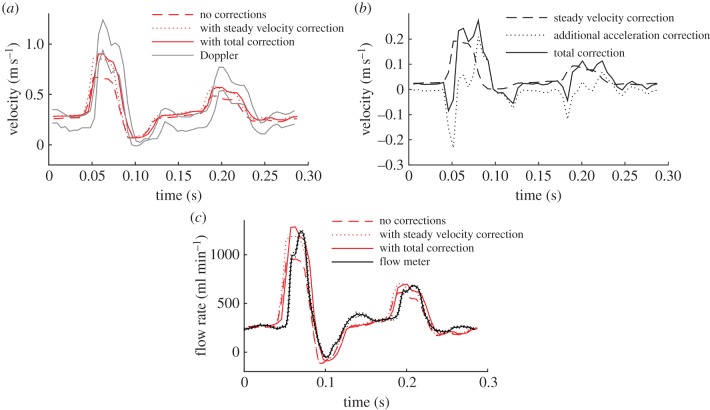
To investigate the difference made to the velocity measurements by the new correction method, the results were compared with those found using the steady flow velocity correction method in equation (2.9) [32] (figure 10). During the flow acceleration phase, the steady flow method overestimates the velocity compared with the new method, whereas during deceleration the opposite is true. The new correction method can be thought of as containing two parts: the steady velocity correction,  , which was found using equation (2.10) and an additional correction for the acceleration Vx − Vxstready. Because, in this experiment, the direction of the flow is always opposite to the ultrasound beam sweep direction, the steady velocity correction is positive throughout the cycle. The direction of the additional acceleration correction is negative during acceleration and positive during deceleration. At the phases where there is a low velocity, but significant acceleration, the magnitude of the additional acceleration correction can be greater than the steady velocity correction. The additional acceleration correction varies with position in the image, increasing in magnitude in the direction of the beam sweep. The magnitude of the total correction,
  , was generally around 10% of the real velocity, Vx, but could reach over 60%.
Figure 10.
Velocity correction due to ultrasound beam sweep. This example is for the flow shown in figure 5 (flow ‘b’ in table 1), looking at the velocity on the axis of the tube, at a location 2.3 cm along the 3.8 cm transducer. (a) Velocity measurements without correction, with correction only for the steady velocity, and with correction also for acceleration. (b) Corrections to the velocity associated with the steady velocity and acceleration. (c) Influence of the corrections on the flow rate measured at this longitudinal position. (Online version in colour.)
4.2. Limitations
The flow waveforms used in the phantom experiments were intended to be representative of arterial flows in the human and rabbit, rather than exactly matching specific arteries. The flows had large in-plane velocity components. UIV suffers limitations in the presence of large out-of-plane velocity components, because the scatterers leave the field of view [46]. With the reduction in Δt, the interleaved method should significantly reduce these limitations, similar to the improvement shown in measuring decelerating flow. For more complicated arterial geometries such as curves, bifurcations and diseased regions, the flow fields are more complicated, and there is a greater need for two velocity components to describe the flow [52,53]. These flows also have significant out of plane components. The benefits of UIV, and particularly interlaced UIV which has the ability to shorten Δt, will be substantial in these types of flows and investigating them is an important next step. The introduction of three-dimensional ultrasound could provide three components of the flow.
The method implemented here relied on post-processing to ensemble average the data. The ensemble averaging has some limitations. The flow phantom data were acquired for 25 s which is significantly longer than a single Doppler measurement. To assess the impact of using less data for the ensemble average, the processing was repeated successively using 10% less data each time. With only 30% of the original data (about 7.5 s), the differences between the UIV results and the validation techniques were slightly higher than with the full data: the difference in the velocity compared with the Doppler spectrum was 9–10% of peak velocity and the difference in the flow rate compared with the transit time flow meter was 5–7% of peak flow. Another potential problem relates to arrhythmias and more unusual measurement situations such as cardiac arrest. Development of a graphical user interface with real-time information would be very helpful for in vivo studies. The real-time system should allow the correlation to be built up over time, similar to ‘persistence’, or image averaging, that is currently implemented on ultrasound scanners. This could be done using a phase locked sliding correlation average.
Both spectral Doppler ultrasound and transit time flow measurement have associated errors, such as spectral broadening and manual angle correction. The combined use of both techniques for validation provides greater certainty in the results.
5. Conclusion
Interleaved UIV provides time resolved, angle independent and full field-of-view maps of in vivo velocities using conventional ultrasound hardware. Provided the appropriate correction is implemented to account for ultrasound beam sweeping, including the new acceleration correction method introduced here, the measurements are accurate: percentage errors were 5–10% compared with spectral Doppler and 2–9% compared with the transit time flow meter. Conventional UIV measurements have been found to be unreliable during flow deceleration, even for moderate decelerations. Interlaced UIV successfully reduces the interframe time, facilitating measurements of pulsatile blood velocities up to at least 1.8 m s−1, including during the deceleration phase. This could enable its use in clinical assessments and thus increase diagnostic accuracy, and allow its use in physiological research, opening up new possibilities for studying the links between blood flow and disease progression.
Ethics
All procedures complied with the Animals (Scientific Procedures) Act 1986 and were approved by the Local Ethical Review Process Committee of Imperial College London.
Authors' contributions
The experiments were conducted in the Department of Bioengineering at Imperial College London and data analysis in the Department of Mechanical Engineering at University of Bath. K.H.F. designed the study, conducted all experiments and interpreted the data; C.P. provided UIV code, technical knowledge and data interpretation; B.Z. assisted with in vitro experiments and velocity corrections; E.B. conducted in vivo experiments with K.H.F.; M.X.T. and P.D.W. helped with the experiment design and analysis of results. All authors contributed to drafting and revising the manuscript and gave final approval for publication.
Competing interests
None of the authors have competing interests.
Funding
K.H.F. was supported by a Marie Curie International Incoming Fellowship from the EC FP7 (no. 274522). E.B. and P.D.W. were supported by a British Heart Foundation programme grant (no. RG/11/5/28743).
References
- 1.von Reutern G-M, et al. 2012. Grading carotid stenosis using ultrasonic methods. Stroke 43, 916–921. ( 10.1161/strokeaha.111.636084) [DOI] [PubMed] [Google Scholar]
- 2.Hathout GM, Fink JR, El-Saden SM, Grant EG. 2005. Sonographic NASCET index: a new Doppler parameter for assessment of internal carotid artery stenosis. Am. J. Neuroradiol. 26, 68–75. [PMC free article] [PubMed] [Google Scholar]
- 3.Secchi F, Iozzelli A, Papini GDE, Aliprandi A, Di Leo G, Sardanelli F. 2009. MR imaging of aortic coarctation. Radiol. Med. 114, 524–537. ( 10.1007/s11547-009-0386-6) [DOI] [PubMed] [Google Scholar]
- 4.Bermejo J, Martinez-Legazpi P, del Alamo JC. 2015. The clinical assessment of intraventricular flows. Annu. Rev. Fluid Mech.47, 315–342 ( 10.1146/annurev-fluid-010814-014728) [DOI] [Google Scholar]
- 5.Sotiropoulos F, Le TB, Gilmanov A. 2016. Fluid mechanics of heart valves and their replacements. Annu. Rev. Fluid Mech.48, 259–283. ( 10.1146/annurev-fluid-122414-034314) [DOI] [Google Scholar]
- 6.Zhong Y, Zhu W, Li CM, Rao L. 2016. Assessment of cardiac dysfunction by dissipative energy loss derived from vector flow mapping. J. Cardiol. 67, 122 ( 10.1016/j.jjcc.2015.06.004) [DOI] [PubMed] [Google Scholar]
- 7.Lin JB, et al. 2015. Imaging of small animal peripheral artery disease models: recent advancements and translational potential. Int. J. Mol. Sci. 16, 11 131–11 177. ( 10.3390/ijms160511131) [DOI] [PMC free article] [PubMed] [Google Scholar]
- 8.Kidher E, Cheng Z, Jarral OA, O'Regan DP, Xu XY, Athanasiou T. 2014. In-vivo assessment of the morphology and hemodynamic functions of the BioValsalva (TM) composite valve-conduit graft using cardiac magnetic resonance imaging and computational modelling technology. J. Cardiothorac. Surg. 9, 11 ( 10.1186/s13019-014-0193-6) [DOI] [PMC free article] [PubMed] [Google Scholar]
- 9.Evans DH, McDicken WN. 2000. Doppler ultrasound: physics, instrumentation and signal processing. Chichester, UK: John Wiley. [Google Scholar]
- 10.Lui EYL, Steinman AH, Cobbold RSC, Johnston KW. 2005. Human factors as a source of error in peak Doppler velocity measurement. J. Vasc. Surg. 42, 972e1–972.e10. ( 10.1016/j.jvs.2005.07.014) [DOI] [PubMed] [Google Scholar]
- 11.Logason K, Barlin T, Jonsson ML, Bostrom A, Hardemark HG, Karacagil S. 2001. The importance of Doppler angle of insonation on differentiation between 50–69% and 70–99% carotid artery stenosis. Eur. J. Vasc. Endovasc. Surg. 21, 311–313. ( 10.1053/ejvs.2001.1331) [DOI] [PubMed] [Google Scholar]
- 12.Department SPCS. 2010. UK audit of vascular surgical services & carotid endarterectomy. London, UK: Royal College of Physicians of London. [Google Scholar]
- 13.Monteiro A, Santos R, Ferreira C, Costa A, Azevedo E. 2014. Internal carotid artery stenosis: validation of Doppler velocimetric criteria. Int. J. Clin. Neurosci. Mental Health1(Suppl. 1), S13 ( 10.21035/ijcnmh.2014.1(Suppl.1).S13) [DOI]
- 14.Taylor CA, Draney MT. 2004. Experimental and computational methods in cardiovascular fluid mechanics. Annu. Rev. Fluid Mech. 36, 197–231. ( 10.1146/annurev.fluid.36.050802.121944) [DOI] [Google Scholar]
- 15.Evans DH. 2010. Colour flow and motion imaging. Proc. Inst. Mech. Eng. Part H: J. Eng. Med. 224, 241–253. ( 10.1243/09544119jeim599) [DOI] [PubMed] [Google Scholar]
- 16.Evans DH, Jensen JA, Nielsen MB. 2011. Ultrasonic colour Doppler imaging. Interface Focus 1, 490–502. ( 10.1098/rsfs.2011.0017) [DOI] [PMC free article] [PubMed] [Google Scholar]
- 17.Bohs LN, Geiman BJ, Anderson ME, Gebhart SC, Trahey GE. 2000. Speckle tracking for multi-dimensional flow estimation. Ultrasonics 38, 369–375. ( 10.1016/s0041-624x(99)00182-1) [DOI] [PubMed] [Google Scholar]
- 18.Hoskins PR, Kenwright DA. 2015. Recent developments in vascular ultrasound technology. Ultrasound 23, 158–165. ( 10.1177/1742271X15578778) [DOI] [PMC free article] [PubMed] [Google Scholar]
- 19.Crapper M, Bruce T, Gouble C. 2000. Flow field visualization of sediment-laden flow using ultrasonic imaging. Dyn. Atmos. Oceans 31, 233–245. ( 10.1016/s0377-0265(99)00035-4) [DOI] [Google Scholar]
- 20.Jensen JA, Nikolov SI, Yu ACH, Garcia D. 2016. Ultrasound vector flow imaging part II: parallel systems. IEEE Trans. Ultrason. Ferroelectr. Frequency Control 63, 1722–1732. ( 10.1109/TUFFC.2016.2598180) [DOI] [PubMed] [Google Scholar]
- 21.Jensen JA, Nikolov SI, Yu ACH, Garcia D. 2016. Ultrasound vector flow imaging part I: sequential systems. IEEE Trans. Ultrason. Ferroelectr. Frequency Control 63, 1704–1721. ( 10.1109/TUFFC.2016.2600763) [DOI] [PubMed] [Google Scholar]
- 22.Poelma C. 2016. Ultrasound imaging velocimetry: a review. Exp. Fluids 58, 3 ( 10.1007/s00348-016-2283-9) [DOI] [Google Scholar]
- 23.Kim HB, Hertzberg J, Lanning C, Shandas R. 2004. Noninvasive measurement of steady and pulsating velocity profiles and shear rates in arteries using echo PIV: in vitro validation studies. Ann. Biomed. Eng. 32, 1067–1076. ( 10.1114/B:ABME.0000036643.45452.6d) [DOI] [PubMed] [Google Scholar]
- 24.Kim HB, Hertzberg JR, Shandas R. 2004. Development and validation of echo PIV. Exp. Fluids 36, 455–462. ( 10.1007/s00348-003-0743-5) [DOI] [Google Scholar]
- 25.Poelma C, Mari JM, Foin N, Tang MX, Krams R, Caro CG, Weinberg PD, Westerweel J. 2011. 3D Flow reconstruction using ultrasound PIV. Exp. Fluids 50, 777–785. ( 10.1007/s00348-009-0781-8) [DOI] [Google Scholar]
- 26.Liu L, Zheng H, Williams L, Zhang F, Wang R, Hertzberg J, Shandas R. 2008. Development of a custom-designed echo particle image velocimetry system for multi-component hemodynamic measurements: system characterization and initial experimental results. Phys. Med. Biol. 53, 1397–1412. ( 10.1088/0031-9155/53/5/015) [DOI] [PubMed] [Google Scholar]
- 27.Westerdale J, Belohlavek M, McMahon EM, Jiamsripong P, Heys JJ, Milano M. 2011. Flow velocity vector fields by ultrasound particle imaging velocimetry: in vitro comparison with optical flow velocimetry. J. Ultrasound Med. 30, 187–195. ( 10.7863/jum.2011.30.2.187) [DOI] [PubMed] [Google Scholar]
- 28.de Azevedo BA, Azevedo LFA, Nunes R, Nobrega ACL. 2015. In vivo blood velocity measurements with particle image velocimetry in echocardiography using spontaneous contrast. J. Brazilian Soc. Mech. Sci. Eng. 37, 559–569. ( 10.1007/s40430-014-0205-4) [DOI] [Google Scholar]
- 29.Qian M, Niu L, Wang Y, Jiang B, Jin Q, Jiang C, Zheng H. 2010. Measurement of flow velocity fields in small vessel-mimic phantoms and vessels of small animals using micro ultrasonic particle image velocimetry (micro-EPIV). Phys. Med. Biol. 55, 6069–6088. ( 10.1088/0031-9155/55/20/003) [DOI] [PubMed] [Google Scholar]
- 30.Zhang F, et al. 2011. In vitro and preliminary in vivo validation of echo particle image velocimetry in carotid vascular imaging. Ultrasound Med. Biol. 37, 450–464. ( 10.1016/j.ultrasmedbio.2010.11.017) [DOI] [PMC free article] [PubMed] [Google Scholar]
- 31.Hong G-R, et al. 2008. Characterization and quantification of vortex flow in the human left ventricle by contrast echocardiography using vector particle image velocimetry. JACC: Cardiovasc. Imaging 1, 705–717. ( 10.1016/j.jcmg.2008.06.008) [DOI] [PMC free article] [PubMed] [Google Scholar]
- 32.Zhou B, Fraser KH, Poelma C, Mari J-M, Eckersley RJ, Weinberg PD, Tang M-X. 2013. Ultrasound imaging velocimetry: effect of beam sweeping on velocity estimation. Ultrasound Med. Biol. 39, 1672–1681. ( 10.1016/j.ultrasmedbio.2013.03.003) [DOI] [PubMed] [Google Scholar]
- 33.Poelma C, van der Mijle RME, Mari JM, Tang MX, Weinberg PD, Westerweel J. 2012. Ultrasound imaging velocimetry: toward reliable wall shear stress measurements. Eur. J. Mech. B 35, 70–75. ( 10.1016/j.euromechflu.2012.03.003) [DOI] [Google Scholar]
- 34.Beulen B, Bijnens N, Rutten M, Brands P, van de Vosse F. 2010. Perpendicular ultrasound velocity measurement by 2D cross correlation of RF data. Part A: validation in a straight tube. Exp. Fluids 49, 1177–1186. ( 10.1007/s00348-010-0865-5) [DOI] [Google Scholar]
- 35.Walker AM, Scott J, Rival DE, Johnston CR. 2014. In vitro post-stenotic flow quantification and validation using echo particle image velocimetry (echo PIV). Exp. Fluids 55, 1821. ( 10.1007/s00348-014-1821-6) [DOI] [Google Scholar]
- 36.Leow CH, Bazigou E, Eckersley RJ, Yu ACH, Weinberg PD, Tang M-X. 2015. Flow velocity mapping using contrast enhanced high-frame-rate plane wave ultrasound and image tracking: methods and initial in vitro and in vivo evaluation. Ultrasound Med. Biol. 41, 2913–2925. ( 10.1016/j.ultrasmedbio.2015.06.012) [DOI] [PubMed] [Google Scholar]
- 37.Udesen J, Gran F, Hansen KL, Jensen JA, Thomsen C, Nielsen MB. 2008. High frame-rate blood vector velocity imaging using plane waves: simulations and preliminary experiments. IEEE Trans. Ultrason. Ferroelectr. Frequency Control 55, 1729–1743. ( 10.1109/TUFFC.2008.858) [DOI] [PubMed] [Google Scholar]
- 38.Ekroll IK, Swillens A, Segers P, Dahl T, Torp H, Lovstakken L. 2013. Simultaneous quantification of flow and tissue velocities based on multi-angle plane wave imaging. IEEE Trans. Ultrason. Ferroelectr. Frequency Control 60, 727–738. ( 10.1109/TUFFC.2013.2621) [DOI] [PubMed] [Google Scholar]
- 39.Lenge M, Ramalli A, Tortoli P, Cachard C, Liebgott H. 2015. Plane-wave transverse oscillation for high-frame-rate 2-D vector flow imaging. IEEE Trans. Ultrason. Ferroelectr. Frequency Control 62, 2126–2137. ( 10.1109/TUFFC.2015.007320) [DOI] [PubMed] [Google Scholar]
- 40.Poelma C, Fraser KH. 2013. Enhancing the dynamic range of ultrasound imaging velocimetry using interleaved imaging. Meas. Sci. Technol. 24, 115701 ( 10.1088/0957-0233/24/11/115701) [DOI] [Google Scholar]
- 41.Carpinlioglu MO, Gundogdu MY. 2001. A critical review on pulsatile pipe flow studies directing towards future research topics. Flow. Meas. Instrum. 12, 163–174. ( 10.1016/S0955-5986(01)00020-6) [DOI] [Google Scholar]
- 42.Glycerine Producers' Association. 1963. Physical properties of glycerine and its solutions. New York, NY: Glycerine Producers’ Association. [Google Scholar]
- 43.Poelma C, Vennemann P, Lindken R, Westerweel J. 2008. In vivo blood flow and wall shear stress measurements in the vitelline network. Exp. Fluids 45, 703–713. ( 10.1007/s00348-008-0476-6) [DOI] [Google Scholar]
- 44.Fraser KH, Poelma C, Zhou B, Bazigou E, Tang MX, Weinberg PD. 2017. Data from ‘Ultrasound imaging velocimetry with interleaved images for improved pulsatile arterial flow measurements: a new correction method, experimental and in vivo validation’. University of Bath Research Data Archive, http://researchdata.bath.ac.uk/318 ( 10.15125/BATH-00318) [DOI] [PMC free article] [PubMed]
- 45.Hoskins PR. 1999. A comparison of single- and dual-beam methods for maximum velocity estimation. Ultrasound Med. Biol. 25, 583–592. ( 10.1016/S0301-5629(98)00189-6) [DOI] [PubMed] [Google Scholar]
- 46.Adrian RJ, Westerweel J. 2011. Particle image velocimetry. Cambridge, UK: Cambridge University Press. [Google Scholar]
- 47.Trip R, Kuik DJ, Westerweel J, Poelma C. 2012. An experimental study of transitional pulsatile pipe flow. Phys. Fluids 24, 014103 ( 10.1063/1.3673611) [DOI] [Google Scholar]
- 48.Womersley JR. 1955. Method for the calculation of velocity, rate of flow and viscous drag in arteries when the pressure gradient is known. J. Physiol. 127, 553–563. ( 10.1113/jphysiol.1955.sp005276) [DOI] [PMC free article] [PubMed] [Google Scholar]
- 49.Blake JR, Meagher S, Fraser KH, Easson WJ, Hoskins PR. 2008. A method to estimate wall shear rate with a clinical ultrasound scanner. Ultrasound Med. Biol. 34, 760–774. ( 10.1016/j.ultrasmedbio.2007.11.003) [DOI] [PubMed] [Google Scholar]
- 50.Tortoli P, Lenge M, Righi D, Ciuti G, Liebgott H, Ricci S. 2015. Comparison of carotid artery blood velocity measurements by vector and standard Doppler approaches. Ultrasound Med. Biol. 41, 1354–1362. ( 10.1016/j.ultrasmedbio.2015.01.008) [DOI] [PubMed] [Google Scholar]
- 51.Alastruey J, Hunt AAE, Weinberg PD. 2014. Novel wave intensity analysis of arterial pulse wave propagation accounting for peripheral reflections. Int. J. Numer. Method Biomed. 30, 249–279. ( 10.1002/cnm.2602) [DOI] [PMC free article] [PubMed] [Google Scholar]
- 52.Tortoli P, Michelassi V, Bambi G, Guidi F, Righi D. 2003. Interaction between secondary velocities, flow pulsation and vessel morphology in the common carotid artery. Ultrasound Med. Biol. 29, 407–415. ( 10.1016/S0301-5629(02)00705-6) [DOI] [PubMed] [Google Scholar]
- 53.Steinman DA. 2004. Image-based computational fluid dynamics: a new paradigm for monitoring hemodynamics and atherosclerosis. Curr. Drug Target Cardiovas Hematol. Disord. 4, 183–197. ( 10.2174/1568006043336302) [DOI] [PubMed] [Google Scholar]


