

Abstract
Complex medical data sometimes requires significant data preprocessing to prepare for analysis. The complexity can lead non-domain experts to apply simple filters of available data or to not use the data at all. The preprocessing choices can also have serious effects on the results of the study if incorrect decision or missteps are made. In this work, we present open-source data filters for an analysis motivated by understanding mortality in the context of sepsis- associated cardiomyopathy in the ICU. We report specific ICU filters and validations through chart review and graphs. These published filters reduce the complexity of using data in analysis by (1) encapsulating the domain expertise and feature engineering applied to the filter, by (2) providing debugged and ready code for use, and by (3) providing sensible validations. We intend these filters to evolve through pull requests and forks and serve as common starting points for specific analyses.
1.0. Introduction
1.1. Motivation
Randomized-controlled trials are considered the gold standard in clinical research to determine the efficacy and adverse effects of an intervention. However, there are many limitations to performing a randomized-controlled trial, including financial and personnel resources as well as patient recruitment, especially if the condition or outcome being studied is not common. Similarly, prospective observational studies can be used to characterize a condition and its associated outcomes, but are time-consuming and require large populations when studying uncommon conditions. Well-conducted retrospective database analyses circumvent many of these issues given the large population of data available for research. Broader exploration of infrequent conditions and outcomes, or of specific cohorts is enabled by big-data analysis tools and retrospective analysis of databases such as MIMIC-III.
MIMIC is an openly available database developed by the MIT Lab for Computational Physiology 1. MIMIC recently released an updated version, MIMIC-III, which contains de-identified patient records for >40,000 critical care patients between 2001 and 2012. MIMIC-III is a 26 table relational database connected by a combination of unique identifiers and dictionary tables that link each identifier’s definition and the corresponding data. For additional information on the data and tables contained within MIMIC-III please refer to the detailed documentation at http://mimic.physionet.org/gettingstarted/overview/.
Using MIMIC-III for analyses is challenging due to the complexity of the input data and the complexity of the imperative preprocessing steps. The complexity of the input data can require significant feature engineering and domain knowledge to get data into a state of analytic readiness. The complexity of the preprocessing steps can also require engineering efforts to reproduce and may lead to profuse bugs as others attempt to reproduce the work.
In this paper, we reduce this complexity by describing and open sourcing code functions which allow other researchers to apply sensible filters toward putting specific data types into analytic form. The functions reduce complexity. First, the functions aggregate domain expertise and feature engineering for each specific data type. Second, the functions are debugged and in active use in our analytic projects.
We expressly aim to publish functions according to several engineering standards. Our intent is to encourage modular sharing through our code and to promote reuse. Publishing functions, such as the ones we propose, have several advantages. First, they promote reuse. Other researchers may easily use our code. Second, the steps are justified. Researchers may examine our feature engineering choices in detail and make sensible choices for their own analyses. Third, they encapsulate domain knowledge by practitioners. This will allow researchers who do not have access to domain experts to apply sensible filtering to clean ICU data. Fourth, the functions are validated. We provide evidence that the filtering is reasonable. Fifth, they are debugged. The code is in active use for our ICU projects and has been tested. Sixth, they provide a baseline starting point for applying different kinds of preprocessing toward optimizing objectives. For example, researchers may use our filters as a baseline and then from these tweak and build their own filters.
1.2. Background - Sepsis-Associated Cardiomyopathy
We motivate our overall approach with a clinical example. This example drives the design choices that we have made along the way. Acute left ventricular dysfunction has been reported to occur in one third of critically ill patients 2. The inflammatory state associated with severe sepsis and septic shock can lead to dysfunction of multiple organ systems, including myocardial depression resulting in sepsis-associated cardiomyopathy. Also known as septic cardiomyopathy, this condition is characterized by acute left ventricular dysfunction, reduced ejection fraction and normal or increased cardiac output. By definition, sepsis-associated cardiomyopathy is reversible with resolution of the acute septic state with early studies reporting resolution of left ventricular dysfunction in 7-10 days 3.
Although cardiovascular dysfunction is known to increase mortality, the prognostic implications of sepsis-associated cardiomyopathy remains controversial. Whether these patients should be managed any differently from patients with sepsis without associated cardiomyopathy is also unknown. Data on the pathophysiology, management and outcomes of this entity are limited and the literature on this topic consists mostly of small observational cohort studies.
2.0. Methods and Results
2.1. General Approach
The general approach to this case study investigation was to sequentially filter a large, diverse ICU cohort to one that reflects patients indicative of a particular condition, in our case sepsis-associated cardiomyopathy. Simple, modular functions are written that can be modified and assembled in countless ways. We will present six functions in this case study that (1) describe identification of sepsis, (2) discern severity of cardiomyopathy, (3) identify sepsis manifestations on admission, (4) exclude CHF/cardiomyopathy in past medical history, (4) calculate volume of intravenous fluids administered, and (6) calculate a severity of illness score. The six functions fit broadly into filtering of the dataset or calculating clinically significant parameters. For each function, we describe our method and approach and provide a simple chart review or graphical validation.
MIMIC-III uses subject, hospital admission, and ICU stay identifiers to distinguish individuals and their distinct inpatient admissions to the hospital and ICU respectively. These identifiers serve as a key in the majority of tables within the database but cases of repeated admission within the database were observed, i.e. individuals were admitted to the hospital/ICU more than once. The decision to use HADM_ID as the primary identifier and translate into the others only when necessary was made since sepsis-associated cardiomyopathy is an acute but reversible condition and distinct hospital admissions are unlikely to be affected by previous admissions.
2.2. Filtering database to target cohort
2.2.1. Sepsis Identification
Method:The MIMIC-III database contains great depth and breadth of ICU data. In order to filter the database down to patients relevant for a sepsis-associated cardiomyopathy study, the first step was ICD-9 requirements for severe sepsis. Patients with severe sepsis, defined as evidence of the systemic inflammatory response syndrome, source of infection, and at least one organ function dysfunction, were selected using the discharge ICD-9 codes indicative of infection 4 concurrent with ICD-9 codes indicative of new onset organ dysfunction 4, 5. The complete list of ICD-9 codes with the function are available at the project page: https://github.com/vim261/MIMIC-ICU-filter-modules/wiki.
Validation:The ICD-9 codes were independently reviewed in 30 final cohort individuals. The raw discharge summary was reviewed and compared to the ICD-9 codes to determine if the ICD-9 codes truly reflect a severe sepsis cohort. In three of the 30 randomly selected patients, there was no identified infection during the hospitalization despite the presence of ICD-9 codes indicative of infection. This accuracy met the criteria for our study and we did not pursue further refinements of the coding.
2.2.2. Cardiomyopathy Identification (extracting ejection fractions)
Method:In addition to ICD-9 codes, for a patient to be included, at least one echocardiogram report must be contained within the database and contain a valid left ventricular ejection fraction (LVEF). LVEFs are searched for from the raw, unstructured, free-text echocardiogram reports in both numeric (e.g. LVEF > 55% or LVEF = 60-80%) and ordinal (e.g. normal or severe) formats. LVEF is characterized by four ordinal values (Table 1).
Table 1.
Clinically defined values of left ventricular dysfunction and the associated numeric ranges of LVEF.
| LVEF numerical range (%) | Ordinal value | Text string examples |
|---|---|---|
| LVEF < 30 | Severe | severely depressed, severe LV/center ventric. systolic dysfunction, severe hypokinesis |
| 30 ≤ LVEF < 45 | Moderate | moderately depressed, moderate LV/center ventric. systolic dysfunction, moderate hypokinesis |
| 45 ≤ LVEF < 55 | Mild | mildly depressed, mild LV/center ventric. systolic dysfunction, mild hypokinesis |
| 55 ≤ LVEF | Normal | low normal EF, LV function normal, normal LV/left ventric./biventricular systolic function, LV/left ventric. systolic function grossly preserved |
Numeric values of LVEF are binned into the four ordinal values as there is no way of back-calculating the numeric LVEF from the ordinal value and the ordinal values are relevant to clinical decision-making.
Searching through the raw, unstructured, free-text notes to find the echocardiogram reports is one of the more computationally expensive tasks of the analysis. All of the free-text notes are included in one, 4 GB. csv file. A python- based command line tool called csvkit 6 was used to extract only the echocardiogram reports and circumvent problems arising from a comma-delimited file containing commas within the text field. The echocardiogram reports were later searched in R using regular expressions.
Validation:Over 150 distinct echocardiogram reports were independently reviewed and compared to the LVEF value extracted. Several examples of various text phrases used to describe left ventricular dysfunction were identified and amended to the list (Table 2). Otherwise, we excluded all cases of failure to extract an LVEF. These reports either had no mention of the LVEF or were transesophageal echocardiograms (TEEs).
Table 2.
Inclusion and exclusion lists for admission diagnosis.
| Inclusion | acute renal failure, adult respiratory distress syndrome, altered mental status, ards, arf, arrest, aspiration pneumonia, bacteremia, cardiac arrest, cardiogenic shock, cellulitis, change in mental status, cholangitis, cholecystitis, colitis, dehydration, diabetic ketoacidosis, diarrhea, diverticulitis, dyspnea, elevated lfts, elevated creatinine, empyema, encephalopathy, endocarditis, epidural abscess, failure to thrive, febrile neutropenia, fever, fib arrest, hepatic encephalopathy, hepatic failure, hepatitis, hyperglycemia, hypoglycemia, hypotension, hypotensive, hypothermia, hypoxia, infected graft, infection, infection, influenza, liver failure, meningitis, mental status change, mental status changes, methicillin resistant staph aureus, nausea, neutropenia, osteomyelitis, pancreatitis, pancytopenia, pea arrest, pna, pneumonia, post arrest, post op infection, pyelonephritis, r/o sepsis, renal failure, resp failure, respiratory arrest, respiratory distress, respiratory failure, sepsis, septic knee, septic shock, shock, shortness of breath, sob, spontaneous bacterial peritonitis, tachycardia, thrombocytopenia, unresponsive, urinary tract infection, urosepsis, uti, vomiting, weakness, wound infection |
| Exclusion | acute leukemia, acute subdural hematoma, blunt trauma, bowel obstruction, bright red blood per rectum, cerebrovascular accident, chf, chf exacerbation, congestive heart failure, fall, femur fracture, gastrointestinal bleed, gi bleed, head bleed, heart failure, hip fracture, intracranial hemorrhage, intraparenchymal hemorrhage, lower gi bleed, overdose, pulmonary embolis, pulmonary embolus, ruptured aaa, s/p fall, s/p motor vehicle accident, stemi, stroke, stroke-transient ischemic attack, stroke/tia, subarachnoid hematoma, subarachnoid hemorrhage, subdural hematoma, subdural hemorrhage, syncope, tia, transient ischemic attack, transient ischemic attack (tia), trauma, tylenol od, tylenol overdose, upper gastrointestinal bleed, upper gi bleed, variceal bleed |
2.2.3. Admission diagnosis inclusion/exclusion
Method:Given that our ICD-9 inclusion criteria were derived from discharge ICD-9 codes, and there is no other way of determining the time of onset, we also incorporated admission diagnosis consistent with a manifestation of severe sepsis into our inclusion criteria. After this step, we assume that admission is a consistent zero-time point from which temporal data is linked and comparable among the cohort. The admission diagnosis is a free text-based field in the database that clinicians were required to populate. Unfortunately, as a result the quality of this field is often poor.
All admission diagnoses were split into basic components (separators of commas and semicolons) and each component with frequency ≥ 3 were independently reviewed to generate a list of inclusion and exclusion terms. Patients were included if their admission diagnosis field could be a manifestation of sepsis but excluded if it also contained any of an exclusion list (Table 2). The exclusions remove patients that are admitted primarily for a non-sepsis condition and includes accidents, fractures, heart failure, gastrointestinal bleed, stroke, trauma, and others. A group of patients failed to meet the requirements of either the inclusion or exclusion lists and were excluded for lack of information about their presenting diagnosis. Of the 7984 patients with severe sepsis and an interpretable echocardiogram, 4044 pass this admission diagnosis filtering step. The remainder were either actively excluded, n = 6, or do not have an admission diagnosis that resembles a manifestation of sepsis, n = 3934.
We chose to be strict in our inclusion criteria for admission diagnosis in order to achieve a more specific cohort at the expense of possibly losing some patients who may in fact have been admitted with severe sepsis. Furthermore, the use of text-based admission diagnosis could be greatly improved by restricting this field to pre-defined diagnoses rather than allowing a free text field, as there was a very skewed count distribution of admission diagnosis with hundreds of strings occurring only once or twice which were automatically excluded.
Validation:The resulting cohort’s raw admission diagnosis were independently reviewed in a random sample of 30 patients. Each individual’s discharge summary was read to determine whether the inclusion/exclusion criteria used adequately identified patients with severe sepsis. In three of the 30 randomly selected patients, patients had a condition other than sepsis on admission, but this was not discernable based on the admission diagnosis field. For example, one patient was admitted with a diagnosis of shortness of breath and initially thought to have possible pneumonia, but the clinical presentation was later thought to be consistent with volume overload without infection. All three of these patients were included in the cohort based on the ICD-9 inclusion criteria because they did in fact develop an infection later during the hospitalization. This accuracy met the criteria for our study and we did not pursue further refinements of the coding.
2.2.4. Past medical history
Method:The last cohort filtering step was inspecting the past medical history (PMH) within the discharge summaries for any mention of past heart failure, hypokinesis, ventricular dysfunction, or depressed LVEF. Patients with preexisting heart failure and/or reduced LVEF cannot be reliably diagnosed with further sepsis-associated cardiomyopathy in addition to their pre-existing left ventricular dysfunction in this retrospective study. Identical to the echocardiogram reports, the discharge summaries are extracted from the raw table with csvkit 6 and the PMH section of each semi-structured report searched with a list of heart failure related terms and then the aforementioned numerical LVEF algorithm (Table 3).
Table 3.
Text strings and numerical LVEF used to exclude patients with past medical history of reduced LVEF.
| Text strings | cardiomyopathy, depressed EF, depressed ejection fraction, depressed LVEF, global hypokinesis, ventricular hypokinesis, ventricular dysfunction, heart failure, HF, CHF, HFREF, HFPEF |
| Numerical LVEF | If a numerical LVEF existed, patients were excluded if LVEF < 55%. |
Validation:The past medical history was independently reviewed in the discharge summaries of 30 final cohort individuals. The presence or absence of pre-existing heart failure, both systolic and diastolic, was accurately identified in all 30 randomly selected patients.
2.2.5. Resulting filtered cohort
At this stage, each patient in the cohort: 1) has severe sepsis, defined by ICD-9 codes for both major organ dysfunction and systemic infection, 2) had an echocardiogram during their admission with a recorded, and interpretable, LVEF measure, 3) is admitted to the hospital with an admission diagnosis consistent with a manifestation of sepsis, and 4) has no known history of heart failure or reduced LVEF. Patients that were not admitted to the ICU within 24 hours of their hospital admission (that is, they spent time on a ward before the ICU) were also excluded as their sepsis- associated cardiomyopathy was unlikely to be the cause of admission (n=795). Patients with zero records of fluid ins were also removed from the final cohort (n=48). This resulted in a cohort of n = 2350 patients without a prior history of heart failure who were admitted to a medical intensive care unit with severe sepsis and had an echocardiogram during their hospitalization. Figure 1 describes the number of patients in the cohort at each filtering step.
Figure 1.
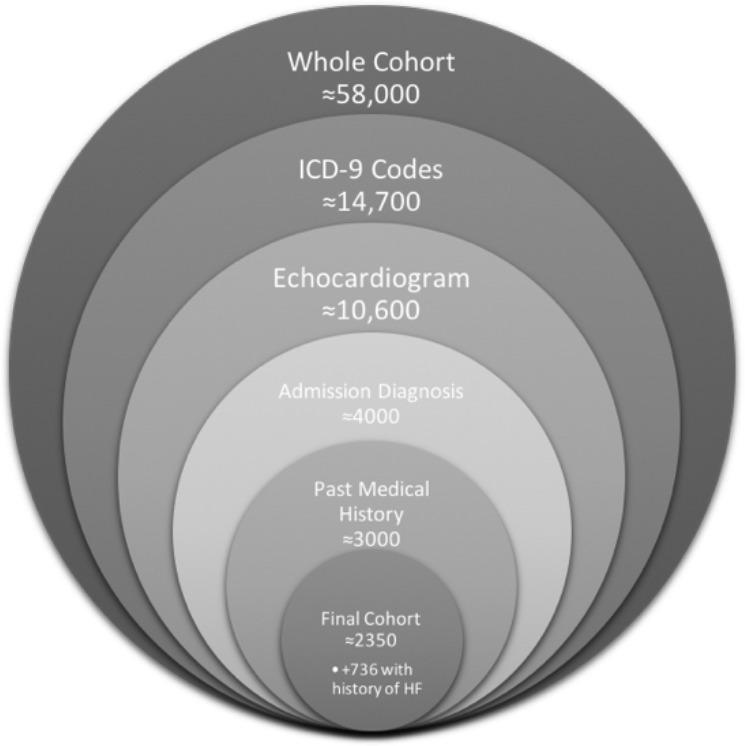
Summary of the filtering steps from the whole database to the final cohort.
2.3. Calculation of Clinical Parameters
2.3.1. Fluids
Methods:Given the lack of evidence on the best fluid management strategy in patients with sepsis-associated cardiomyopathy, one of our clinical questions was to describe the differences in volume of fluids administered among patients with varying degrees of left ventricular dysfunction and its association with mortality. To address the effects of fluid management on patient outcomes, the fluids given to the cohort must be calculated. MIMIC-III contains tables of the various enterally and parenterally administered products (“ins”) including intravenous saline, intravenous blood products, intravenous and oral nutrition and intravenous medications. Tables of “outs” include outputs such as urine and drain output. In this analysis, fluids are restricted to items with volume units (fortunately all recorded ins were consistently measured in mL, verified by manual inspection). For each patient, all ins were extracted and summed for the first 72 hours following admission to the ICU. Evidence behind early goal-directed therapy for sepsis supports aggressive fluid resuscitation in the first six hours after admission 7, however, given that patients requiring continued ICU stay likely remained acutely ill, we analyzed fluids administered over the initial 72 hours to examine physician practices in this setting.
The fluid ins and outs are categorized by unique item identifiers (MIMIC-III: ITEM_ID), that arose from combining two systems, one of which allowed manual naming during data collection. An attempt was made to limit the fluid analysis to the fluid types most commonly administered for fluid resuscitation purposes, excluding nutrition for example, but the same type of fluid was listed in various different text strings, and the decision was made that fluids of any kind should have the same effect on fluid balance and therefore all types of intravenously or orally administered fluids were included.
Information from many different database tables is combined into one table that is then used for the analysis. The final table includes patient identifiers, length of stay in the ICU and hospital, gender, age, date of echocardiogram, LVEF, mortality flags, volume of fluids in and out over 72 hours, and the OASIS score.
Validation 1 - Descriptive:The validity of the fluids calculation is dependent on the accuracy and reliability of the individual recordings in the database. Some patients have zero or very few recorded fluid ins or outs over several days. Many patients do not appear to have been administered substantial fluids. These same patients are likely to be those who are less severely ill or ill in a manner where strict fluid management is less important, and it is likely that these patients’ ins were not being strictly recorded. The histogram of Figure 2 illustrates this highly skewed distribution with a large peak near zero representing the 55 (2.3%) of patients with zero and 101 (4.3%) of patients with less than 1000 mL of fluid ins recorded over 72 hours. Note that 48 patients with zero fluid records have already been removed for lack of information.
Figure 2.
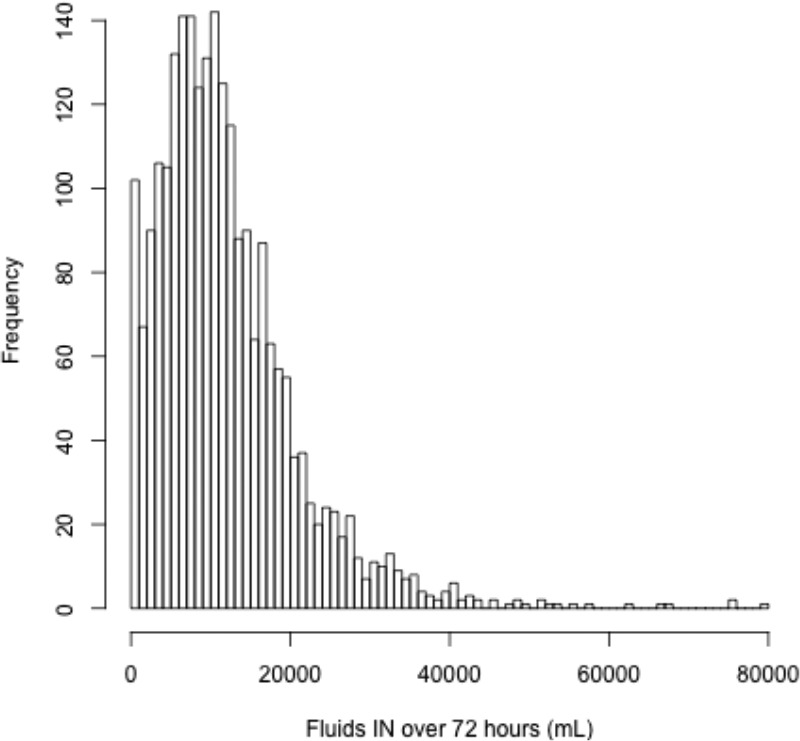
Histogram of the fluids administered over 72 hours.
Validation 2 - External Cohorts:In order to address the potential invalidity of the recorded fluid ins, comparison of the distribution of fluid ins and outs between patients with sepsis-associated cardiomyopathy and several other cohorts was made. Even if the absolute values of fluid do not reflect the actual quantity of fluids administered, if the relative fluid quantities are appropriate between cohorts, the analysis outcomes should remain valid.
The final filtering step of excluding patients with a past medical history of heart failure or reduced LVEF removes 736 patients that would otherwise be eligible for the main cohort. These patients will be the first group compared to the main cohort. Patients with previous left ventricular dysfunction will likely be administered less fluid to avoid fluid overload and pulmonary edema, despite their severe sepsis.
By considering the excluded group at each of the other filtering steps, three other cohorts are found. Severe sepsis patients, by ICD-9 diagnostic code, but without an echocardiogram or no recoverable LVEF (n = 6702), heart failure with no systemic infection, by ICD-9 codes (n = 6042), and systemic infection without major organ dysfunction, again by ICD-9 code, (n = 7079). Finally, a completely unrelated cohort of active dialysis patients is included as a lower limit of fluid requirements (n = 2417).
Each patient’s fluid ins and urine output are summed over the first 72 hours of their ICU admission. An empirical cumulative distribution function is calculated for each group and overlaid in Figure 3.
Figure 3.

Empirical cumulative distribution function of (a) fluids administered, and (b) urine output over 72 hours for each of six independent cohorts.
As expected, dialysis patients receive the least amount of fluid ins, and the least amount of urine output given that many are unable to produce urine. Similarly, heart failure patients without infection also receive a relatively small amount of fluid ins given their increased risk of volume overload and pulmonary edema. Patients with pre-existing heart failure and concomitant severe sepsis, however receive more fluid ins than their counterparts with heart failure without infection given that the management of sepsis includes fluid resuscitation despite the risk of volume overload. Patients with severe sepsis and no history of heart failure (main cohort) have the largest amount of fluid ins, again as expected given that fluids are the mainstay of sepsis management. These findings validate that, in aggregate, the fluids reflect our expectations in the various cohorts.
By a Mann-Whitney test, all fluids in medians are significantly different (p < 0.05). For the fluids out medians, most comparisons are significantly different except comparisons between the heart failure with no infection, infection without organ dysfunction, and severe sepsis with no echocardiogram groups that have similar medians (p > 0.05).
2.3.2. OASIS
Methods:Unfortunately, the absence of a reliable ICU severity of illness score in the database requires the analyst to calculate their own. APACHE II or IV require variables that are not easily obtainable or ubiquitous in MIMIC including numerous lab results. In addition, several parameters are difficult to address with limited retrospective data such as whether the patient has acute renal failure, other chronic organ insufficiency or is immunocompromised. Although these questions could be addressed with a combination of ICD-9 codes, DRG codes and text-mining through the discharge summaries, any attempt to address these factors would not be robust without significant optimization.
In order to control for differences in severity of illness amongst the cohort, we implemented the Oxford Acute Severity of Illness Score (OASIS) 8. As opposed to comorbidity scores, such as the Elixhauser score, which are often derived exclusively from ICD-9 diagnosis codes, the OASIS score is a severity of illness score optimized for predictive strength with the fewest, and easily obtainable, subset of APACHE IV 9 data elements. OASIS includes the heart rate, mean arterial pressure (MAP), respiratory rate, temperature, pre-ICU length of stay, patient age, Glasgow Coma Score (GCS), urine output, if the patient is ventilated on day 1, and if the patient was admitted following an elective surgery. Similar to APACHE 9, 10, OASIS is implemented with the most extreme values of each variable and the total urine output over the first 24 hours in the ICU which reflects the time within which clinical decisions regarding fluid resuscitation are made.
Many of the required variables for OASIS were recorded and time-stamped in the database (MIMIC-III: CHARTEVENTS). Age is given (MIMIC-IIIPATIENTS), pre-ICU length of stay was calculated as the difference between ICU and hospital admission (MIMIC-III:ICMSTA7 and MIMIC-IIIADMISSION) tables, urine output was calculated similarly to fluid ins, ventilation was addressed by the existence of an FiO2 value (MIMIC- III.CHARTEVENTS) and given our inclusion criteria there were no patients in our cohort who were admitted following elective surgery. This was validated by manually reviewing the discharge summaries of 50 randomly selected final cohort patients, none of whom were admitted after elective surgery.
The item identifier (MIMIC-III:ITEM_ID) for each OASIS variable was manually searched in the dictionary table (MIMIC-III:D_ITEMS), and then extracted from the very large, 29GB table (MIMIC-III:CHARTEVENTS). Searching through and extracting chart records (from MIMIC-III.CHARTEVENTS) in order to calculate the OASIS score was the most computationally expensive component of the analysis. Bash scripts were used to extract the manually derived item identifiers (MIMIC-III:ITEM_IDs) for each relevant parameter separately which were then further processed in R and later combined. Similar to the admission diagnosis or fluid in identifiers, the chart item identifiers are not systematically organized. Numerous codes for each parameter are included in the database, most of which are infrequently used but all are included. Please refer to the project page at https://github.com/vjm261/MIMIC-ICU-filter-modules/wiki for the complete list of ITEM_IDs used for each OASIS parameter.
The OASIS score is a sum of component weights for each parameter. That is, each parameter falls within a weighted bin and the combination of parameter scores is the resulting OASIS score sum. The maximum and minimum of each parameter were extracted for each patient and the greater OASIS score component was used to calculate the total OASIS score.
Several problems arose in the combination of OASIS components:
Temperature existed in both Fahrenheit and Celsius; given that temperatures were usually recorded in Fahrenheit, that was searched for first and if no record existed, Celsius was converted to Fahrenheit.
MAP was uncommon in CHARTEVENTS. Instead, MAP was calculated from blood pressure measurements that exist for every patient using MAP = (DBP*2/3) + (SBP*1/3), where DBP and SBP are the diastolic and systolic blood pressures respectively.
GCS was recorded as a total score or in its components (eye, verbal and motor response); this was thought to be an artifact due to the change in the clinical information system during the data capture period, and the component scores were summed to result in a total GCS score. Although most patients had either the GCS total or all three GCS components recorded in the first 24 hours in the ICU, 17.2% of patients did not.
No records of urine output existed for 11.0% of patients.
No record of body temperature existed for 0.1% of patients.
The patients with missing GCS, urine or temperature were imputed with k-nearest neighbors (kNN) with k = 5. All of the OASIS parameters, including the min, max, and median of the repeated chart variables were used to impute total GCS, total urine and temperature min, max, and median. The percentage of patients with missing GCS scores who were also missing urine outputs was 12.1% (108 of 888 patients), which is similar to the percentage of patients missing urine outputs among the entire cohort (11%) and suggests that the missingness of data is uniform and not limited to a specific group of patients.
Validation:The OASIS score has been previously validated in a very large ICU dataset 8, however, we used logistic regression to validate our function used to calculate the OASIS score. The OASIS score was used with age and gender to predict ICU mortality. Age was factored into 10 year bins, referenced to the ≤ 30 years group, whereas OASIS was factored into five equal-population quintile bins with the least severe factor, OASIS ≤ 30, used as a reference point. Quintile bins were used as the proportion of patients that died and is consistent within each bin but different between bins. The odds ratio (OR) with a 95% confidence interval (CI) is presented with the corresponding p-value (Table 4).
Table 4.
Logistic regression OR, 95% CI and associated p-value for each predictor variable.
| OR | 95% CI | p-value | |
|---|---|---|---|
| (Intercept) | 0.08 | [0.04, 0.15] | 3.10 x 10⁻¹³ |
| OASIS (30,36] | 1.79 | [1.21, 2.67] | 0.004 |
| OASIS (36,43] | 2.33 | [1.62, 3.37] | 5.60 x 10⁻⁶ |
| OASIS (43,49] | 2.72 | [1.88, 3.99] | 1.80 x 10⁻⁷ |
| OASIS (49,70] | 5.87 | [4.14, 8.46] | 2.60 x 10⁻²² |
| Age (30,40] years | 1.09 | [0.49, 2.51] | 0.83 |
| Age (40,50] years | 1.15 | [0.58, 2.43] | 0.70 |
| Age (50,60] years | 1.21 | [0.64, 2.47] | 0.58 |
| Age (60,70] years | 1.39 | [0.73, 2.82] | 0.34 |
| Age (70,80] years | 1.48 | [0.78, 3.01] | 0.25 |
| Age (80,90] years | 1.48 | [0.78, 3.04] | 0.25 |
| Age (90,100] years | 1.13 | [0.55, 2.47] | 0.75 |
| Gender (M) | 1.14 | [0.93, 1.40] | 0.21 |
Increasing OASIS score is significantly associated with an increased mortality rate among our cohort of severe sepsis patients, as expected. Relative to the lowest quintile of OASIS score (≤ 30), the odds ratios of the four higher quintiles are 1.79 [1.21, 2.67], 2.33 [1.62, 3.37], 2.72 [1.88, 3.99], and 5.87 [4.14, 8.46] respectively, supporting that OASIS calculated from the MIMIC-III database reflects the increased risk of death for more severely ill patients and validates the use of OASIS in both this database and others.
3.0. Discussion
3.1. Function Design
We applied several software design principles laid out in Clean Code 11 such as input parameter reduction, descriptive parameter naming, and data abstraction to create simple and reusable functions. We also built functions at multiple levels of granularity. At the first level is to assume that the database input structure is fixed and then the filters are applied. At the second level is to have functions that only accept data primitives (i.e. strings). For example, two simplified functions in each category are:
extract_echoreports_from_notes_mimic_dbase(<MIMIC-III database>) extract_ef_from_echos(<echo report>)
3.2. Generalization
In this report, we describe and publish several filters on ICU data. These functions are customized toward our specific example. However, we see our filters as routine data processing steps for producing features on a given output type. These filters may also serve as building blocks that may be customized to other examples. These other examples may cite and fork our work to build their own filter functions.
3.3. Data Structure Changes
Some of these functions are sensitive to changes in the underlying data structure. If the MIMIC tables change, then the code will need to be updated to take into account the modified structure.
3.4 Validations
For each filter, we provided a validation by either chart review or further analysis. For some cases, the accuracy metric was less than 100%. We could have iterated further in refining our criteria. However, our validations met our error tolerances and in the context of the sepsis-associated cardiomyopathy, we were able to continue our clinical analysis. Our validation methods are also biased toward charts that meet the filter requirements. For example, we do not consider patients that may have had sepsis but the ICD-9 simply wasn’t recorded. In analyzing these huge retrospective databases, we felt that missing these uncommon occurrences was acceptable for our clinical question.
Chart review validation focused exclusively on minimizing false positives (i.e. optimizing precision) to improve the quality of the filtered cohort. Further work is required to broaden each filter to improve recall and specificity. The optimal operating point, balancing precision and recall, is likely to be highly problem. For our use-case, maximizing the recall was not a priority, instead the filters presented ensure all patients meet all filtering conditions.
4.0. Conclusion
We open-sourced a series of filters and validations on complex medical ICU data. These functions encapsulate the domain expertise and feature engineering of the medical authors and serve as a starting point for other researchers to apply to their own modeling work. Through pull requests and fork processes through git, we expect these functions to evolve and serve as common starting points for analysis. We demonstrate filters for cohort selection, fluids, and calculation of an ICU severity of illness score. We also validate each filter through chart review and sensible graphs. The code repository is available at https://github.com/vim261/MIMIC-ICU-filter-modules/wiki.
Acknowledgements
This work is supported by NIH grant 1UL1TR001445-01.
References
- 1.Saeed M, Villarroel M, Reisner AT, Clifford G, Lehman L, Moody G, Heldt T, Kyaw TH, Moody B, Mark RG. Multiparameter intelligent monitoring in intensive care II (MIMIC-II): A public-access intensive care unit database. 2011;3(9):952–960. doi: 10.1097/CCM.0b013e31820a92c6. [DOI] [PMC free article] [PubMed] [Google Scholar]
- 2.Chockalingam A, Mehra A, Dorairajan S, Dellsperger KC. Acute left ventricular dysfunction in the critically ill. Chest. 2010 Jul.138(1):198–207. doi: 10.1378/chest.09-1996. PMID: 20605820. [DOI] [PubMed] [Google Scholar]
- 3.Bouhemad B, Nicolas-Robin A, Arbelot C, Arthaud M, Féger F, Rouby JJ. Acute left ventricular dilatation and shock-induced myocardial dysfunction. Crit Care Med. 2009 Feb.37(2):441–7. doi: 10.1097/CCM.0b013e318194ac44. PMID 19114917. [DOI] [PubMed] [Google Scholar]
- 4.Martin GS, Mannino DM, Eaton S, Moss M. The epidemiology of sepsis in the United States from 1979 through 2000. N Engl J Med. 2003 Apr.348(16):1546–54. doi: 10.1056/NEJMoa022139. PMID: 12700374. [DOI] [PubMed] [Google Scholar]
- 5.Angus DC, Linde-Zwirble WT, Lidicker J, Clermont G, Carcillo J, Pinsky MR. Epidemiology of severe sepsis in the United States: analysis of incidence, outcome, and associated costs of care. Crit Care Med. 2001 Jul.29(7):1303–10. doi: 10.1097/00003246-200107000-00002. PMID: 11445675. [DOI] [PubMed] [Google Scholar]
- 6.Groskopf C csvkit [Internet]. 2015 [cited 1 October 2015]. Available from: http://csvkit.readthedocs.org/
- 7.Rivers E, Nguyen B, Havstad S, Ressler J, Muzzin A, Knoblich B, Peterson E, Tomlanovich M. Early Goal- Directed Therapy Collaborative Group. Early goal-directed therapy in the treatment of severe sepsis and septic shock. N Engl J Med. 2001;345(19):1368. doi: 10.1056/NEJMoa010307. PMID 11794169. [DOI] [PubMed] [Google Scholar]
- 8.Johnson AE, Kramer AA, Clifford GD. A new severity of illness scale using a subset of Acute Physiology And Chronic Health Evaluation data elements shows comparable predictive accuracy. Crit Care Med. 2013 Jul.41(7):1711–8. doi: 10.1097/CCM.0b013e31828a24fe. PMID: 23660729. [DOI] [PubMed] [Google Scholar]
- 9.Zimmerman JE, Kramer AA, McNair DS, Malila FM. Acute Physiology and Chronic Health Evaluation (APACHE) IV: hospital mortality assessment for today’s critically ill patients. Crit Care Med. 2006 May.34(5):1297–310. doi: 10.1097/01.CCM.0000215112.84523.F0. PMID: 16540951. [DOI] [PubMed] [Google Scholar]
- 10.Knaus WA, Draper EA, Wagner DP, Zimmerman JE. APACHE II: a severity of disease classification system. Crit Care Med. 1985 Oct.13(10):818–29. PMID: 3928249. [PubMed] [Google Scholar]
- 11.Martin RC. Clean code: a handbook of agile software craftsmanship. Upper Saddle River NJ: Prentice Hall; 2008. ISBN:0132350882 9780132350884. [Google Scholar]