Abstract
Analysis of user interactions in online communities could improve our understanding of health-related behaviors and inform the design of technological solutions that support behavior change. However, to achieve this we would need methods that provide granular perspective, yet are scalable. In this paper, we present a methodology for high-throughput semantic and network analysis of large social media datasets, combining semi-automated text categorization with social network analytics. We apply this method to derive content-specific network visualizations of 16,492 user interactions in an online community for smoking cessation. Performance of the categorization system was reasonable (average F-measure of 0.74, with system-rater reliability approaching rater-rater reliability). The resulting semantically specific network analysis of user interactions reveals content- and behavior-specific network topologies. Implications for socio-behavioral health and wellness platforms are also discussed.
Introduction and Background
In recent years, the penetration of online communities into everyday lives has been astonishing. Researchers have studied these communities using multidisciplinary methods to better understand human health behaviors [1,2]. Qualitative studies have been conducted to characterize (a) different types of social support embedded in forum communication [3], and (b) quality of information being disseminated in social platforms [4]. A significant limitation of the application of qualitative methods to peer interactions in online social media platforms is that these analyses were conducted on small samples of communication on account of the labor and time intensive nature of manual coding required. Voluminous data accumulating through increasing use of Health 2.0 technologies, such as online communities, require methods that are scalable. To this end, machine learning methods have been used to identify specific features of communication within online communities [5–7]. Classification of conversational and informational questions on Yahoo! Answers has also been attempted using a combination of human coding, statistical analysis, and machine learning [8]. Methods of distributional semantics have also been combined with machine learning algorithms to classify consumer health webpages of based on language use patterns [9]. However, these studies ignore the structure of communication (who communicates with whom), which is important to understand peer influence on behavior. Quantitative network modeling has been the most widely used technique to describe and visualize behavioral diffusion, communication structure, and peer influences in social communities [10,11]. However, most of these studies do not consider communication content.
In this paper, we describe a semi-automated method that involves (a) capturing the semantic nuances of communication in an online community using a variant of Latent Semantic Analysis (LSA) [12], and (b) using content-specific classification to reveal structural variations underlying the communication patterns of users of a health-related community. LSA is a distributional semantics method that provides us with the capability to derive relatedness measures between terms from unannotated text. This is accomplished by representing the terms in a high dimensional vector space. The coordinates of a term vector in semantic space are determined by the distributional statistics for this term, such that similar vector representations are created for terms that occur in similar contexts [13]. Evidence suggests that the semantic relatedness measures derived using distributional semantics techniques agree with human estimates, and can be used to obtain human-like performance in a number of cognitive tasks [12,14]. Studies have used LSA to automate the coding of communication content among group members to assess team cognition [15,16], suggesting the applicability of the method for communication analysis at scale. Other studies have also established the utility of other distributional representations for analysis of social media postings [17,18]. In this paper, we apply LSA to the model content and structural patterns underlying user communication in QuitNet, an online social network designed to promote smoking cessation. The paper proceeds as follows: (a) firstly, we present an overview of the materials used in the study, (b) secondly, we describe automated analyses conducted on the QuitNet dataset, (c) thirdly, we conduct network analysis to characterize content-specific user communication patterns in QuitNet, and (d) finally, we conclude the paper with implications of our findings for design of digital health platform that leverage the power of social connections.
Materials and Overview of Methods
QuitNet is one of the first online social networks aiming to promote health behavior change, and has been in continuous existence for the past 14 years. It is widely used, with over 100,000 new registrants per year [19,20]. Previous studies of QuitNet indicated that participation in the online community was strongly correlated with abstinence [21]. Communication among QuitNet members can occur through private email, one-to-one messages in public threaded forums, and public chat rooms. The data set studied in this paper was drawn from a previously studied quality improvement database [19], and is comprised of de-identified messages in the public threaded forums, in which participants post messages and reply directly to each other. A database of 16,492 de-identified public messages from between March 1, 2007 and April 30, 2007 was used in our study. All messages are stripped of identifiers but recoded for ego id (the individual posting the message) and alter id (the individual whose message is being replied to), date and position within the thread.
The main pre-requisite for the semi-automated method described in this paper was the development of an annotated dataset that provides qualitative characterization of QuitNet user communication. Grounded theory based qualitative analysis [22] was conducted to identify QuitNet communication themes, and literature review was subsequently conducted to identify the theoretical roots underlying these themes. Further description of this analysis is beyond the scope of the paper, but additional details can be found here [23]. Here we present a summary of pertinent methodological details and results of the qualitative analysis. An initial subset of 795 messages was coded manually until thematic saturation, utilizing grounded theory techniques - open coding, axial coding, and constant comparison. Messages were classified into 12 themes: ‘Social support’, ‘Cravings’, ‘Traditions’, ‘Quit Obstacles’, ‘Teachable Moments’, ‘Quit Readiness’, ‘Conflict’, ‘Relapse’, ‘Quit Progress’, Family and Friends’, ‘Virtual Rewards’, and ‘Pharmacotherapy’.
In the current work, distributional semantics and machine learning were used to associate unannotated messages with communication themes from this qualitative analysis. The complete dataset was then further analyzed using network description and modeling packages, to understand theme-specific structural patterns of user interactions. In the following sections, we present the methodological details and subsequent results of the automated text analysis (Step One) and network modeling studies (Step Two) in the context of QuitNet.
Step One: Automated Text Analysis of QuitNet Communication
The methods of automated text analysis we have employed infer measures of the relatedness between passages of text from the distributional statistics of terms in a large text corpus. Based on our previous work [24], we concluded that the distributional information in our QuitNet corpus was insufficient for the automated derivation of meaningful measures of semantic relatedness between terms. Therefore, we drew on distributional information from the Touchstone Applied Science Associated (TASA) corpus [25], a collection of 37,657 articles designed to approximate the average reading of an American college freshman. We used LSA [14] to derive vector representations of terms in the TASA corpus, such that terms with similar distributions would have similar vector representations, with similarity between vectors measured using the cosine metric. This corpus has been widely used in distributional semantics research, and when applied to this corpus LSA has been shown to approximate human performance on a number of cognitive tasks [12]. LSA was performed using the open source Semantic Vectors package [26]. The log-entropy weighting metric was used, and terms occurring on the stopword list distributed with the General Text Parser software package [27] were ignored. This stopword list consists of frequently occurring terms that carry little semantic content.
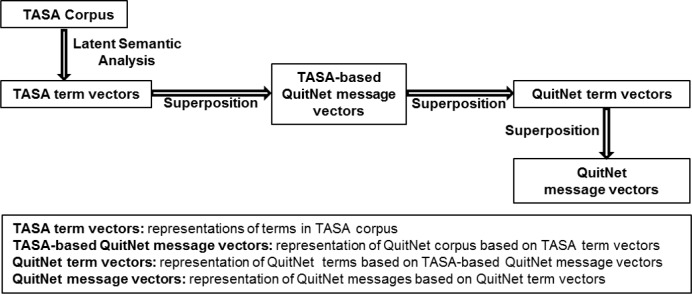
Subsequently, representations of the messages in the QuitNet corpus were generated by adding the vectors for the terms they contain, and normalizing the resulting message vectors (we will refer to these vectors as TASA-based QuitNet message vectors). Representations for terms in the QuitNet corpus were then generated by adding the message vectors for each message they occurred in, and normalizing the resulting vector. Subsequently, a second set of message vectors was generated, which we term QuitNet message vectors. A pictorial depiction of the vector generation is presented in Figure 1. We utilized this approach in order to ensure that terms present in the QuitNet corpus, but not in the TASA corpus, could obtain meaningful vector representations on account of their having similar distributions to terms in this corpus that did occur in the TASA corpus. This approach is similar in nature to the reflective approach that we have utilized previously to infer associations between terms that do not co-occur directly [28], and provides a convenient means to combine distributional information from two disparate corpora (TASA and QuitNet in our case).
Figure 1.
Vector generation sequence for QuitNet semantic analysis
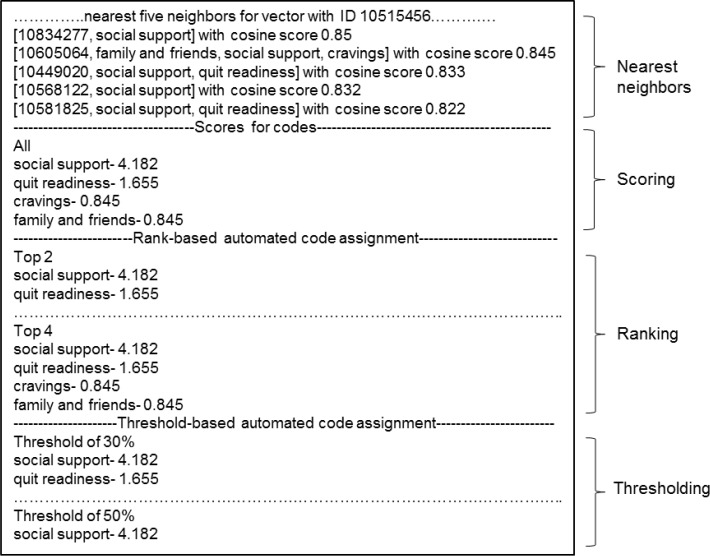
Inspection of the nearest neighbors of key terms from the QuitNet corpus revealed that the measurements of semantic relatedness derived using this approach were intuitive and readily interpretable. In order to use these generated vectors to support automated coding of QuitNet messages, we used a k-nearest neighbors (kNN) approach. For each message, the system provided a ranked list of codes based on pre-assigned manual codes to the nearest neighbors. The score for a particular code was obtained by adding the cosine measures of the nearest neighbors corresponding to that code. The cosine measure represents the relatedness of the message to its nearest neighbor. All of the coded messages other than the message in question were considered (leave one out cross-validation). Figure 2 illustrates the scoring procedure for each theme. As shown in the figure, the five nearest neighbors to message 10515456 were retrieved. For each of themes, a score was calculated by adding up the cosine values of the nearest neighbors to which the theme was attached. For instance, the score for ‘Quit Readiness’ was obtained by adding the cosine scores of the nearest neighbors (10449020 and 10581825). These scores were used in the next stages to fine-tune the system for accuracy and reliability as explained in the next section of the paper.
Figure 2.
Overview of the scoring and optimization procedures used for automated classification system
All: list of all the codes that the system assigned to the message in question, Top 2: ranking cut-off that retains the codes with the top 2 highest scores, Top 4: ranking cut-off that retains the codes with the top 4 highest scores, Threshold of 30%: cutoff based on association strength that retains the codes with scores greater than 30 percent of the highest score, Threshold of 50%: cutoff based on association strength that retains the codes with scores greater than 50 percent of the highest score.
Experimental Setup
Using the LSA technique described in the methods section, vectors representing all of the messages in our QuitNet dataset were generated. We then conducted three experiments to evaluate the extent to which these vector representations could be used to accomplish the automated analysis as explained below.
Experiment 1: Evaluation of the system accuracy
Methods: The 790 manually coded messages were again coded by the automated classification system. The system returns a scored list of codes for each message (see Figure 3). However, many messages are coded with a small number of codes. So some cutoff point is required for meaningful evaluation. In the preliminary experiment we used ranking as a cutoff, but subsequently based the cutoff on association strength. In the ranking-based code assignment, we had the system rank the codes at multiple levels (e.g. top 2, top 4) as seen in Figure 3. Threshold-based cutoffs were also tested at various levels of the association strength. For instance, at 30% threshold only the codes with a score greater than 30% of the highest score were retained. As shown in Figure 3, when a 30% threshold was applied, codes with score greater than 0.3*highest score (0.3*4.182=1.255, ‘Social support’, ‘Quit Readiness’) were retained. The recall and precision of the system in assigning thematic codes was calculated at various levels of threshold and ranking. Based on error analysis, messages with low-level codes “miscellaneous” and “game” were excluded from the dataset because the message content is not amenable to content-based analysis. The code “game” was assigned to those posts where QuitNet members play a word association game with each other to engage themselves in an activity to curb the cravings. However, single word postings such as this cannot be dealt with by the system effectively as individual message content does not provide sufficient semantic context to interpret the purpose of these words. Similarly, messages that were coded as “miscellaneous” were also excluded because the content does not relate to any of the smoking cessation related themes. The experiment was then repeated with the dataset excluding the messages that belong to the “miscellaneous”, and “game” categories, leaving 533 messages.
Figure 3.
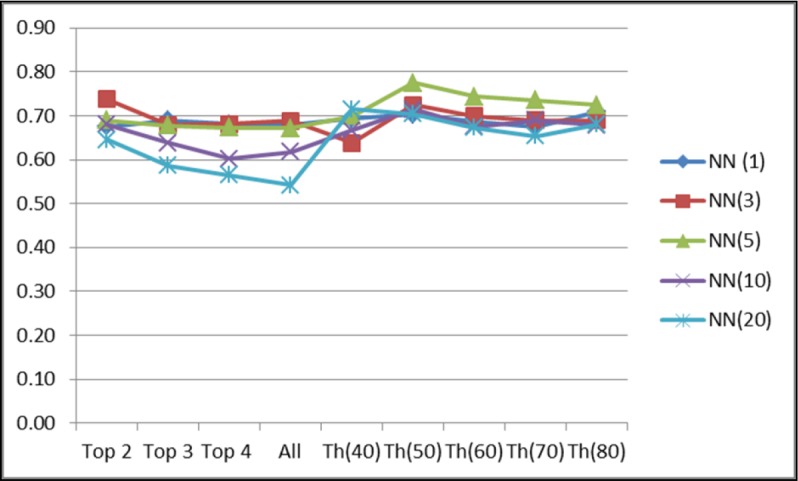
Automated classification system accuracy (F-measure) at a Threshold of 50%
Top X (X=2, 3, 4) indicates the ranking-based cutoff, Th(Y), Y=40%-80% indicates association strength based threshold, NN (Z) (Z=1, 3, 5, 10, 20) indicates the number of nearest neighbors retrieved by the system to formulate scores for code assignment.
Results
The graph in Figure 3 provides the optimum F-measure estimating system accuracy. The average recall and precision were calculated to be at 0.77 and 0.71 respectively for the themes when considering 5-nearest neighbors at a threshold of 50%. The F-measure was found to be 0.74 in this case.
Experiment 2: Evaluation of the system reliability
Methods: A separate dataset of 100 messages was coded by two researchers using the themes that emerged from the grounded theory analysis. The same data set was fed to the automated classification system that was optimized for better accuracy in the previous experiment. The system assigned themes to these 100 messages which were then used to calculate human-system reliability using Cohen’s Kappa measure.
Results: The inter-rater reliability was calculated be 0.83, and the system-rater reliability was averaged at 0.77. Surprisingly, results indicated that the system agreed better with second coder, who coded just these 100 messages, than with the coder of the initial 790 messages upon which the system was trained.
Conclusion: The reliability measures obtained in this experiment indicate that the average agreement of the system with human raters for QuitNet themes approached the agreement between human coders.
Experiment 3: Incorporation of outside semantic information
Methods: Initially, LSA was performed on QuitNet corpus directly to generate message vector representations without TASA pre-training. Then, the vector generation process outlined in Figure 1 was utilized to generate QuitNet message vectors with TASA pre-training. The reflective nature of the method shown in Figure 1 ensures that terms present in the QuitNet corpus, but not in the TASA corpus, would obtain meaningful vector representations. Then, kNN was applied to both the QuitNet vector representations with and without TASA-pre-training separately. F-measures were used to compare the effect of incorporation of TASA corpus to derive QuitNet message vector representations.
Results: Using kNN (k=5) without and with TASA pre-training, the F-measures were calculated to be is 0.53 and 0.74 respectively. Table 1 shows the effects of incorporating TASA on the nearest neighbors of the term “craving”.
Table 1.
Most closely related terms to term “craving”.
| Without TASA | little; him; update; came; ever; stayed; gone; still |
| With TASA | cigarette; nicotine; crave; craves; smoker; habit; chantix; cig |
Conclusion: The accuracy measures obtained in this experiment emphasize the importance of the incorporation of external world knowledge when analyzing social media interactions to negotiate issues with lack of semantic context on account of terse text and community-specific jargon.
Step Two: Large scale theme-specific network analysis of QuitNet communication
Methods: Our entire database of QuitNet messages, consisting of 16,492 messages, was processed by the automated classification system described in previous sections of the paper. The computer-annotated QuitNet data were then used to create theme-specific networks, amenable to analysis using traditional (structural) network analytics to understand theme-specific patterns of social dynamics. The users of QuitNet were classified into five mutually-exclusive classes based on their self-reported abstinence.
Class 1: users who have remained abstinent throughout the study period
Class 2: users who were active smokers throughout the study period
Class 3: users who have relapsed (ex-smoker → active smoker) during the study period
Class 4: users who have successfully quit smoking (active smoker → ex-smoker) during the study period
Class 5: users who have relapsed multiple times during the study period.
Theme-specific network models of the QuitNet data were created by representing users as nodes, and their communication as edges. For each theme-specific network, only edges representing messages annotated with this theme were included. Gephi, an open-source network analysis and visualization software package [29] was used to visualize and analyze these network models. Differences in network structure across themes for multiple user classes were examined using social network metrics [11] that explain node importance within a network (centrality metrics) and network connectedness (network cohesion metrics). Definitions of the metrics used in this study are provided below [11].
Degree (or connectivity): The degree of a node is defined as the number of edges incident with the node. If the graph is directed, the degree of the node has two components: the number of outgoing links (referred to as the out-degree of the node), and the number of ingoing links (referred to as the in-degree of the node)
Density: The proportion of direct ties in a network relative to the total number possible
Path length: The minimum number of ties required to connect two particular actors, as popularized by Milgram’s famous ‘six degrees of separation’ small-world experiment [30].
Cluster: A group of nodes, each of which is connected to at least one other node in the group.
Modularity: It is defined as the number of edges falling within groups minus the expected number in an equivalent network with edges placed at random, and therefore can be considered as a measure of the cohesiveness of communities within the network.
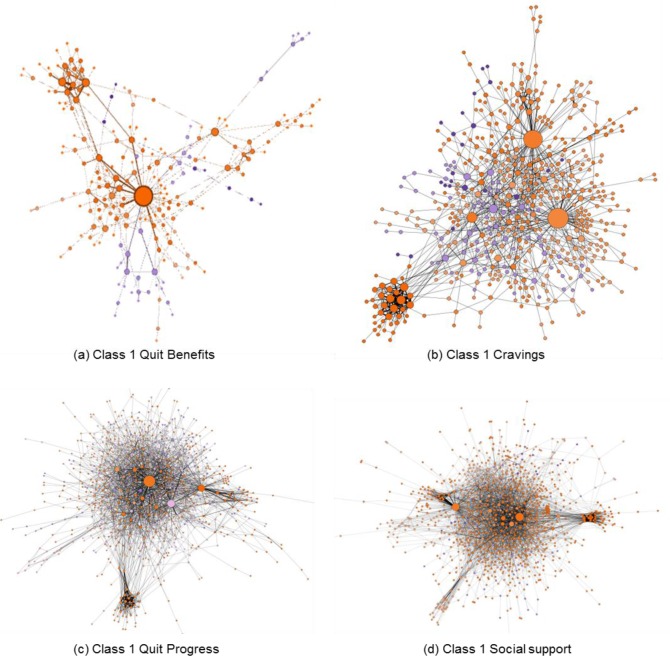
Results: Inclusive of all themes, QuitNet user communication network of Class 1 is the largest with network diameter of 10, comprising of 1204 nodes and 6093 edges. It is the most connected network, with average degree of 10.121. Class 2 is the second largest network of QuitNet users, with network diameter of 9, comprising of 732 nodes and 1696 edges. It is also the second-most connected network, with average degree of 4.634. However, the Class 2 network has the lowest density (0.006) of all, meaning that the connections constitute a tiny fraction of all potential connections that could be formed in this network. For illustration purposes, Figure 4 presents four content-specific network topologies for Class 1 (abstinent) QuitNet users (same color nodes implies clustering into a sub community, orange indicates a low modularity sub community, purple indicates a high modularity sub community, and node size indicates degree). As can be seen in the figure, network formations based on ‘Social support’ and ‘Quit Progress’ are populous and have higher average degree (7.42, 5.3) compared to ‘Quit Benefits’ and ‘Cravings’ (2.86, 3.42) respectively. This indicates that this group of ex-smokers mostly focused their communication with peers on content related to exchange of social support and monitoring their quit progress, reflecting on how far each of them have come in their efforts to quit smoking. However, modularity of networks specific to ‘Social support’ (0.54) and ‘Quit Progress’ (0.52) was lower compared to ‘Quit Benefits’ (0.67) and ‘Cravings’ (0.65), which indicated the sub communities of users exchanging information about benefits and cravings were strongly connected among themselves in comparison with the rest of the network. On the other hand, the average path length in ‘Social support’ (3.4) and ‘Quit Progress’ (3.6) networks is lower when compared to average path length in ‘Quit Benefits’ (4.4) and ‘Cravings’-related networks (4.1), which implies faster dissemination of the former content types.
Figure 4.
Content-specific network representations of communication involving Class 1 QuitNet users
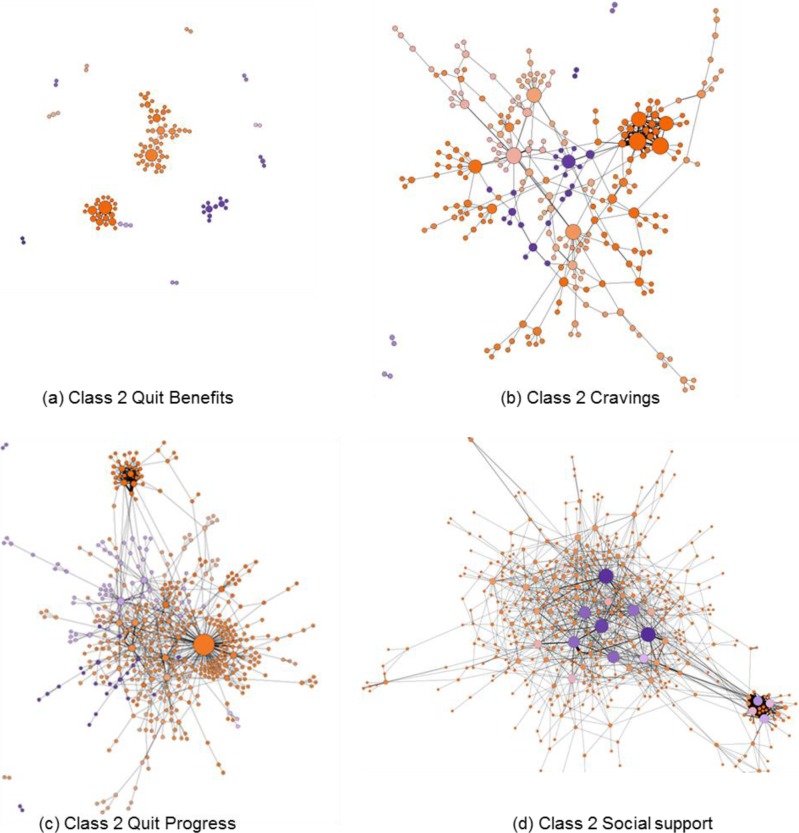
Similarly, Figure 5 presents the content-specific network formations of Class 2 users (active smokers). Unlike the Class 1 ‘Social support’ network, where the high-degree users cluster within a single sub-community, the majority of Class 2 high-degree users within the social support network formed a separate modularity cluster to the rest of the QuitNet users. Further, the ‘purple’ nodes revealed that the ties among high-degree users in Class 2 ‘Social support’ were stronger amongst themselves when compared with their ties with the rest of the nodes in the network. The average path length across all content types was approximately equal at 4.05, except for in the ‘Cravings’ network which at 5.3 is higher than this path length for Class 1 users indicating lower efficiency in information dissemination. Among all content types indicated in Figure 5, the ‘Quit Benefits’ network of active smokers had highest number of isolates and least number of nodes, making it the sparsest and least effective network.
Figure 5.
Content-specific network representations of communication involving Class 2 QuitNet users
Figure 6 presents network formations involving QuitNet users who have relapsed (Class 3) and were successful quitters (Class 4) during the study period. Interactions involving Class 3 users resulted in a network with diameter of 6 comprising of 116 nodes and 111 edges. It is the least connected network with average degree of 1.914. In contrast, Class 4 user interactions resulted in a larger network with 456 nodes and 763 edges, with an average degree of 3.346. Content-specific topological analysis of user interactions related to ‘Traditions’ indicated that the Class 4 users formed a single cohesive network with higher modularity (0.68), when compared to Class 3 users exchanging similar content (0.17). This implies that the emergent traditions within QuitNet may play an important role in successful quitting. The same trend of higher modularity among Class 4 QuitNet users was found in the network describing their interactions related to ‘Quit Readiness’ (0.79), however this network had high degree users form the highest modularity sub community (purple color) as compared to the rest of the nodes (orange color).
Figure 6.
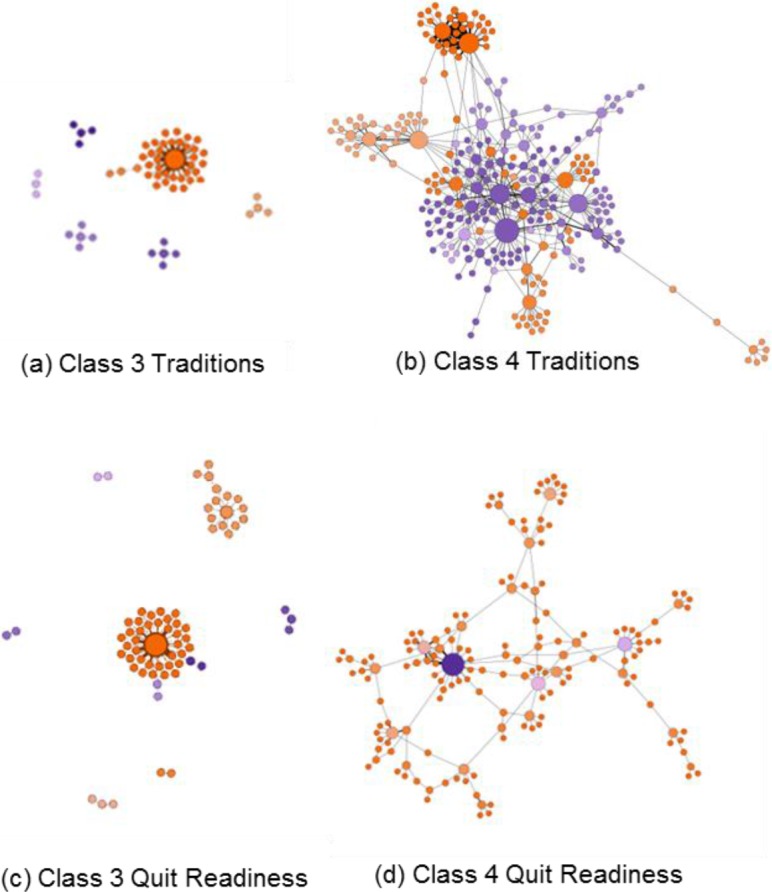
Content-specific network representations of communication involving Class 3 and Class 4 QuitNet users
Limitations and next steps
The automated methods and subsequent network analytics described in this paper were based on qualitative analysis of a small data sample of 795 messages that were coded until thematic saturation. However, it may be the case that the remainder of the dataset contains additional themes that were not captured. The rapid growth of digital technologies will further complicate this issue, as it will generate a data deluge of millions of messages transmitted over the Web and mobile media. The QuitNet dataset considered in our analysis was recorded in 2007. For future studies, we will obtain further data drawn from recent and larger datasets. However, we believe that the findings from the reported data on human behavior are still relevant, as the basic tenet of forum-based communication (structure and logistics) remains the same. In addition, use of recently emerged methods of distributional semantics (e.g. Reflective Random Indexing [28], neural word embeddings [31]) will be considered in our future studies. The network analysis conducted in this paper was limited to description and visualization of user interactions using five metrics. A more extensive approach toward network analysis could be adopted to identify network motifs [32], integrate social influence models [33,34], and model topological evolution over time [35].
Conclusions and Discussions
This paper describes two studies which focus on the analysis of online social network communication using automated text analysis methods from distributional semantics and network analysis for describing content-specific topology differences. The key contributions of this paper are as follows - 1) it introduces and validates a method to extend qualitative analysis to large datasets; 2) it provides a proof-of-concept for full-scale content-specific network analysis of user interactions in an online health-related community; and 3) it demonstrates the use of automated text analysis methods as a bridge between the qualitative and network components of online social media analysis
Given the voluminous nature of online social network data, it is important to develop automated methods that can address the large quantities of free text data that are available online. While the performance of the automated method is reasonable, the accuracy of the system may be further increased by adopting more sophisticated machine learning algorithms. Importantly, the automated method provides a tractable and intuitive mechanism that facilitates code assignment to all the messages in the dataset, thus enabling qualitative analysis of large datasets. The reflective approach adopted in the automated classification system scales in linear proportion with the size of the dataset and therefore the automated system can be applied to analyze millions of messages exchanged on social media platforms. In addition, incorporation of external semantic information enhances the applicability of distributional models to social medial text analytics. A significant implication of large-scale qualitative analysis of online social media interactions is that it facilitates the inclusion of semantic content into network models of online communities. Content-specific network analysis of QuitNet revealed attributes that describe nodal importance and network cohesion of communication themes across multiple behavioral states related to smoking cessation. In turn, such understanding will allow us to develop user-information interactions that facilitate efficient information dissemination, robust network formation, and targeted support within technology platforms such as QuitNet [24,34,36].
In summary, methods that facilitate automated extension of granular qualitative analyses, and population-level visualization of the results can extend the research and application frontiers of social media, thereby further enhancing their positive impact on health-related behaviors.
Acknowledgments
Research reported in this publication was supported by the National Library of Medicine of the National Institutes of Health under Award Number 1R21LM012271-01. The content is solely the responsibility of the authors and does not necessarily represent the official views of the National Institutes of Health. We are indebted to Tom Landauer for providing us with the TASA corpus, and contributors to the Semantic Vectors open source package, in particular Adrian Kuhn and David Erni, the contributors of the sparse SVD implementation we used for LSA.
References
- 1.Eysenbach G, Powell J, Englesakis M, Rizo C, Stern A. Health related virtual communities and electronic support groups: systematic review of the effects of online peer to peer interactions. BMJ. 2004;328:1166–1170. doi: 10.1136/bmj.328.7449.1166. [DOI] [PMC free article] [PubMed] [Google Scholar]
- 2.Centola D. The spread of behavior in an online social network experiment. Science. 2010;329(5996):1194–97. doi: 10.1126/science.1185231. [DOI] [PubMed] [Google Scholar]
- 3.Chuang K, Yang C. A study of informational support exchanges in medhelp alcoholism community. Social Computing, Behavioral-Cultural Modeling and Prediction. 2012. pp. 9–17.
- 4.Greene JA, Choudhry NK, Kilabu E, Shrank WH. Online social networking by patients with diabetes: a qualitative evaluation of communication with Facebook. JGIM. 2011;26(3):287–92. doi: 10.1007/s11606-010-1526-3. [DOI] [PMC free article] [PubMed] [Google Scholar]
- 5.MacLean DL, Heer J. Identifying medical terms in patient-authored text: a crowdsourcing-based approach. Journal of the American Medical Informatics Association. 2013;20(6):1120–1127. doi: 10.1136/amiajnl-2012-001110. [DOI] [PMC free article] [PubMed] [Google Scholar]
- 6.Chee BW, Berlin R, Schatz B. Predicting adverse drug events from personal health messages; Paper presented at: AMIA Annual Symposium Proceedings; 2011. [PMC free article] [PubMed] [Google Scholar]
- 7.Wang Y-C, Kraut R, Levine JM. To stay or leave?: the relationship of emotional and informational support to commitment in online health support groups; Paper presented at: Proceedings of the ACM 2012 conference on Computer Supported Cooperative Work; 2012. [Google Scholar]
- 8.Harper FM, Moy D, Konstan JA. Facts or friends?: distinguishing informational and conversational questions in social Q&A sites; Paper presented at: Proceedings of the 27th international conference on Human factors in computing systems; 2009. [Google Scholar]
- 9.Chen G, Warren J, Riddle P. Semantic Space models for classification of consumer webpages on metadata attributes. Journal of Biomedical Informatics. 2010;43(5):725–735. doi: 10.1016/j.jbi.2010.06.005. [DOI] [PubMed] [Google Scholar]
- 10.Cobb NK, Graham AL, Byron MJ, Niaura RS, Abrams DB. Online social networks and smoking cessation: a scientific research agenda. J Med Internet Res. 2011;13(4):e119. doi: 10.2196/jmir.1911. [DOI] [PMC free article] [PubMed] [Google Scholar]
- 11.Valente TW. Oxford University Press; 2010. Social networks and health: Models, methods, and applications. [Google Scholar]
- 12.Landauer TK, Dumais ST. A solution to Plato’s problem: The latent semantic analysis theory of acquisition, induction, and representation of knowledge. Psychological Review. 1997;104:211–40. [Google Scholar]
- 13.Cohen T, Widdows D. Empirical distributional semantics: methods and biomedical applications. J Biomed Inform. 2009;42(2):390–405. doi: 10.1016/j.jbi.2009.02.002. [DOI] [PMC free article] [PubMed] [Google Scholar]
- 14.Landauer TK, Laham D, Rehder B, Schreiner ME. How well can passage meaning be derived without using word order? A comparison of latent semantic analysis and humans. Proceedings of the Nineteenth Annual Conference of the Cognitive Science Society; Stanford University.1997. Aug 7–10, [Google Scholar]
- 15.Kiekel PA, Cooke NJ, Foltz PW, Gorman JC, Martin MJ. Some promising results of communication-based automatic measures of team cognition. HFES Annual Meeting. 2002;46(3):298–302. [Google Scholar]
- 16.Gorman JC, Foltz PW, Kiekel PA, Martin MJ, Cooke NJ. Evaluation of Latent Semantic Analysis-based measures of team communications content; In Proceedings of the Human Factors and Ergonomics Society annual meeting; 2003. pp. 424–428. [Google Scholar]
- 17.McArthur R, Bruza P, Warren J, Kralik D. Projecting computational sense of self: a study of transition in a chronic illness online community. System sciences. 2006;5:91. [Google Scholar]
- 18.Elhadad N, Zhang S, Driscoll P, Brody S. Characterizing the Sublanguage of Online Breast Cancer Forums for Medications, Symptoms and Emotions; Proceedings of the AMIA Annual Symposium; Washington, DC. 2014. [PMC free article] [PubMed] [Google Scholar]
- 19.Cobb NK, Graham AL, Abrams DB. Social network structure of a large online community for smoking cessation. American Journal of Public Health. 2010;100(7):1282–9. doi: 10.2105/AJPH.2009.165449. [DOI] [PMC free article] [PubMed] [Google Scholar]
- 20.Cobb NK, Graham AL, Bock BC, Papandonatos G, Abrams DB. Initial evaluation of a real-world Internet smoking cessation system. Nicotine Tob Res. 2005;7(2):207–216. doi: 10.1080/14622200500055319. [DOI] [PMC free article] [PubMed] [Google Scholar]
- 21.Graham AL, Cobb NK, Raymond L, Sill S, Young J. Effectiveness of an internet-based worksite smoking cessation intervention at 12 months. Journal of Occupational and Environmental Medicine. 2007;49(8):821. doi: 10.1097/JOM.0b013e3180d09e6f. [DOI] [PubMed] [Google Scholar]
- 22.Strauss A, Corbin J. NewburyPark, London: Sage; 1990. Basics of Qualitative Research: Grounded Theory Procedure and Techniques. [Google Scholar]
- 23.Myneni S, Cobb N, Cohen T. In Pursuit of Theoretical Ground in Behavior Change Support Systems: Analysis of Peer-to-Peer Communication in a Health-Related Online Community. JMIR. 2016;18(2):e28. doi: 10.2196/jmir.4671. [DOI] [PMC free article] [PubMed] [Google Scholar]
- 24.Myneni S, Cobb NK, Cohen T. Finding Meaning in Social Media: Content-based Social Network Analysis of QuitNet to Identify New Opportunities for Health Promotion. Studies in health technology and informatics. 2012;192:807–811. [PubMed] [Google Scholar]
- 25.Landauer TK, Foltz PW, Laham D. An introduction to latent semantic analysis. Discourse Processes. 1998;25:259–284. [Google Scholar]
- 26.Widdows D, Cohen T. The Semantic Vectors Package: New Algorithms and Public Tools for Distributional Semantics; Fourth IEEE International Conference on Semantic Computing (IEEE ICSC); 2010. pp. 9–15. [Google Scholar]
- 27.Giles J, Wo L, Berry M. GTP (general text parser) software for text mining. In: Bozdogan H, editor. Software for text mining in statistical data mining and knowledge discovery. Boca Raton, FL: CRC Press; 2003. pp. 455–71. [Google Scholar]
- 28.Cohen T, Schvaneveldt R, Widdows D. Reflective Random Indexing and indirect inference: A scalable method for discovery of implicit connections. Journal of Biomedical Informatics. 2010;43(2):240–56. doi: 10.1016/j.jbi.2009.09.003. [DOI] [PubMed] [Google Scholar]
- 29.Bastian M, Heymann S, Jacomy M. Gephi: an open source software for exploring and manipulating networks. ICWSM. 2009 May 17;8:361–2. [Google Scholar]
- 30.Milgram S. The small world problem. Psychology today. 1967 May 3;2(1):60–7. [Google Scholar]
- 31.Mikolov T, Sutskever I, Chen K, Corrado G, Dean J. Distributed representations of words and phrases and their compositionality; In Advances in Neural Information Processing Systems 26: 27th Annual Conference on Neural Information Processing Systems; Lake Tahoe, Nevada, United States. 2013. pp. 3111–3119. [Google Scholar]
- 32.Milo R, Shen-Orr S, Itzkovitz S, Kashtan N, Chklovskii D, Alon U. Network motifs: simple building blocks of complex networks. Science. 2002 Oct.298(5594):824–7. doi: 10.1126/science.298.5594.824. [DOI] [PubMed] [Google Scholar]
- 33.Carrington PJ, Scott J, Wasserman S, editors. Cambridge university press; 2005. Feb. Models and methods in social network analysis. [Google Scholar]
- 34.Myneni S, Fujimoto K, Cobb N, Cohen T. Content-Driven Analysis of an Online Community for Smoking Cessation: Integration of Qualitative Techniques, Automated Text Analysis, and Affiliation Networks. American journal of public health. 2015 Jun.105(6):1206–12. doi: 10.2105/AJPH.2014.302464. [DOI] [PMC free article] [PubMed] [Google Scholar]
- 35.Tang J, Musolesi M, Mascolo C, Latora V. Temporal distance metrics for social network analysis. In Proceedings of the 2nd ACM workshop on Online social networks; ACM; 2009. Aug. pp. 31–36. [Google Scholar]
- 36.Valente TW. Network interventions. Science. 2012 Jul.337(6090):49–53. doi: 10.1126/science.1217330. [DOI] [PubMed] [Google Scholar]


