Abstract
Diffusion MRI provides unique information on the structure, organization, and integrity of the myocardium without the need for exogenous contrast agents. Diffusion MRI in the heart, however, has proven technically challenging because of the intrinsic non‐rigid deformation during the cardiac cycle, displacement of the myocardium due to respiratory motion, signal inhomogeneity within the thorax, and short transverse relaxation times. Recently developed accelerated diffusion‐weighted MR acquisition sequences combined with advanced post‐processing techniques have improved the accuracy and efficiency of diffusion MRI in the myocardium. In this review, we describe the solutions and approaches that have been developed to enable diffusion MRI of the heart in vivo, including a dual‐gated stimulated echo approach, a velocity‐ (M 1) or an acceleration‐ (M 2) compensated pulsed gradient spin echo approach, and the use of principal component analysis filtering. The structure of the myocardium and the application of these techniques in ischemic heart disease are also briefly reviewed. The advent of clinical MR systems with stronger gradients will likely facilitate the translation of cardiac diffusion MRI into clinical use. The addition of diffusion MRI to the well‐established set of cardiovascular imaging techniques should lead to new and complementary approaches for the diagnosis and evaluation of patients with heart disease. © 2015 The Authors. NMR in Biomedicine published by John Wiley & Sons Ltd.
Keywords: MRI, diffusion, tensor, tractography, heart, myocardium, myofiber architecture, ischemia
Abbreviations used
- ADC
apparent diffusion coefficient
- BMMC
bone‐marrow mononuclear cell
- bSSFP
balanced steady‐state free precession
- CAIPI
controlled aliasing in parallel acquisition
- D‐PGSE
double‐PGSE
- DSI
diffusion spectrum imaging
- DTI
diffusion tensor MRI
- DW‐DE
diffusion‐weighted driven equilibrium
- DWI
diffusion‐weighted imaging
- ECG
electrocardiogram
- EPI
echo planar imaging
- FA
fractional anisotropy
- FID
free‐induction decay
- GRAPPA
generalized autocalibrating partially parallel acquisitions
- HA
helix angle
- HARDI
high‐angular‐resolution diffusion imaging
- IR
ischemia–reperfusion
- IVIM
intra‐voxel incoherent motion
- LV
left ventricle
- M1
first moment of motion, velocity
- M2
second moment of motion, acceleration
- MD
mean diffusivity
- PCA
principal component analysis
- PGSE
pulsed gradient spin echo
- ROI
region of interest
- SENSE
sensitivity encoding
- SIR
simultaneous image refocusing
- SNR
signal‐to‐noise ratio
- STE
stimulated echo
- TCI
tractographic coherence index
- TD
trigger delay
- TM
mixing time
- TMIP
temporal maximum intensity projection
- TRSE
twice‐refocused spin echo
- TSE
turbo spin echo
Introduction
Diffusion MRI of the heart was first described in a landmark study just over 20 years ago 1. During this time the excellent work of many groups has illuminated both the significant potential and major challenges of transforming the technique from a sophisticated research tool into a routine component of clinical care. While many of the issues facing diffusion tensor MRI (DTI) in the brain apply to the heart as well, several specific challenges are present. Nevertheless, DTI of the heart is nearing its tipping point, where solutions to most of the relevant technical challenges have been developed. In this review, we describe the technical challenges that complicate the use of DTI in the heart, discuss the solutions and approaches that have been developed to address them, and briefly review the application of diffusion MRI in ischemic heart disease.
The primary difference between DTI of the heart and the brain lies in the need to take non‐rigid deformation and displacement of the myocardium into account 2, 3. Second, the transverse relaxation rate (T 2) of the myocardium is significantly shorter than it is in the brain (~40 ms in the myocardium at 3 T compared with ~80 ms in brain white matter) 4, 5, 6, 7, which imposes significant limitations on the echo time (T E) that can be used. Third, the increased B 0 inhomogeneity within the thorax also results in more susceptibility‐related distortions in echo planar imaging (EPI) of the heart. B 1 inhomogeneity in the thorax, particularly at higher fields, can also affect the refocusing schemes of diffusion‐weighted sequences. Approaches to overcome these challenges have been developed and have benefitted significantly from the development of multi‐element receive coil arrays and parallel acquisition techniques such as SENSE (sensitivity encoding) and GRAPPA (generalized autocalibrating partially parallel acquisitions).
Diffusion‐weighted imaging (DWI) plays an important role in the diagnosis of acute neurological injury 8, and could play a similar role in the heart. Changes in the surface electrocardiogram (ECG) and serological biomarkers are not always diagnostic, and changes in the diffusivity of water in the myocardium correlate strongly with the area at risk 9. The use of diffusion MRI to diagnose subacute and chronic infarction 9, 10, 11, 12 is even more likely to be extremely useful, particularly in those unable to be injected with gadolinium due to renal dysfunction. The greatest utility of diffusion MRI in the heart, however, lies in its ability to elucidate the fiber architecture of the myocardium 13, and hence the microstructural basis of a broad range of cardiovascular diseases.
The general principles of diffusion MRI are well established and have been reviewed elsewhere 14, 15, 16, 17. In the context of the current review, however, several points merit brief discussion. The derivation of the dyadic diffusion tensor requires a minimum of six linearly independent diffusion‐encoding directions to be used. Work in the brain, however, has shown that over‐specifying the tensor with 32 or more directions is preferable to performing several averages with six directions 18. A similar analysis has not yet been performed in the heart in vivo, in part due to the long scan duration produced by a high number of diffusion‐encoding directions. In practice, DTI of the human heart in vivo is commonly performed with up to 16 diffusion‐encoding directions and several averages to increase signal‐to‐noise ratio (SNR). Prior to averaging, spatiotemporal registration techniques are required to mitigate smoothing and partial volume artifacts arising from differences in the position of the heart during each acquisition.
The myocardium is highly anisotropic and well suited to characterization with DTI 19. The most widely used measure of fiber organization in the myocardium is the helix angle (HA). HA is defined by the angle between the local radial plane and the projection of the primary eigenvector onto the plane tangent to the radial plane 20. In other words, HA can be defined by the inclination of the myofiber out of the local short‐axis plane (Fig. 1) 21. The fibers in the left ventricle span an HA range of approximately 120° from endocardium to epicardium, forming an array of crossing helices (Fig. 1) 21. Fibers in the papillary muscles and subendocardial trabeculations can have even higher HA and be oriented in a fairly longitudinal manner (Fig. 2) 22. It should be noted that the myocardium has no radially oriented fibers, despite this being the predominant direction of myocardial strain (Fig. 2). Early investigations have shown that myofibers are organized as sheets 23, 24. The secondary and tertiary eigenvectors derived from DTI, the sheet‐parallel and sheet‐normal vectors respectively, have the ability to interrogate myocardial sheet structure 25, 26. This underscores the complex interplay between structure and function in the myocardium 25, and motivates the need to develop sequences and techniques that characterize the microstructure of the heart accurately.
Figure 1.
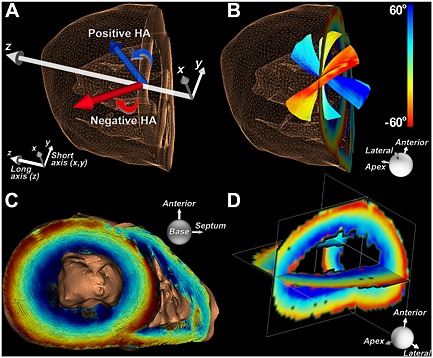
Representation of fibers in the heart based on their HA, which reflects the inclination of the fiber out of the local radial or short‐axis plane. (A) In the lateral wall of the left ventricle, fibers with a positive HA course from postero‐base to antero‐apex, while those with a negative HA course from antero‐base to postero‐apex. (B) Fibers in the subendocardium have a positive HA, those in the subepicardium have a negative HA, and fibers in the midmyocardium are circumferential. (C) 3D view (base to apex) of a normal human heart with the myofiber tracts color coded by HA. (D) Orthogonal multi‐planar view of HA in the left ventricle. The use of HA to classify myofibers in the heart is more informative than use of the standard Cartesian coordinate system. Reproduced with permission 21.
Figure 2.

Myofibers in the heart form an array of crossing helices. Fiber tracts in a rat heart, created by sweeping a small spherical region of interest (ROI) across the myocardium, are shown. The heart is viewed (A–E) from the apex and (F–J) from its lateral aspect. The papillary muscles and endocardial trabeculations can contain highly longitudinal myofibers with an absolute HA > 60°. The fibers from the subendocardium to the subepicardium span a range of approximately 120° in most mammals. Reproduced with permission 22.
Sequences and approaches
Ex vivo imaging
Diffusion MRI of the heart ex vivo removes many of the technical challenges described above, but requires methodical preparation of the harvested heart. The phase in the cardiac cycle at which arrest occurred and the method/duration of fixation will significantly impact image quality and experimental results 27, 28. Additionally, the elimination of blood and air from the specimen is extremely important. Imaging should ideally be performed with the heart placed in a magnetic‐susceptibility‐matching medium with no detectable proton signal 21, 22. This minimizes artifacts at tissue–fluid interfaces and adjusts the dynamic range of the receive chain to the signal originating solely from the specimen.
The sequence most frequently used to image the heart ex vivo is the classic pulsed gradient spin echo (PGSE) or Stejskal–Tanner sequence (Fig. 3) 13. This employs two monopolar diffusion‐encoding gradient pulses on either side of a 180° refocusing pulse to create diffusion contrast, followed by a single‐shot EPI readout. The symmetric nature of the diffusion‐encoding gradients about the refocusing pulse eliminates concomitant gradients (Maxwell terms). Most of the concomitant terms scale with G 2/B 0 29, and thus can be an issue in ex vivo imaging where very strong gradients are used.
Figure 3.
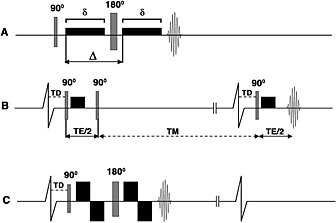
Pulse sequences used for diffusion imaging of the myocardium. (A) PGSE or Stejskal–Tanner sequence; (B) dual‐gated STE sequence; (C) velocity‐compensated PGSE sequence. The diffusion‐encoding gradients are represented by the black rectangles (rise time is ignored), δ is the duration of the diffusion‐encoding gradient and ∆ represents the time between diffusion gradients. Single‐shot EPI readouts are used in all cases. (A) PGSE sequence with diffusion‐encoding gradients on either side of the 180° refocusing pulse. The sequence is highly sensitive to motion and has a relatively long T E. (B) Diffusion‐encoded STE sequence. The diffusion time is equal to T E/2 plus the mixing time (T M) and is equal to the RR interval. (The vertical lines breaking the baseline of the ECG indicate that the timeline is not drawn to scale.) (C) Velocity‐compensated PGSE sequence with bipolar diffusion‐encoding gradients on either side of the 180° refocusing pulse. Implementation of this sequence in vivo is feasible with ultra‐high gradient strengths, which allow δ and T E to be kept acceptably short. Reproduced with permission 13.
The diffusion gradients in the PGSE sequence typically produce long‐time‐constant eddy currents, which often cause significant image distortion 30. An asymmetric twice‐refocused version of the PGSE sequence is therefore widely used in clinical imaging to mitigate the effects of eddy currents at the cost of a slightly longer T E 31. In the heart, due to the short T 2 of the myocardium, T E is particularly valuable and the cost of lengthening the T E with the twice‐refocused sequence could offset any advantage obtained.
In vivo imaging
The PGSE approach used for ex vivo imaging is not suited to in vivo imaging due to its intrinsic motion sensitivity. Alternative approaches are thus needed, and three broad strategies have been demonstrated to date: (i) a dual‐gated stimulated echo (STE) approach 3, (ii) a velocity‐ (M 1) or an acceleration‐ (M 2) compensated PGSE approach 32, 33, and (iii) the use of principal component analysis (PCA) filtering to remove the effects of motion during post‐processing 34. To date, the STE sequence has been the most successful approach since it does not require higher gradients and can be performed on most clinical scanners.
Diffusion‐encoded STE
The diffusion‐encoded STE sequence is played out over two successive heartbeats. The first and second 90° excitation pulses are applied in the first heartbeat, and the third excitation pulse in the second heartbeat 1, 3. The diffusion‐encoding gradients are monopolar and are placed immediately after the first and third excitation pulses (Fig. 3). Like the PGSE sequence, two monopolar diffusion‐encoding gradients are separated by RF pulses equal to 180°. However, several critical differences exist between the sequences. The diffusion encoding time (∆) in the PGSE sequence is mostly a function of the duration (δ) of each monopolar gradient. In the STE sequence, the period between the second and third 90° excitation pulses produces a mixing time (T M) during which substantial diffusion sensitization occurs. T M is fairly long (T M = RR − T E/2), and only a small and very brief diffusion‐encoding gradient is needed to achieve an adequate b‐value with a comparatively short T E 1, 3.
Several additional features render the STE approach well suited to in vivo cardiac imaging. The second 90° excitation pulse flips the magnetization from the transverse plane into the longitudinal plane. Hence, during the mixing time T M, the signal is not exposed to T 2 decay but rather to the far slower process of longitudinal relaxation (T 1). It should be noted, however, that the length of the T M results in a significant loss of signal from T 1 decay, even though the T 1 of the myocardium is well over an order of magnitude longer than its T 2 4, 35, 36. The third RF pulse flips the magnetization back into the transverse plane, where it can be detected. Two coherence pathways are produced by the third 90° RF pulse: the desired STE and the undesired signal from free‐induction decay (FID). The second monopolar diffusion gradient dephases the signal from the FID, thereby eliminating this unwanted signal. However, a true b = 0 s/mm2 (no diffusion encoding) image cannot be obtained with the STE approach, since a small gradient must be applied to crush the FID, even when no diffusion encoding is desired 1, 3.
Using STE, the T E is shorter for a given b‐value, so there is less signal loss from T 2 and T 2* relaxation compared to PGSE. The main appeal of the STE approach is its conditional immunity to cardiac motion, requiring positional stability within each acquisition. The diffusion gradients and RF pulses must occur at exactly the same time in two sequential RR intervals (Fig. 3). Not only is the phase due to the diffusion gradient encoding unwound, but the influence of cardiac motion on the phase of the magnetization is also unwound. This sequence compensates for all forms of translational cardiac motion under two conditions: (i) the trigger delays (TDs) between the preceding R wave and the first and third RF pulses, which are followed by diffusion gradients, must be identical, and (ii) the position of the heart must be matched in the two successive heartbeats. The latter condition is met when the effects of respiration are removed through a breath‐hold, and when cardiac rhythm is regular. However, the STE sequence is sensitive to arrhythmias, particularly when diastolic imaging is performed.
The STE approach has been the mainstay of cardiac DTI for over a decade 10, 11, 37, 38, 39, although there are some clear drawbacks to this approach. First, it is inherently inefficient, requiring two heartbeats to produce a signal. Second, because the refocusing of the initial excitation is divided into two RF pulses that are widely separated in time, refocusing results in loss of half of the signal due to unrecoverable dephasing during T M, compared with spin echo. A straightforward method to adapt the STE sequence to the typical multi‐slice/multi‐phase cardiac acquisition scheme has also yet to be developed. The difficulty with achieving a true b = 0 s/mm2 (no diffusion encoding) image has been described above.
Velocity‐compensated PGSE
The STE approach, while of major value, has several limitations, as described above. The development of an approach to render the PGSE sequence insensitive to cardiac motion is therefore highly appealing. In the standard PGSE sequence, unlike the STE approach, cardiac motion evolves irreversibly during the application of the diffusion gradients. This motion results in additive phase due to imperfect gradient refocusing, and leads to variable diffusion contrast and often the complete loss of signal in the portions of the image where cardiac motion is greatest. The simplest approach for PGSE involves converting the monopolar gradients in the standard sequence to bipolar gradients (Fig. 3) 32, a binomial 1–2′–1 gradient series. This gradient configuration compensates for the first moment of motion (velocity, M 1). For this sequence, the gradient capability significantly affects the attainable T E and hence the SNR. This approach has been shown to be feasible on clinical systems with sufficient (G max ~ 80 mT/m) gradient capability 32, 40.
Improvements in gradient technology have recently made it possible to construct clinical whole body systems with maximal gradient strengths (G max) ranging from 80 to 300 mT/m 41. This has opened up new possibilities in diffusion MRI of the heart. It should be noted that the b‐value, which describes the degree of diffusion contrast achieved, is proportional to δ and has a quadratic dependence on gradient strength. In practice, increasing δ to increase diffusion contrast requires the T E to be approximately doubled, resulting in reduced SNR. In contrast, increasing G max allows high b‐values to be obtained with short δ and an acceptably short T E. Shortening T E in itself compensates for motion, in that the applied gradients are present over a smaller interval of cardiac motion.
Stronger gradients also allow sequence designs that specifically cancel the moments of motion such as velocity and acceleration within an acceptable T E, while increasing efficiency by acquiring data in a single heartbeat. A velocity‐compensated version of the PGSE sequence was first described in 2007 using a 3 T clinical system capable of a G max of 87 mT/m per axis 32. Imaging was performed with a b‐value of 340 s/mm2, spatial resolution of 2.2 × 2.2 × 6 mm3 with fields of view of 290 × 54 mm2 and 290 × 72 mm2 at T E of 61 ms and 65 ms, respectively. More recently, a similar approach was implemented in small animals using a 1500 mT/m gradient (Fig. 4) 9. Recent application of the technique in healthy human volunteers revealed that a true spatial resolution of 2 × 2 × 4 mm3 is possible (Fig. 5) 9, compared with a resolution of 2.7 × 2.7 × 8 mm3, which we have previously used with the STE approach 37. This technique has enabled high‐resolution tractography of the human heart in vivo (Fig. 5). The bipolar PGSE sequence is velocity compensated, but does not compensate for acceleration and higher‐order coefficients of motion. This particular sequence must be employed when velocity is fairly constant, such as at mid‐systole 38, 42.
Figure 4.
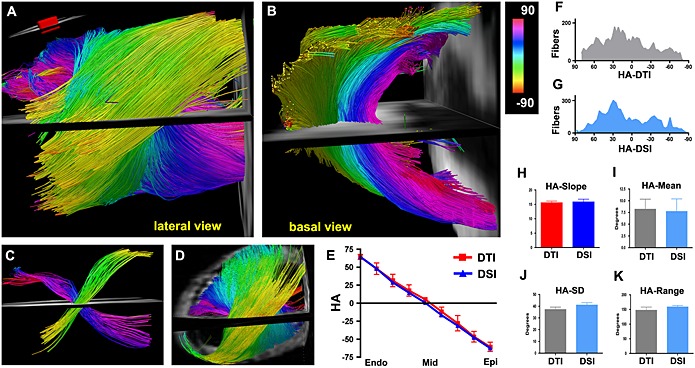
(A, B) DTI‐tractography of a normal mouse heart in vivo, using the velocity‐compensated PGSE approach and a 1500 mT/m gradient system. Fibers passing through an ROI (inset) in the left ventricle (LV) wall are shown (A) from a lateral perspective and (B) from the base. (A–C) The characteristic crossing of the subendocardial (pink to dark blue) and subepicardial (green–yellow) fibers is well resolved with in vivo DTI‐tractography. (D) DSI‐tractography of a mouse heart ex vivo showing the same crossing helical pattern. (E) Plots of HA versus transmural depth in normal mice imaged with in vivo DTI and ex vivo DSI. (F, G) Histograms of myofiber HA in the lateral wall obtained with DTI‐tractography in vivo (F, gray) and DSI‐tractography ex vivo (G, blue). (H–K) No significant differences are present in the transmural slope, mean, standard deviation (SD), or range of myofiber HA between the DSI‐ and in vivo DTI‐tractography datasets. This confirms the accuracy and promise of the velocity‐compensated PGSE sequence. Reproduced with permission 9.
Figure 5.

High‐resolution DTI‐tractography of the human heart in vivo. The images are of a healthy human volunteer imaged with the velocity‐compensated PGSE sequence. (A, B) Coherent tracts with the correct orientation can be resolved in all regions of the myocardium. (Dispersion of HA over the papillary muscles and trabeculations of the LV is a normal finding.) (C) Magnified view of fibers crossing an ROI in the midlateral wall of the LV reveals the characteristic crossing pattern of myofibers in the subendocardium and subepicardium. S, septum; A, apex. The higher SNR of the PGSE sequence enabled a resolution of 2 × 2 × 4 mm3 to be achieved, three times better than the resolution obtained with the STE approach. Reproduced with permission 9.
Acceleration‐compensated sequences
Acceleration compensation (M 1, M 2) in the PGSE sequence requires the addition of a more complicated gradient pulse. The gradient series with the least number of terms that is velocity and acceleration compensated is a 1–3′–3–1′ series. This more complicated gradient shape increases the T E for the same b‐value. However, recent results suggest that the benefits of a 1–3′–3–1′ PGSE gradient scheme offset the penalty of a longer T E 40, 43, 44.
Recently, an alternate approach has been demonstrated to obtain M 2‐compensated diffusion‐weighted images in the presence of cardiac motion. Rather than using the PGSE sequence, the readout of the data is accomplished using a segmented balanced steady‐state free precession (bSSFP) sequence or turbo spin echo (TSE) readout (Fig. 6) 12, 33. Diffusion sensitization results from a diffusion‐weighted driven‐equilibrium (DW‐DE) preparation sequence 45, using a twice‐refocused spin echo (TRSE) sequence 31. In the TRSE preparation phase, four bipolar gradient pulses and two refocusing pulses are combined to yield a 1–2′–1–1′–2–1′ gradient series, which, like the 1–3′–3–1′ series, compensates for all moments up through acceleration. Following the preparation series, the refocused transverse magnetization is tipped into the longitudinal axis, and any residual transverse magnetization is dephased by a crusher gradient. Hence, the TRSE preparation changes the amplitude of the longitudinal magnetization (M 0) according to the local diffusion sensitivity and has no residual phase, permitting the use of an ECG‐gated segmented readout 12, 33. The lengthy TRSE preparation sequence, when combined with a multi‐shot readout, makes the sequence quite time consuming. To date, it has only been performed with three diffusion‐encoding directions on a clinical MR scanner 12, 33. However, it holds significant promise and will likely reach its full potential when implemented on high‐performing gradient systems.
Figure 6.
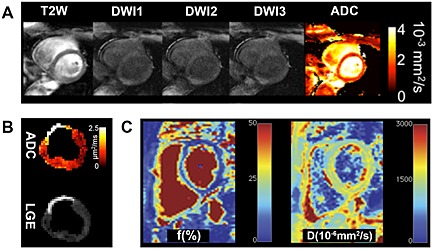
Alternative diffusion MRI‐based approaches that compensate for the motion of the heart. (A) Application of the DW‐DE bSSFP sequence on a normal human heart 33. The T 2‐weighted (b = 0 s/mm2) image contains no diffusion contrast. Thereafter, images are acquired with diffusion encoding in three directions, which allows the apparent diffusion coefficient (ADC) to be calculated. (B) Application of the DW‐DE TSE approach on a pig with an 8‐week‐old transmural myocardial infarction 12. The increase in the ADC corresponds to the area of late gadolinium enhancement (LGE). Both A and B are derived from a DW‐DE approach compensated for both the first (M 1) and second (M 2) moments of motion. (C) The measurement of diffusion in the heart with the IVIM approach 34. This allows the percentage of the vascular compartment (f) in the heart to be measured and diffusion in the extravascular space to be separated from diffusion in the intravascular space. The IVIM images shown were acquired with the PCATMIP technique, where a PCA filtering approach is used to remove the effects of motion. Reproduced with permission 12, 33, 34.
PGSE with PCA
The techniques described above all compensate for the effects of cardiac motion during image acquisition. Recently, a post‐processing approach has been proposed to remove the effects of motion from diffusion‐weighted images 34. During acquisition, a time window during which bulk cardiac motion is minimal is identified. A number of diffusion‐encoded images are acquired during this time window under free‐breathing conditions with bulk physiological motion corrected for by using non‐rigid registration. Principal component analysis (PCA) is then performed on the registered images to improve the SNR, and a temporal maximum intensity projection (TMIP) approach is applied to recover signal intensity from time‐fluctuant motion‐induced signal loss. The PCATMIP was used on a completely uncompensated twice‐refocused diffusion sequence. However, it could also be helpful for the STE and PGSE approaches described above, as long as the condition of over‐sampling in the presence of physiologic motion is met. This approach has been used to measure intra‐voxel incoherent motion (IVIM) and reduce the measurement bias introduced by IVIM (Fig. 6) 34. A major drawback of this approach is that the SNR level of the reconstructed image remains the same as that for a single repetition, and image quality does not benefit from multiple repetitions. As a consequence, the diffusion‐based indices could be over‐ or under‐estimated and may be influenced by the physiological conditions present during the acquisition. Although this approach has its drawbacks, in situations where patient motion is particularly problematic PCATMIP provides an avenue for signal recovery 46.
Diffusion compartments
The diffusion of water in the myocardium occurs in the intravascular space, extracellular space and intracellular space. The measurement of diffusion in the myocardium with most sequences reflects the contribution of all three compartments and the composite microstructure of the heart. The exception to this is the STE approach, which lacks a true b = 0 s/mm2 image. A small monopolar gradient (typically 10% of the b‐value or higher 47) is needed after the third 90° excitation pulse to dephase the signal from the FID, even in the “non‐diffusion‐encoded or b = 0 s/mm2” image. This gradient also dephases the signal from blood flow in the intravascular space, and the signal from the blood pool is attenuated in all images in the STE sequence. The lack of a true b = 0 s/mm2 does affect the accuracy of the eigenvalues derived from the calculated dyadic diffusion tensor. This results in altered diffusivity (MD) and anisotropy (FA) values, which are derived from this diffusion tensor. The eigenvectors, however, remain unchanged and therefore any directional‐based aspects (such as HA or tractography) are not impacted. Therefore, the non‐diffusion‐encoded image in the STE sequence needs to be corrected for the small b‐value that is applied in order to derive a true b = 0 s/mm2 image. Further study will be needed to directly compare diffusivity values in the myocardium acquired with the STE approach and derivatives of the PGSE approach.
Techniques to distinguish the contribution of the various tissue compartments to diffusion have recently been developed. Double‐PGSE (D‐PGSE) sequences can be used to interrogate intracellular and extracellular diffusion, as well as cellular compartment size 48. The application of D‐PGSE techniques in the heart in vivo is, however, extremely challenging and has yet to be performed. Distinguishing the perfusion of blood in the intravascular space from the diffusion of water in the extravascular space can be performed with IVIM (Fig. 6) 34. IVIM involves the acquisition of multiple diffusion‐weighted images, each acquired with a sequentially larger b‐value. A two‐compartment model is used to determine the vascular fraction (f) and extravascular diffusion coefficient (D) 34. Further investigation will be needed to establish relationships between measurements acquired by IVIM, DTI and other techniques such as arterial spin labeling.
Impact of strain
Strain produced by myocardial deformation has an impact on the diffusion measurement. The diffusion time (Δ) in the PGSE experiments is short, and the effects of strain are thus minimal. The STE approach, however, requires a long Δ, during which time the impact of strain is significant and cannot be neglected 2, 3, 38, 42, 49.
Application of the first monopolar gradient creates a spatial distribution of phase across the myocardium, which is then subject to cyclic expansion and contraction across an entire cardiac cycle, until the second monopolar gradient is applied. The phase evolution of a particular spin is thus subject to the effects of both physical diffusion and its strain history. In the absence of strain compensation, the cardiac diffusion measured with the STE sequence mixes with the effects of cardiac strain 2, 3, 38, 42, 49. It has been shown both analytically and experimentally that the effects of strain can be eliminated by scanning at selected “sweet spots” of the cardiac cycle 38, 42. The most commonly used sweet spot is in the mid‐systolic phase of the cardiac cycle. Data acquired in other phases of the cardiac cycle should be acquired with either a PGSE approach or STE with dedicated strain compensation (Fig. 7) 38, 42.
Figure 7.

Impact of strain on the STE sequence. DTI was performed at end‐systole (TD 305 ms) corresponding to the period of “standstill” on the cine images. This does not correspond to the sweet spot (point of no net strain effect) of the cycle for diffusion‐weighted STE (TD 160 ms). Tagged cine images were used to derive myocardial strain and correct the end‐systolic diffusion tensor for the effects of strain. The diffusion tensor field was rendered as superquadric glyphs, color coded by HA, and scaled by the eigenvalues. (A, B) Superquadric glyph field of the LV without and with strain correction, respectively. (C) Superquadric glyphs derived from the diffusion tensor with and without strain correction are superimposed. (A–C) Significant differences in the shape and orientation of the glyphs can be observed between the strain‐corrected and uncorrected images. Reproduced with permission 38.
Acceleration techniques
The advent of multi‐element receive coil arrays has allowed two forms of acceleration to be applied to cardiac DTI. In‐plane acceleration can be performed with standard parallel reception techniques such as GRAPPA and SENSE. This can be used to increase spatial resolution or decrease T E, or a combination of the two. While partial k‐space sampling can also decrease T E, unlike parallel acquisition, it does not reduce image distortion resulting from the lengthy EPI readout time.
Acceleration in the slice axis is extremely appealing in cardiac DTI due to the long duration of the acquisitions. This acceleration can be performed using two techniques – simultaneous image refocusing (SIR) 50 or blipped CAIPI (controlled aliasing in parallel acquisition) 51, 52. Both methods excite multiple slices simultaneously, but the SIR method multiplexes slices in the time (readout) axis, while blipped CAIPI uses parallel imaging to separate the slices. Preliminary data suggest that in vivo DTI of the human heart can be accurately performed with rate 2 in‐plane GRAPPA combined with rate 3 blipped CAIPI, for a composite sixfold acceleration 53.
HARDI and q‐space techniques
There is growing interest within the diffusion MRI community to develop techniques with greater angular resolution than the tensor model, since DTI cannot resolve multiple fiber populations in a single voxel 15, 54. In the myocardium, fiber crossings may exist at the right ventricular insertion points. Furthermore, in infarcted myocardium, severe fiber disarray contributes to the presence of crossing fibers in the infarcted region 22. While high‐angular‐resolution diffusion imaging (HARDI) in the heart should offer superior resolution of myofiber architecture, this technique is time consuming and currently limited to ex vivo imaging.
The basis of q‐space diffusion imaging techniques such as HARDI and diffusion spectrum imaging (DSI) has been previously reviewed 15. DSI of infarcted myocardium has been performed with as many as 514 diffusion‐encoding directions 22. Acquiring this many directions or more makes for lengthy examinations that will be clinically impractical. Within the central nervous system, neural tracts form a complicated 3D network and regions of fiber crossing and kissing are common 55. Research studies in the brain using DSI have therefore utilized very high b‐values, 10 000 s/mm2 or larger, with hundreds of diffusion‐encoding directions 41. It is unlikely that this approach will be useful in the heart. Such high b‐values require long T E, resulting in no signal due to the short myocardial T 2. Additionally, the structure of the myocardium likely does not warrant the high intravoxel angular resolution inherent to HARDI or DSI.
Fiber architecture of the heart
Cardiomyocytes in the heart form a 3D branching network with a distinctive organization 19, 23, 56. Myofibers in the subendocardium spiral around the long axis of the heart with a positive HA, while those in the subepicardium have a negative HA. Myofibers in the midmyocardium are circumferential (Figs 1 and 2) 13, 20, 21, 22, 26. Groups of three to five myofibers are grouped together into sheets, and it is the sliding and shearing of these sheets that allows the myocardium to deform 23, 24, 25, 57. It is frequently assumed that the myocardium thickens along the direction of its myofibers, but this is a common misconception. The primary eigenvector of myocardial strain is radial, which is perpendicular to the individual myofibers and aligned with the direction of the myofiber sheets 25.
The architecture of the myocardium plays a central role in its mechanical and electrical function and is thus highly conserved between species 9, 21, 22, 26, 58, 59, 60, 61, 62, 63, 64, 65, 66, 67. HAs in the hearts of mice, rats, sheep, pigs, dogs, and humans follow a very similar distribution (Fig. 8) 21. Embryologically, however, the microstructure of the heart develops fairly late – well after the heart has started to contract. Studies in human fetal hearts have revealed that the fiber architecture characteristic of the left ventricle develops only towards the end of the second trimester (Fig. 9) 68. The microstructure of the heart remains highly plastic in the third trimester and in the initial post‐partum period 69. During this time, it is able to adapt to falling pulmonary vascular impedance or the persistence of a high load on the right ventricle.
Figure 8.
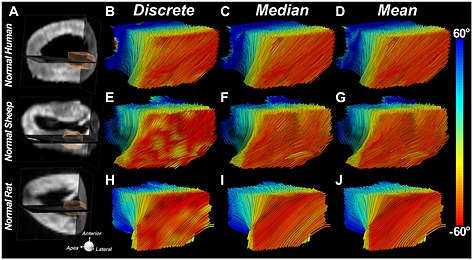
Conservation of fiber architecture in the mammalian heart. Fiber tracts in the lateral wall of the LV are depicted using three classification schemes: in the first each segment in the tract is classified discretely by the HA of that segment; in the second the entire tract is classified by its median HA, and in the third by its mean HA. The tracts are being viewed from their epicardial surface (red fibers). Fiber architectures in the three species shown are remarkably similar. Reproduced with permission 21.
Figure 9.
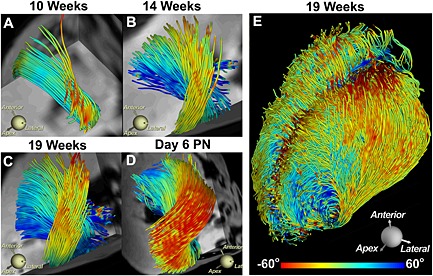
Development of myofiber architecture in the human fetal heart. (A–D) Tracts intersecting an ROI in the lateral wall are shown at various stages of gestation and development. Day 6 PN, post‐natal day 6. (E) Tracts in the entire heart at 19 weeks of gestation. Myocardial anisotropy and the characteristic architecture of the human heart develop fairly late in the second trimester. Reproduced with permission 68.
The metrics most commonly used to measure the microstructure in the heart include MD, FA, myofiber HA, and the myofiber sheet angle 14, 17, 20, 26, 67. Recent studies suggest that two populations of sheet angles exist within the myocardium, and that radial reorientation of the sheets from diastole to systole facilitates radial strain 49, 56, 57. The superquadric glyph representation of the diffusion tensor has also been used to highlight the helical organization and structure of the myocardium 70, 71. Superquadric glyphs are commonly color coded by HA and scaled by the eigenvalues. This representation facilitates the comparison of original and strain‐corrected diffusion tensor fields (Fig. 7) 38.
Tractography has been extensively used in the brain to elucidate its anatomical connectivity. Tractography in the myocardium is more challenging because the 3D continuum does not contain clear start and end points. On the other hand, myofiber tracts are highly coherent and show little dispersion in HA along their course, except at particular locations, such as the papillary muscles 21.
Myofiber tracts can be encoded either by the original voxel‐based HA or by measures of the statistical distribution of HA along their length. A recently described approach employs the differences in median, maximum, and minimum HA along a tract to derive a tractographic coherence index (TCI), which is a measure of HA dispersion along each tract (Fig. 10) 21. An angle of 35° is commonly used as a criterion for tract termination in the heart, but this value originates from tractography of the brain and may not be optimal for the myocardium.
Figure 10.
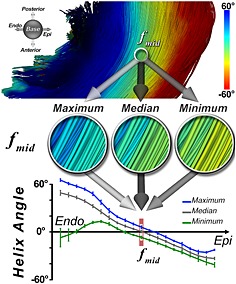
Quantification of tract coherence in the myocardium. The TCI is based on the maximum, median, and minimum HA classifications of myofibers within an ROI. The maximum, median, and minimum HA curves are derived by averaging each HA classification successively in the base–apex and anterior–posterior directions of the ROI at each voxel. This creates the three transmural HA curves. In the midmyocardium and subepicardium, tract coherence is high and the curves lie close to each other. In the subendocardium, however, tract coherence is reduced due to the effect of the papillary muscles and endocardial trabeculations. Reproduced with permission 21.
Microstructural changes in ischemic heart disease
DTI of the myocardium after ischemic injury has been performed in several species ex vivo 21, 22, 59, 65 and in mice, pigs and humans in vivo 9, 10, 11, 12. These studies show that acute ischemia is accompanied by a significant rise in MD and fall in FA 9, 10, 11. As the myocardium heals, MD and FA return towards their baseline values. Infarction often results in severe myofiber disarray in the myocardium, but this can take up to 48 h to develop 9, 72. Ischemia–reperfusion (IR), on the other hand, results in a partially reversible loss of myofiber coherence. This is partly due to cardiomyocyte damage, which is irreversible, and myocardial edema, which is reversible. The permanent extent of structural damage therefore cannot be evaluated for several weeks until the edema resolves (Fig. 11) 9.
Figure 11.
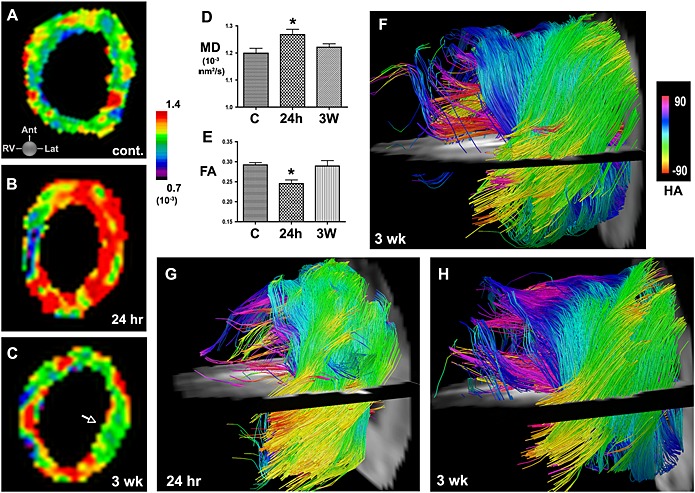
In vivo DTI and tractography in mice with IR. (A) MD map in a healthy mouse. (B, C) Serial MD maps of the LV in a mouse (B) 24 h and (C) 3 weeks after IR. (D, E) Acute injury is characterized by an increase in MD and a decrease in FA at 24 h. Within 3 weeks of IR, MD and FA have returned towards their normal values (C, control; * p < 0.05). (F) Tractography of the LV 3 weeks after IR. Moderate disruption of fiber architecture is seen. (G, H) Serial in vivo tractography of a mouse (G) 24 h and (H) 3 weeks after IR. At 24 h few tracts can be resolved in the apical half of the LV. At 3 weeks substantially more tracts, particularly in the subendocardium and midmyocardium, can be resolved, but fiber architecture remains significantly perturbed. Reproduced with permission 9.
Chronic infarction is characterized by a marked loss of myofibers in the infarct zone. However, this loss is not complete, and a network of residual myofibers is frequently seen in the infarct, particularly at its edge (Fig. 12) 22. Changes in microstructure occur in both the border and remote zones of an infarct as the heart remodels 10, 11, 21, 65. Data in humans 10, 11, and sheep with large septal infarcts 21, show that the myofibers in the remote zone undergo a rightward rotation as the heart dilates (Fig. 13). This likely increases the mechanical stress on the myocardium in the remote zone, leading to apoptosis, further left ventricular dilation, and a progressive loss of function.
Figure 12.
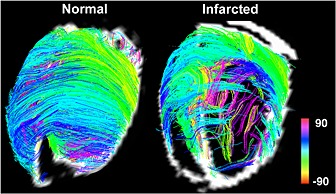
DSI‐tractography of a normal and an infarcted rat heart. Imaging was performed ex vivo with 514 diffusion‐encoding directions. In the normal heart, fiber architecture is highly coherent. In the infarcted heart, a network of residual myofibers propagates into the infarct from the border zone. Color coding indicates HA. Reproduced with permission 22.
Figure 13.
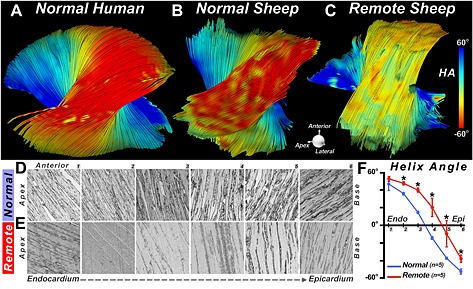
DTI‐tractography ex vivo showing a rightward rotation of fibers in the remote zone of a myocardial infarct. (A, B) Fiber tracts in the lateral wall of (A) a normal human heart and (B) a normal sheep heart. (C) Fiber tracts in the lateral wall (remote zone) of a sheep with a large septal infarct. The fibers in the remote zone have undergone a rightward (more positive) shift in HA. This can be clearly seen in the epicardium, where the fibers have shifted from red to yellow. (D–F) Histological confirmation of the DTI‐tractography findings. (D, E) Sections were obtained at six transmural depths in the lateral wall (1–6, from endocardium to epicardium) of normal sheep (D) and the remote zone (E) of infarcted sheep. (F) The transmural slope of HA, calculated from the histological sections, shows that HA in the remote zone becomes more positive (normal versus remote: * p < 0.05). Reproduced with permission 21.
The regeneration of injured myocardium in the adult heart remains a largely unmet need. DTI and tractography of the myocardium have the potential to document the regeneration of myofibers, guide the development of new treatment strategies, and assess their benefits. This was demonstrated in a recent preclinical study where the impact of bone‐marrow mononuclear cells (BMMCs) was studied 9. Serial in vivo tractography revealed that BMMC injection did not generate new myofibers (Fig. 14) 9, consistent with the results of several recently reported large clinical trials 73. This demonstrates the potential of DTI to assess the success of regenerative strategies in the preclinical setting and then guide their translation into the clinical setting 74.
Figure 14.
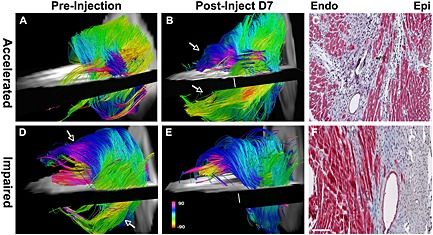
Use of serial in vivo DTI‐tractography to characterize the regenerative response of the myocardium after the injection of BMMCs. In the majority of animals studied, the impact of cell injection was neutral. In one case, however, an accelerated recovery of myofiber architecture was seen (A–C). Post‐injection, new coherent tracts (arrows) were seen in both the subepicardium and subendocardium, and were confirmed histologically. In two animals, however, the injection of BMMCs impaired healing and had a deleterious effect on fiber architecture in the healing infarct (D–F). (D) Prior to BMMC injection, coherent tracts were seen in the subendocardium and subepicardium (arrows). (E, F) Following BMMC injection, fewer tracts were present in the anterolateral subendocardium, and the tracts in the subepicardium of the inferolateral wall were completely lost (scale bar, 100 µm). Color coding indicates HA. Reproduced with permission 9.
Clinical translation
DTI as a clinical tool holds significant promise in a broad range of conditions, including ischemic heart disease, hypertrophic cardiomyopathy, ventricular arrhythmias and heart failure 9, 10, 11, 63, 75, 76, 77. However, several substantial challenges impeding its translation will need to be addressed. Recently, several investigators have shown the feasibility of the PGSE approach using systems with sufficient gradient capability 40, 43, 44. DW‐DE will also benefit greatly from these higher gradient strengths. Advances in pulse sequence design will need to address the ability of patients with symptomatic cardiovascular disease to complete the exam successfully. This will require either the duration of the acquisition to be short or the data to be acquired during free‐breathing, or both. A recent study indicates the feasibility of this approach 78.
The PGSE approach is applied over a single heartbeat and can be easily combined with a free‐breathing acquisition using a diaphragmatic navigator. The use of a free‐breathing navigator‐based acquisition with the STE sequence is unfortunately more complex. Motion compensation in the STE approach assumes that all motion is periodic and identical from beat to beat. However, even if a narrow navigator window is used, the motion of the diaphragm and hence the heart can violate these conditions, leading to signal loss. In addition, the use of three excitation pulses over two successive heartbeats does not render the technique suitable for slice tracking. Nevertheless, navigator‐based STE has been successfully performed, albeit with limited heart coverage, in normal volunteers (Fig. 15) 37. A biofeedback mechanism was implemented to increase scanning efficiency by displaying the navigator signal to the subject, so they could assist in optimizing data acceptance. Since the current navigator‐based STE approach is noisier than a breath‐hold approach, such tools to help patients control their breathing pattern in the scanner may facilitate a free‐breathing STE exam with reduced physiological noise.
Figure 15.
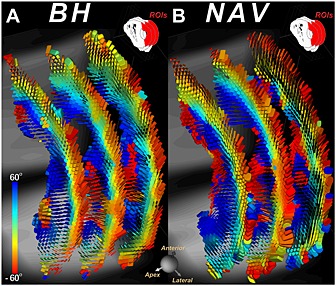
DTI of a healthy volunteer with the STE approach using (A) multiple breath‐holds (BH) and (B) a diaphragmatic navigator (NAV) during free breathing. In both cases, the identical three short‐axis slices were imaged and the tensor field was represented with superquadric glyphs color coded by HA. The qualities of the BH and NAV approaches appear fairly similar. Reproduced with permission 37.
DTI of the heart is time consuming and has been performed with very limited anatomic coverage (three to six short‐axis slices). More recently, investigators have achieved full coverage in healthy human volunteers using the STE approach with 12 contiguous short‐axis slices, 10 diffusion‐encoding directions and a resolution of 2.5 × 2.5 × 8 mm3 (Fig. 16) 79. The myocardium is a 3D electro‐mechanical continuum and a local microstructural alteration may impact its organization and performance remotely. While studies with partial coverage of the heart can provide significant value, full anatomical coverage of the heart is required for a complete functional and microstructural assessment. Techniques to enable clinical translation with full anatomical coverage are under development and include the use of PGSE sequences with high rates of slice acceleration and advanced post‐processing techniques to mitigate the effects of motion within the navigator window.
Figure 16.
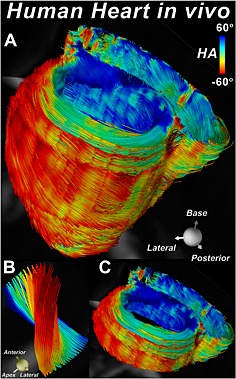
Tractography of the whole heart of a normal volunteer without slice gaps 79. The fibers are color coded by their HA. Twelve contiguous short‐axis slices, each 8 mm thick, were imaged with the STE approach. (A) The entire heart viewed from the postero‐lateral perspective. (B) Tracts intersecting a small ROI placed in the lateral wall at the mid‐ventricular level. The evolution of HA from positive in the subendocardium to negative in the subepicardium is clearly seen. (C) Tractography within a basal short‐axis slab depicting the transmural arrangement of myofibers in both the left and right ventricles. Original images provided by the authors.
Conclusion
Diffusion MRI of the heart is technically challenging, but provides unique information on the structure and integrity of the myocardium without the need for exogenous contrast agents. Recently developed acceleration techniques have improved the accuracy and efficiency of DTI, though it still remains relatively time consuming. Clinical systems with stronger gradients will likely facilitate the move from STE to motion‐compensated PGSE sequences in the near future. While HARDI techniques are feasible, their advantage over DTI should be further investigated in the heart. The clinical feasibility of DTI is imminent, and its use will provide valuable and complementary information to evaluate and treat patients with heart disease.
Disclosures
Himanshu Bhat is an employee of Siemens Healthcare. The Athinoula A. Martinos Center for Biomedical Imaging receives research support from Siemens Healthcare.
Acknowledgements
This work was supported by the following grants from the National Institutes of Health: R01HL093038 (DES), R01HL112831 (DES), and P41RR14075 (Athinoula A. Martinos Center for Biomedical Imaging).
Mekkaoui, C. , Reese, T. G. , Jackowski, M. P. , Bhat, H. , and Sosnovik, D. E. (2017) Diffusion MRI in the heart. NMR Biomed., 30: e3426. doi: 10.1002/nbm.3426.
References
- 1. Edelman RR, Gaa J, Wedeen VJ, Loh E, Hare JM, Prasad P, Li W. In vivo measurement of water diffusion in the human heart. Magn. Reson. Med. 1994; 32(3): 423–428. [DOI] [PubMed] [Google Scholar]
- 2. Reese TG, Wedeen VJ, Weisskoff RM. Measuring diffusion in the presence of material strain. J. Magn. Reson. B 1996; 112(3): 253–258. [DOI] [PubMed] [Google Scholar]
- 3. Reese TG, Weisskoff RM, Smith RN, Rosen BR, Dinsmore RE, Wedeen VJ. Imaging myocardial fiber architecture in vivo with magnetic resonance. Magn. Reson. Med. 1995; 34(6): 786–791. [DOI] [PubMed] [Google Scholar]
- 4. van Heeswijk RB, Feliciano H, Bongard C, Bonanno G, Coppo S, Lauriers N, Locca D, Schwitter J, Stuber M. Free‐breathing 3 T magnetic resonance T2‐mapping of the heart. JACC Cardiovasc. Imaging 2012; 5(12): 1231–1239. [DOI] [PubMed] [Google Scholar]
- 5. van Heeswijk RB, Piccini D, Feliciano H, Hullin R, Schwitter J, Stuber M. Self‐navigated isotropic three‐dimensional cardiac T2 mapping. Magn. Reson. Med. 2015; 73(4): 1549–1554. [DOI] [PubMed] [Google Scholar]
- 6. Ding H, Fernandez‐de‐Manuel L, Schar M, Schuleri KH, Halperin H, He L, Muz Zviman M, Beinart R, Herzka DA. Three‐dimensional whole‐heart T2 mapping at 3 T. Magn. Reson. Med. 2015; 74(3): 803–816. [DOI] [PubMed] [Google Scholar]
- 7. Lu H, Nagae‐Poetscher LM, Golay X, Lin D, Pomper M, van Zijl PC. Routine clinical brain MRI sequences for use at 3.0 Tesla. J. Magn. Reson. Imaging 2005; 22(1): 13–22. [DOI] [PubMed] [Google Scholar]
- 8. Sundgren PC, Dong Q, Gomez‐Hassan D, Mukherji SK, Maly P, Welsh R. Diffusion tensor imaging of the brain: review of clinical applications. Neuroradiology 2004; 46(5): 339–350. [DOI] [PubMed] [Google Scholar]
- 9. Sosnovik DE, Mekkaoui C, Huang S, Chen HH, Dai G, Stoeck CT, Ngoy S, Guan J, Wang R, Kostis WJ, Jackowski MP, Wedeen VJ, Kozerke S, Liao R. Microstructural impact of ischemia and bone marrow‐derived cell therapy revealed with diffusion tensor magnetic resonance imaging tractography of the heart in vivo. Circulation 2014; 129(17): 1731–1741. [DOI] [PMC free article] [PubMed] [Google Scholar]
- 10. Wu MT, Su MY, Huang YL, Chiou KR, Yang P, Pan HB, Reese TG, Wedeen VJ, Tseng WY. Sequential changes of myocardial microstructure in patients postmyocardial infarction by diffusion‐tensor cardiac MR: correlation with left ventricular structure and function. Circ. Cardiovasc. Imaging 2009; 2: 32–40. [DOI] [PubMed] [Google Scholar]
- 11. Wu MT, Tseng WY, Su MY, Liu CP, Chiou KR, Wedeen VJ, Reese TG, Yang CF. Diffusion tensor magnetic resonance imaging mapping the fiber architecture remodeling in human myocardium after infarction: correlation with viability and wall motion. Circulation 2006; 114(10): 1036–1045. [DOI] [PubMed] [Google Scholar]
- 12. Nguyen C, Fan Z, Xie Y, Dawkins J, Tseliou E, Bi X, Sharif B, Dharmakumar R, Marban E, Li D. In vivo contrast free chronic myocardial infarction characterization using diffusion‐weighted cardiovascular magnetic resonance. J. Cardiovasc. Magn. Reson. 2014; 16(1): 68. [DOI] [PMC free article] [PubMed] [Google Scholar]
- 13. Sosnovik DE, Wang R, Dai G, Reese TG, Wedeen VJ. Diffusion MR tractography of the heart. J. Cardiovasc. Magn. Reson. 2009; 11: 47. [DOI] [PMC free article] [PubMed] [Google Scholar]
- 14. Basser PJ. Inferring microstructural features and the physiological state of tissues from diffusion‐weighted images. NMR Biomed. 1995; 8(7/8): 333–344. [DOI] [PubMed] [Google Scholar]
- 15. Hagmann P, Jonasson L, Maeder P, Thiran JP, Wedeen VJ, Meuli R. Understanding diffusion MR imaging techniques: from scalar diffusion‐weighted imaging to diffusion tensor imaging and beyond. Radiographics 2006; 26(Suppl. 1): S205–223. [DOI] [PubMed] [Google Scholar]
- 16. Le Bihan D, Johansen‐Berg H. Diffusion MRI at 25: exploring brain tissue structure and function. Neuroimage 2012; 61(2): 324–341. [DOI] [PMC free article] [PubMed] [Google Scholar]
- 17. Pierpaoli C, Basser PJ. Toward a quantitative assessment of diffusion anisotropy. Magn. Reson. Med. 1996; 36(6): 893–906. [DOI] [PubMed] [Google Scholar]
- 18. Jones DK. The effect of gradient sampling schemes on measures derived from diffusion tensor MRI: a Monte Carlo study. Magn. Reson. Med. 2004; 51(4): 807–815. [DOI] [PubMed] [Google Scholar]
- 19. Streeter DD, Jr , Spotnitz HM, Patel DP, Ross J, Jr , Sonnenblick EH. Fiber orientation in the canine left ventricle during diastole and systole. Circ. Res. 1969; 24(3): 339–347. [DOI] [PubMed] [Google Scholar]
- 20. Scollan DF, Holmes A, Winslow R, Forder J. Histological validation of myocardial microstructure obtained from diffusion tensor magnetic resonance imaging. Am. J. Physiol. 1998; 275(6 Pt 2): H2308–2318. [DOI] [PubMed] [Google Scholar]
- 21. Mekkaoui C, Huang S, Chen HH, Dai G, Reese TG, Kostis WJ, Thiagalingam A, Maurovich‐Horvat P, Ruskin JN, Hoffmann U, Jackowski MP, Sosnovik DE. Fiber architecture in remodeled myocardium revealed with a quantitative diffusion CMR tractography framework and histological validation. J. Cardiovasc. Magn. Reson. 2012; 14: 70. [DOI] [PMC free article] [PubMed] [Google Scholar]
- 22. Sosnovik DE, Wang R, Dai G, Wang T, Aikawa E, Novikov M, Rosenzweig A, Gilbert RJ, Wedeen VJ. Diffusion spectrum MRI tractography reveals the presence of a complex network of residual myofibers in infarcted myocardium. Circ. Cardiovasc. Imaging 2009; 2(3): 206–212. [DOI] [PMC free article] [PubMed] [Google Scholar]
- 23. LeGrice IJ, Smaill BH, Chai LZ, Edgar SG, Gavin JB, Hunter PJ. Laminar structure of the heart: ventricular myocyte arrangement and connective tissue architecture in the dog. Am. J. Physiol. 1995; 269(2 Pt 2): H571–582. [DOI] [PubMed] [Google Scholar]
- 24. LeGrice IJ, Takayama Y, Covell JW. Transverse shear along myocardial cleavage planes provides a mechanism for normal systolic wall thickening. Circ. Res. 1995; 77(1): 182–193. [DOI] [PubMed] [Google Scholar]
- 25. Dou J, Tseng WY, Reese TG, Wedeen VJ. Combined diffusion and strain MRI reveals structure and function of human myocardial laminar sheets in vivo. Magn. Reson. Med. 2003; 50(1): 107–113. [DOI] [PubMed] [Google Scholar]
- 26. Tseng WY, Wedeen VJ, Reese TG, Smith RN, Halpern EF. Diffusion tensor MRI of myocardial fibers and sheets: correspondence with visible cut‐face texture. J. Magn. Reson. Imaging 2003; 17(1): 31–42. [DOI] [PubMed] [Google Scholar]
- 27. Hales PW, Burton RA, Bollensdorff C, Mason F, Bishop M, Gavaghan D, Kohl P, Schneider JE. Progressive changes in T 1, T 2 and left‐ventricular histo‐architecture in the fixed and embedded rat heart. NMR Biomed. 2011; 24(7): 836–843. [DOI] [PMC free article] [PubMed] [Google Scholar]
- 28. Hales PW, Schneider JE, Burton RA, Wright BJ, Bollensdorff C, Kohl P. Histo‐anatomical structure of the living isolated rat heart in two contraction states assessed by diffusion tensor MRI. Prog. Biophys. Mol. Biol. 2012; 110(2/3): 319–330. [DOI] [PMC free article] [PubMed] [Google Scholar]
- 29. Bernstein MA, Zhou XJ, Polzin JA, King KF, Ganin A, Pelc NJ, Glover GH. Concomitant gradient terms in phase contrast MR: analysis and correction. Magn. Reson. Med. 1998; 39(2): 300–308. [DOI] [PubMed] [Google Scholar]
- 30. Jezzard P, Barnett AS, Pierpaoli C. Characterization of and correction for eddy current artifacts in echo planar diffusion imaging. Magn. Reson. Med. 1998; 39(5): 801–812. [DOI] [PubMed] [Google Scholar]
- 31. Reese TG, Heid O, Weisskoff RM, Wedeen VJ. Reduction of eddy‐current‐induced distortion in diffusion MRI using a twice‐refocused spin echo. Magn. Reson. Med. 2003; 49(1): 177–182. [DOI] [PubMed] [Google Scholar]
- 32. Gamper U, Boesiger P, Kozerke S. Diffusion imaging of the in vivo heart using spin echoes – considerations on bulk motion sensitivity. Magn. Reson. Med. 2007; 57(2): 331–337. [DOI] [PubMed] [Google Scholar]
- 33. Nguyen C, Fan Z, Sharif B, He Y, Dharmakumar R, Berman DS, Li D. In vivo three‐dimensional high resolution cardiac diffusion‐weighted MRI: a motion compensated diffusion‐prepared balanced steady‐state free precession approach. Magn. Reson. Med. 2014; 72(5): 1257–1267. [DOI] [PubMed] [Google Scholar]
- 34. Delattre BM, Viallon M, Wei H, Zhu YM, Feiweier T, Pai VM, Wen H, Croisille P. In vivo cardiac diffusion‐weighted magnetic resonance imaging: quantification of normal perfusion and diffusion coefficients with intravoxel incoherent motion imaging. Invest. Radiol. 2012; 47(11): 662–670. [DOI] [PMC free article] [PubMed] [Google Scholar]
- 35. Dabir D, Child N, Kalra A, Rogers T, Gebker R, Jabbour A, Plein S, Yu CY, Otton J, Kidambi A, McDiarmid A, Broadbent D, Higgins DM, Schnackenburg B, Foote L, Cummins C, Nagel E, Puntmann VO. Reference values for healthy human myocardium using a T1 mapping methodology: results from the International T1 Multicenter cardiovascular magnetic resonance study. J. Cardiovasc. Magn. Reson. 2014; 16: 69. [DOI] [PMC free article] [PubMed] [Google Scholar]
- 36. Kawel‐Boehm N, Maceira A, Valsangiacomo‐Buechel ER, Vogel‐Claussen J, Turkbey EB, Williams R, Plein S, Tee M, Eng J, Bluemke DA. Normal values for cardiovascular magnetic resonance in adults and children. J. Cardiovasc. Magn. Reson. 2015; 17: 29. [DOI] [PMC free article] [PubMed] [Google Scholar]
- 37. Nielles‐Vallespin S, Mekkaoui C, Gatehouse P, Reese TG, Keegan J, Ferreira PF, Collins S, Speier P, Feiweier T, de Silva R, Jackowski MP, Pennell DJ, Sosnovik DE, Firmin D. In vivo diffusion tensor MRI of the human heart: reproducibility of breath‐hold and navigator‐based approaches. Magn. Reson. Med. 2013; 70(2): 454–465. [DOI] [PMC free article] [PubMed] [Google Scholar]
- 38. Stoeck CT, Kalinowska A, von Deuster C, Harmer J, Chan RW, Niemann M, Manka R, Atkinson D, Sosnovik DE, Mekkaoui C, Kozerke S. Dual‐phase cardiac diffusion tensor imaging with strain correction. PLoS One 2014; 9(9): e107159. [DOI] [PMC free article] [PubMed] [Google Scholar]
- 39. Tunnicliffe EM, Scott AD, Ferreira P, Ariga R, McGill LA, Nielles‐Vallespin S, Neubauer S, Pennell DJ, Robson MD, Firmin DN. Intercentre reproducibility of cardiac apparent diffusion coefficient and fractional anisotropy in healthy volunteers. J. Cardiovasc. Magn. Reson. 2014; 16: 31. [DOI] [PMC free article] [PubMed] [Google Scholar]
- 40. Froeling M, Strijkers GJ, Nederveen AJ, Luijten PR. Whole heart DTI using asymmetric bipolar diffusion gradients. J. Cardiovasc. Magn. Reson. 2015; 17(Suppl. 1): P15. [Google Scholar]
- 41. McNab JA, Edlow BL, Witzel T, Huang SY, Bhat H, Heberlein K, Feiweier T, Liu K, Keil B, Cohen‐Adad J, Tisdall MD, Folkerth RD, Kinney HC, Wald LL. The Human Connectome Project and beyond: initial applications of 300 mT/m gradients. Neuroimage 2013; 80: 234–245. [DOI] [PMC free article] [PubMed] [Google Scholar]
- 42. Tseng WY, Reese TG, Weisskoff RM, Wedeen VJ. Cardiac diffusion tensor MRI in vivo without strain correction. Magn. Reson. Med. 1999; 42(2): 393–403. [DOI] [PubMed] [Google Scholar]
- 43. Stoeck CT, von Deuster C, Genet M, Atkinson D, Kozerke S. Second‐order motion‐compensated spin echo diffusion tensor imaging of the human heart. Magn. Reson. Med. 2015; 17(Suppl 1): P81. [DOI] [PubMed] [Google Scholar]
- 44. Welsh C, Di Bella E, Hsu E. Higher‐order motion‐compensation for in vivo cardiac diffusion tensor imaging in rats. IEEE Trans. Med. Imaging 2015; 34(9): 1843–1853. [DOI] [PMC free article] [PubMed] [Google Scholar]
- 45. Jeong EK, Kim SE, Parker DL. High‐resolution diffusion‐weighted 3D MRI, using diffusion‐weighted driven‐equilibrium (DW‐DE) and multishot segmented 3D‐SSFP without navigator echoes. Magn. Reson. Med. 2003; 50(4): 821–829. [DOI] [PubMed] [Google Scholar]
- 46. Wei H, Viallon M, Delattre BM, Moulin K, Yang F, Croisille P, Zhu Y. Free‐breathing diffusion tensor imaging and tractography of the human heart in healthy volunteers using wavelet‐based image fusion. IEEE Trans. Med. Imaging 2015; 34(1): 306–316. [DOI] [PubMed] [Google Scholar]
- 47. Scott AD, Ferreira PF, Nielles‐Vallespin S, Gatehouse P, McGill LA, Kilner P, Pennell DJ, Firmin DN. Optimal diffusion weighting for in vivo cardiac diffusion tensor imaging. Magn. Reson. Med. 2015; 74(2): 420–430. [DOI] [PubMed] [Google Scholar]
- 48. Shemesh N, Ozarslan E, Komlosh ME, Basser PJ, Cohen Y. From single‐pulsed field gradient to double‐pulsed field gradient MR: gleaning new microstructural information and developing new forms of contrast in MRI. NMR Biomed. 2010; 23(7): 757–780. [DOI] [PMC free article] [PubMed] [Google Scholar]
- 49. Axel L, Wedeen VJ, Ennis DB. Probing dynamic myocardial microstructure with cardiac magnetic resonance diffusion tensor imaging. J. Cardiovasc. Magn. Reson. 2014; 16: 89. [DOI] [PMC free article] [PubMed] [Google Scholar]
- 50. Reese TG, Benner T, Wang R, Feinberg DA, Wedeen VJ. Halving imaging time of whole brain diffusion spectrum imaging and diffusion tractography using simultaneous image refocusing in EPI. J. Magn. Reson. Imaging 2009; 29(3): 517–522. [DOI] [PMC free article] [PubMed] [Google Scholar]
- 51. Setsompop K, Cohen‐Adad J, Gagoski BA, Raij T, Yendiki A, Keil B, Wedeen VJ, Wald LL. Improving diffusion MRI using simultaneous multi‐slice echo planar imaging. Neuroimage 2012; 63(1): 569–580. [DOI] [PMC free article] [PubMed] [Google Scholar]
- 52. Setsompop K, Gagoski BA, Polimeni JR, Witzel T, Wedeen VJ, Wald LL. Blipped‐controlled aliasing in parallel imaging for simultaneous multislice echo planar imaging with reduced g‐factor penalty. Magn. Reson. Med. 2012; 67(5): 1210–1224. [DOI] [PMC free article] [PubMed] [Google Scholar]
- 53. Lau AZ, Tunnicliffe EM, Frost R, Koopmans PJ, Tyler DJ, Robson MD. Accelerated human cardiac diffusion tensor imaging using simultaneous multislice imaging. Magn. Reson. Med. 2015; 73(3): 995–1004. [DOI] [PubMed] [Google Scholar]
- 54. Wedeen VJ, Hagmann P, Tseng WY, Reese TG, Weisskoff RM. Mapping complex tissue architecture with diffusion spectrum magnetic resonance imaging. Magn. Reson. Med. 2005; 54(6): 1377–1386. [DOI] [PubMed] [Google Scholar]
- 55. Descoteaux M, Deriche R. High angular resolution diffusion MRI segmentation using region‐based statistical surface evolution. J Math Imaging Vis 2009; 33: 239–252. [Google Scholar]
- 56. Kung GL, Nguyen TC, Itoh A, Skare S, Ingels NB, Jr , Miller DC, Ennis DB. The presence of two local myocardial sheet populations confirmed by diffusion tensor MRI and histological validation. J. Magn. Reson. Imaging 2011; 34(5): 1080–1091. [DOI] [PMC free article] [PubMed] [Google Scholar]
- 57. Cheng YJ, Lang D, Caruthers SD, Efimov IR, Chen J, Wickline SA. Focal but reversible diastolic sheet dysfunction reflects regional calcium mishandling in dystrophic mdx mouse hearts. Am. J. Physiol. Heart Circ. Physiol. 2012; 303(5): H559–568. [DOI] [PMC free article] [PubMed] [Google Scholar]
- 58. Strijkers GJ, Bouts A, Blankesteijn WM, Peeters TH, Vilanova A, van Prooijen MC, Sanders HM, Heijman E, Nicolay K. Diffusion tensor imaging of left ventricular remodeling in response to myocardial infarction in the mouse. NMR Biomed. 2009; 22(2): 182–190. [DOI] [PubMed] [Google Scholar]
- 59. Chen J, Song SK, Liu W, McLean M, Allen JS, Tan J, Wickline SA, Yu X. Remodeling of cardiac fiber structure after infarction in rats quantified with diffusion tensor MRI. Am. J. Physiol. Heart Circ. Physiol. 2003; 285(3): H946–954. [DOI] [PubMed] [Google Scholar]
- 60. Holmes AA, Scollan DF, Winslow RL. Direct histological validation of diffusion tensor MRI in formaldehyde‐fixed myocardium. Magn. Reson. Med. 2000; 44(1): 157–161. [DOI] [PubMed] [Google Scholar]
- 61. Ripplinger CM, Li W, Hadley J, Chen J, Rothenberg F, Lombardi R, Wickline SA, Marian AJ, Efimov IR. Enhanced transmural fiber rotation and connexin 43 heterogeneity are associated with an increased upper limit of vulnerability in a transgenic rabbit model of human hypertrophic cardiomyopathy. Circ. Res. 2007; 101(10): 1049–1057. [DOI] [PMC free article] [PubMed] [Google Scholar]
- 62. Geerts L, Bovendeerd P, Nicolay K, Arts T. Characterization of the normal cardiac myofiber field in goat measured with MR‐diffusion tensor imaging. Am. J. Physiol. Heart Circ. Physiol. 2002; 283(1): H139–145. [DOI] [PubMed] [Google Scholar]
- 63. Helm PA, Younes L, Beg MF, Ennis DB, Leclercq C, Faris OP, McVeigh E, Kass D, Miller MI, Winslow RL. Evidence of structural remodeling in the dyssynchronous failing heart. Circ. Res. 2006; 98(1): 125–132. [DOI] [PubMed] [Google Scholar]
- 64. Smerup M, Nielsen E, Agger P, Frandsen J, Vestergaard‐Poulsen P, Andersen J, Nyengaard J, Pedersen M, Ringgaard S, Hjortdal V, Lunkenheimer PP, Anderson RH. The three‐dimensional arrangement of the myocytes aggregated together within the mammalian ventricular myocardium. Anat. Rec. 2009; 292(1): 1–11. [DOI] [PubMed] [Google Scholar]
- 65. Wu EX, Wu Y, Nicholls JM, Wang J, Liao S, Zhu S, Lau CP, Tse HF. MR diffusion tensor imaging study of postinfarct myocardium structural remodeling in a porcine model. Magn. Reson. Med. 2007; 58(4): 687–695. [DOI] [PubMed] [Google Scholar]
- 66. Wu EX, Wu Y, Tang H, Wang J, Yang J, Ng MC, Yang ES, Chan CW, Zhu S, Lau CP, Tse HF. Study of myocardial fiber pathway using magnetic resonance diffusion tensor imaging. Magn. Reson. Imaging 2007; 25(7): 1048–1057. [DOI] [PubMed] [Google Scholar]
- 67. Hsu EW, Muzikant AL, Matulevicius SA, Penland RC, Henriquez CS. Magnetic resonance myocardial fiber‐orientation mapping with direct histological correlation. Am. J. Physiol. 1998; 274(5 Pt 2): H1627–1634. [DOI] [PubMed] [Google Scholar]
- 68. Mekkaoui C, Porayette P, Jackowski MP, Kostis WJ, Dai G, Sanders S, Sosnovik DE. Diffusion MRI tractography of the developing human fetal heart. PLoS One 2013; 8(8): e72795. [DOI] [PMC free article] [PubMed] [Google Scholar]
- 69. Zhang L, Allen J, Hu L, Caruthers SD, Wickline SA, Chen J. Cardiomyocyte architectural plasticity in fetal, neonatal, and adult pig hearts delineated with diffusion tensor MRI. Am. J. Physiol. Heart Circ. Physiol. 2013; 304(2): H246–252. [DOI] [PMC free article] [PubMed] [Google Scholar]
- 70. Ennis DB, Kindlman G, Rodriguez I, Helm PA, McVeigh ER. Visualization of tensor fields using superquadric glyphs. Magn. Reson. Med. 2005; 53(1): 169–176. [DOI] [PMC free article] [PubMed] [Google Scholar]
- 71. Schultz T, Kindlmann GL. Superquadric glyphs for symmetric second‐order tensors. IEEE Trans. Vis. Comput. Graph. 2010; 16(6): 1595–1604. [DOI] [PubMed] [Google Scholar]
- 72. Huang S, Chen HH, Yuan H, Dai G, Schuhle DT, Mekkaoui C, Ngoy S, Liao R, Caravan P, Josephson L, Sosnovik DE. Molecular MRI of acute necrosis with a novel DNA‐binding gadolinium chelate: kinetics of cell death and clearance in infarcted myocardium. Circ. Cardiovasc. Imaging 2011; 4(6): 729–737. [DOI] [PMC free article] [PubMed] [Google Scholar]
- 73. Simari RD, Pepine CJ, Traverse JH, Henry TD, Bolli R, Spoon DB, Yeh E, Hare JM, Schulman IH, Anderson RD, Lambert C, Sayre SL, Taylor DA, Ebert RF, Moye LA. Bone marrow mononuclear cell therapy for acute myocardial infarction: a perspective from the cardiovascular cell therapy research network. Circ. Res. 2014; 114(10): 1564–1568. [DOI] [PMC free article] [PubMed] [Google Scholar]
- 74. Naumova AV, Modo M, Moore A, Murry CE, Frank JA. Clinical imaging in regenerative medicine. Nat. Biotechnol. 2014; 32(8): 804–818. [DOI] [PMC free article] [PubMed] [Google Scholar]
- 75. McGill LA, Ismail TF, Nielles‐Vallespin S, Ferreira P, Scott AD, Roughton M, Kilner PJ, Ho SY, McCarthy KP, Gatehouse PD, de Silva R, Speier P, Feiweier T, Mekkaoui C, Sosnovik DE, Prasad SK, Firmin DN, Pennell DJ. Reproducibility of in‐vivo diffusion tensor cardiovascular magnetic resonance in hypertrophic cardiomyopathy. J. Cardiovasc. Magn. Reson. 2012; 14: 86. [DOI] [PMC free article] [PubMed] [Google Scholar]
- 76. Tseng WY, Dou J, Reese TG, Wedeen VJ. Imaging myocardial fiber disarray and intramural strain hypokinesis in hypertrophic cardiomyopathy with MRI. J. Magn. Reson. Imaging 2006; 23(1): 1–8. [DOI] [PubMed] [Google Scholar]
- 77. Trayanova NA. Whole‐heart modeling: applications to cardiac electrophysiology and electromechanics. Circ. Res. 2011; 108(1): 113–128. [DOI] [PMC free article] [PubMed] [Google Scholar]
- 78. Froeling M, Strijkers GJ, Nederveen AJ, Chamuleau SA, Luijten PR. Feasibility of in vivo whole heart DTI and IVIM with a 15 minute acquisition protocol. J. Cardiovasc. Magn. Reson. 2014; 16(Suppl. 1): O15. [Google Scholar]
- 79. Mekkaoui C, Reese TG, Jackowski MP, Bhat H, Kostis WJ, Sosnovik DE. In vivo fiber tractography of the right and left ventricles using diffusion tensor MRI of the entire human heart. J. Cardiovasc. Magn. Reson. 2014; 16(Suppl. 1): 17.24490671 [Google Scholar]


