

Abstract
INTRODUCTION
Adult tissues must balance growth and differentiation to develop and maintain homeostasis. Excessive differentiation can lead to aging and poor wound healing. Too much growth is observed in hyperproliferative disorders and cancers. How tissue imbalances arise in disease states is poorly understood.
Skin is an excellent system for understanding the importance of this balance. Essential for keeping harmful microbes out and retaining body fluids, the skin barrier is maintained by an inner layer of proliferative basal progenitors, which generate a constant outward flux of terminally differentiating cells. It is known that when epidermal progenitors accumulate mutations that will give rise to malignancy, they change their program of gene expression. However, the extent to which cancer progression involves a gain of proliferation versus a loss of differentiation is unclear. A detailed molecular knowledge of how normal basal epidermal progenitors transition from a proliferative, undifferentiated state to a terminally differentiated state allows us to investigate how this process goes awry in a tumorigenic state. We use a genetic screen to identify which of the gene changes that occur in both early cell commitment and cancer are integral to maintaining the balance between growth and differentiation.
RATIONALE
Epithelial cancers are among the most prevalent and life-threatening cancers worldwide. Despite intensive research, the mechanisms by which these cancers evade regulatory systems working to balance differentiation and proliferation remain poorly understood. To provide new insights into how malignancies arise and how this might be exploited in advancing cancer therapeutics, we tackled this problem in the developing skin where these regulatory systems are established.
RESULTS
To understand how the balance between growth and differentiation is controlled, we first devised a strategy to transcriptionally profile epidermal stem cells and their terminally differentiating progeny. Using this method, we defined the earliest molecular events associated with the commitment of epidermal progenitors to their differentiation program. Of the many changes that occur, we focused on the cohort of genes that are also mutated in human epithelial cancers. To sift through which of these genes are functional drivers in cancers and how they perturb homeostasis, we conducted an in vivo epidermal RNA interference (RNAi) screen to identify candidates that are selectively enriched or depleted in proliferative progenitors relative to their differentiating progeny.
We focused on PEX11b, a protein associated with peroxisomes, organelles involved in fatty acid and energy metabolism. PEX11b deficiency compromised epidermal terminal differentiation and barrier formation. Without PEX11b, peroxisomes functioned but failed to localize and therefore segregate properly during mitosis.
Probing deeper, we discovered that in normal cells, peroxisomes take on stereotyped positions during mitosis. However, after depletion of PEX11b, peroxisomes failed to localize. Localization was directly coupled to mitotic progression, and when peroxisomes were mislocalized, a mitotic delay occurred. During this delay, spindles rotated uncontrollably, subsequently leading to perturbed polarized divisions and skewed daughter fates. Using a recently developed light-activated organelle repositioning technique to ectopically move peroxisomes, we found that altering peroxisomal localization in a PEX11b-independent manner also causes mitotic alterations.
CONCLUSION
Through transcriptional profiling and RNAi screening, we defined molecular targets associated with either increased proliferation or differentiation. One such target, the peroxisome membrane protein PEX11b, was required for epidermal development. The imbalance in epidermal differentiation that resulted from PEX11b deficiency and peroxisome mislocalization in mitosis was caused by an inability of basal stem cells to orient their spindle perpendicularly relative to the underlying basement membrane. For a stratified epithelium, where spindle orientation plays a critical role in establishing tissue architecture and homeostasis, this defect had dire consequences. Our findings unveil a role for organelle inheritance in mitosis, spindle attachment and alignment, and the choice of daughter progenitors to differentiate or remain stem-like.
Graphical Abstract
Screening for genes that perturb the growth/differentiation balance in skin. Proliferative epidermal progenitors (blue) generate differentiating suprabasal layers (orange). After RNA sequencing, the subset of genes differentially expressed and altered in cancers were screened in vivo for those perturbing growth/differentiation. Focusing on Pex11b-RNAi, we found that during mitosis, metaphase peroxisomes (green) normally localized around spindle poles, but with diminished PEX11b, peroxisomes were disorganized, causing spindle alignment defects and mitotic delay, leading to failed terminal differentiation.

The skin is the largest organ of our body. Although it is only paper-thin, the epidermis provides a barrier that is essential for keeping harmful microbes out and retaining body fluids. To do so, the epidermis maintains an inner layer of proliferative basal keratinocyte progenitors, which generate a constant outward flux of suprabasal, terminally differentiating cells. As basal progenitors commit to terminally differentiate, they retain their transcriptional capacity and systematically produce the necessary proteins that form a dense inner network of keratin filaments surrounded by a “cornified envelope” of proteins deposited beneath the plasma membrane of each cell. Upon completion of this differentiative process, all organelles, including the nucleus, are lost, leaving a layer of dead, flattened squames sandwiched between lipid bilayers at the skin surface. Eventually, these cells are shed, continually being replaced by new cells moving outward (1).
At the surface of the skin, the epidermis is constantly subjected to environmental and physical stress. This, coupled with the highly proliferative nature of the epidermis, contributes to the development of epidermal malignancies, the most common cancers worldwide. Although cancers and other hyperproliferative disorders of the skin involve an imbalance in epidermal growth and differentiation, it remains unclear whether differentiation is suppressed, proliferation is accelerated, or how these two processes are integrally linked.
Some insights can be gained from examining embryonic development of the skin, which begins as a single layer of proliferative progenitors that then give rise to the stratified epidermis. The early stages of stratification and differentiation are accompanied by a shift in the division plane of the progenitors from parallel to perpendicular (2, 3). These divisions result in one daughter cell that maintains its proliferative status, whereas the other is fated to differentiate. As the stratified tissue matures, spindle orientations return to a largely planar orientation, but most divisions are still thought to be asymmetric (4–7). Although mitosis is linked to epidermal homeostasis, the molecular mechanisms involved remain poorly understood.
Transcriptome analyses of epidermal growth and differentiation
To gain insight into how this balance between growth and differentiation is controlled at the molecular level, we devised a strategy to transcriptionally profile the basal and differentiating epidermal populations, spatially and temporally, during skin development. We first engineered mice transgenic for a green fluorescent protein histone marker (H2B-GFP) driven by a progenitor keratin promoter Krt14 and a red fluorescent protein histone marker (H2B-RFP) driven by an early differentiation keratin promoter Krt10. We harvested skin beginning at embryonic day 10.5 (E10.5), when epidermis exists as one layer of progenitors, and ending at postnatal day 4 (P4), when the skin displays a mature stratified epithelium (Fig. 1A). We then used fluorescence-activated cell sorting (FACS) for RFP, GFP, α6 integrin, and cell granularity/size. Analysis using ImageStream X, a photographic flow cytometer, revealed integrin polarization, distinguishing basal versus suprabasal identities; it also allowed visualization of cell size differences (Fig. 1B). Depending on developmental stage, up to four distinct populations were FACS-purified: basally located progenitors (GFP+RFP−α6hismall); basally located, early differentiating and suprabasally located, earlyspinous cells(GFP+RFP+α6+/lowsmall); suprabasal late spinous cells (GFP+RFP+α6−mid-size); and granular cells (GFP+RFP+α6−large) (fig. S1, A to C).
Fig. 1. Spatiotemporal transcriptional landscape of epidermal differentiation.
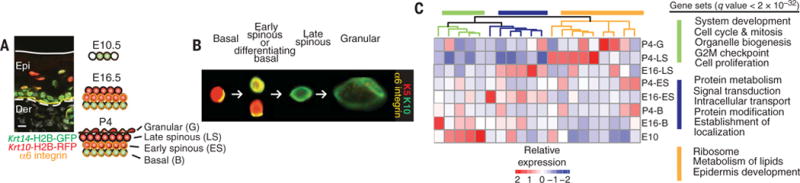
(A) Differential transgene expression as seen by immunofluorescence in progenitor and differentiated cells of P4 epidermis (Epi). Solid white line denotes skin surface; dashed line denotes the epidermal-dermal border. Der, dermis. Immunostain labels transgene fluorescent fusion proteins driven by promoters for Krt14 (green), Krt10 (red), and α6 integrin residing at the base of epidermal progenitors (yellow). Scheme of epidermal development highlighting the epidermal populations from animals transgenic for Krt14-H2B-GFP and Krt10-H2B-RFP that we isolated across three time points using α6 as an additional marker. Scale bar, 10 μm. (B) ImageStream analysis of P4 epidermal keratinocytes. Arrows indicate progression from undifferentiated to differentiated cells. Progenitors and early differentiated basal cells, identified as basal by their polarized integrin and early differentiating by Krt14 and Krt10 expression; suprabasal early spinous, denoted by loss of polarized integrin with Krt14 and Krt10; late spinous and granular, denoted by Krt10 but distinguishable by size. (C) Temporal and spatial transcriptome patterns of genes differentially expressed during epidermal development. K-means clustering categorized genes into 20 groups of ~200 genes each with similar expression patterns. Genes associated with clustered branches were analyzed for enriched gene sets with GSEA. False discovery rate q values of enrichment were calculated for each gene set.
RNA-sequencing (RNA-seq) confirmed the undifferentiated (K5/K14) and differentiating (K1/K10) states of FACS populations (fig. S1D). Bioinformatic analyses uncovered dynamic temporal and spatial expression changes correlating with differentiation status (heat map, Fig. 1C). Gene set enrichment analyses (GSEAs) revealed proliferation and developmental processes in E10.5 basal progenitors, whereas highly differentiated, P4 granular cells were enriched for protein processing and lipid metabolism transcripts, reflective of their role in generating the lipid-rich skin barrier (category list, Fig. 1C). Comparative transcriptome analyses revealed gene cohorts specifically associated with the early transition from progenitor to committed states.
Screening for genes affecting growth versus differentiation
Because cancer is a disease in which the balance between progenitor and committed fate is disrupted, it was notable that 810 of the genes signifying this early committed state are mutated and/or aberrantly expressed in human and/or mouse epithelial cancers (table S1). To determine how these changes affect epidermal homeostasis, we designed a lentivirus-based RNA interference (RNAi) screen to identify which of these genes, when silenced in utero, affect the balance of undifferentiated to early differentiating epidermal cells at P4 (Fig. 2A).
Fig. 2. In vivo RNAi screen identifies genes that balance epidermal growth and differentiation.
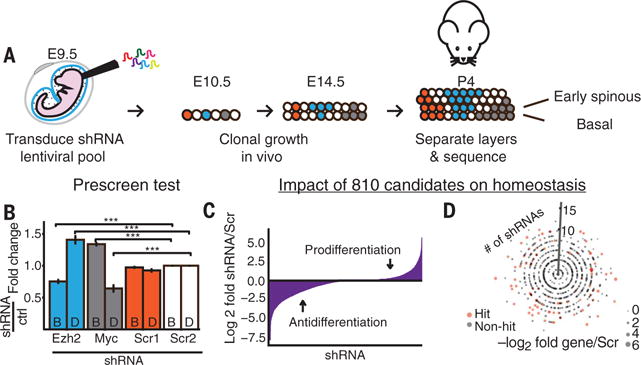
(A) RNAi screen strategy. E9.5 living embryos were transduced in utero with the RNAi lentiviral library. Colors denote examples where an RNAi confers an advantage over control (red) for differentiation (blue) or growth (gray). (B) RNAi-induced shifts in basal/early differentiation (B/D) patterns after in utero knockdown of the established epidermal regulators EZH2 (differentiation inhibitor) and MYC (differentiation promoter). ***P < 0.001, Student’s t test. Error bars show SEM. (C) In vivo screen results showing log2 clone size changes for each shRNA relative to Scrambled control clones for the progenitor→early differentiating progeny step. Screen identifies shRNAs with neutral, prodifferentiation, and antidifferentiation clone size alterations. (D) Impact of 810 cancer and differentiation–associated genes on epidermal homeostasis. Dot plot depicts each gene as a single dot and the number of shRNAs/gene showing a >2 log2 change indicated by the y-axis position. All four screen replicates are aggregated. Genes classified as “hits” are highlighted in pink; the size of the dot indicates the magnitude of fold change relative to shScr controls.
Our pooled lentiviral short hairpin RNA (shRNA) library targeting these 810 genes (more than two shRNAs per gene) was injected into the amniotic sacs of E9.5 mouse embryos such that ~15% of the single-layered surface epithelium became selectively, stably transduced by E10.5. Per replicate, the multiplicity of infection was <1 and coverage was >75 individual transductions per each shRNA-containing virus. By P4, each transduced basal progenitor will have divided six to seven times unless the shRNA confers a growth advantage or disadvantage, thereby affecting its clonal expansion (8).
From E14.5 to birth, the epidermis stratifies and differentiates. To screen for shRNAs that affect this process, we enzymatically dissociated P4 epidermis under conditions that enrich for basal and early differentiating progeny. Suspensions were then FACS-sorted as above, and genomic DNAs were subjected to high-throughput sequencing to determine the frequency of each shRNA in basal versus early differentiating progeny relative to control scrambled shRNAs. Control experiments depleting inhibitors (Ezh2) or promoters (Myc) of epidermal differentiation behaved as expected, as did Scrambled shRNAs (shScr) (Fig. 2B) (9, 10). After this validation, we then analyzed the screen, selecting hits based on whether at least two shRNAs consistently caused >2 log2 fold absolute magnitude deviation relative to shScr controls in the K5+K10−α6hi basal progenitors versus K5+K10+α6lo early suprabasal and/or basal differentiating cell populations. Eighty-seven genes met these stringent criteria across all replicates and were thus candidates for potential differentiation regulators (Fig. 2, C and D, and fig. S2A; highlighted in tables S1 and S2).
PEX11b: An unexpected screen hit
We validated the quantitative screen results by confirming shRNA knockdown efficiency and then interrogating individually several of the hits that showed striking deviations from control values. These shRNAs faithfully recapitulated predicted differentiation perturbations (fig. S2, B to D). We then further narrowed our focus to a small cohort of top candidates, where at least three shRNAs gave a consistent and potent imbalance of basal to suprabasal cells (fig. S2A and table S2). Of these, PEX11b was particularly intriguing. Three independent-hit shRNAs depleted Pex11b mRNA and protein. Moreover, the in vivo knockdown yielded pups with a similar phenotype, namely, a compromised skin barrier that failed to exclude blue dye (Fig. 3A and fig. S3, A and B).
Fig. 3. A peroxisome-associated protein as an unexpected regulator of epidermal growth and differentiation.
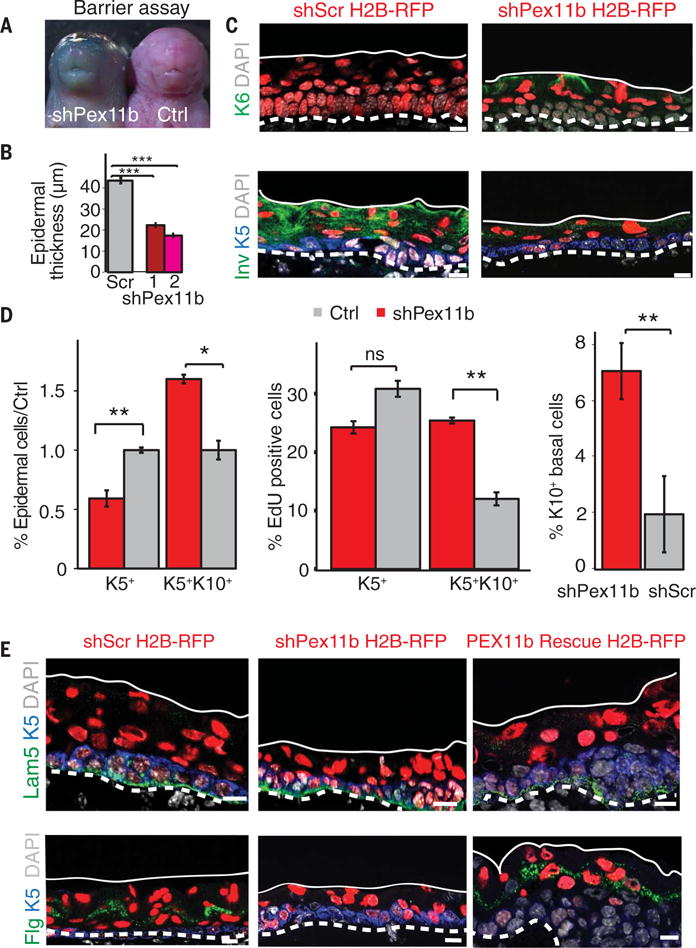
(A) Outside-in barrier assay, performed by determining the penetration of blue dye into the skin of the intact mouse pups, shows disrupted epidermal differentiation after loss of PEX11b. The presence of blue dye indicates incomplete barrier formation. The assay was performed on shPex11b (n = 8), control littermate, or shScr (n = 10) embryos at E18.5. (B) Epidermal thinning of back skin of shPex11b embryos at E16.5. Quantifications from two independent shRNAs targeting Pex11b. ***P < 0.001. (C) Alterations of epidermal markers after depletion of PEX11b in E16.5 epidermis. Immunolabeling shows ectopic expression of keratin 6 and loss of involucrin in shPex11b skin. Keratin 5 and 4′,6-diamidino-2-phenylindole (DAPI) were used to mark progenitors and chromatin. (D) Loss of PEX11b perturbs epidermal homeostasis. FACS quantification of differentiation status of shPex11b E16.5 epidermis. **P < 0.01, *P < 0.05, Student’s t test. Quantification of EdU-positive cells by FACS. Embryos were exposed to EdU for 1 to 3 hours before harvest. Note the increase of EdU-labeled K5+K10+ epidermal cells. Quantification of K10+ basal cells from epidermis immunolabeled for keratins 5 and 10. ns, not significant. (E) shPex11b-associated defects are rescued by a Pex11b cDNA refractory to shPex11b. Representative images from E16.5 sagittal sections immunolabeled for laminin 5, filaggrin, and keratin 5 from shScr, shPex11b, and shPex11b + Rescue embryos. Note rescue of epidermal thinning upon cDNA introduction. Scale bars, 10 μm. Dashed white lines mark the basement membrane, and solid white line marks the skin surface.
Histological analysis of E16.5 skin revealed epidermal thinning (22 ± 4 μm, shPex11b-1; 17 ± 4 μm, shPex11b-2; 44 ± 8 μm, shScrambled) (Fig. 3B). shPex11b epidermis displayed activation of the stress-induced marker keratin 6 and reduced terminal differentiation markers, including the cornified envelope protein involucrin (Inv) and the keratohyalin marker filaggrin (Flg) (Fig. 3, C to E). Perturbations within the basal epidermal layer included a decrease in K5+ progenitors and an increase in K5/K10+ early differentiating progeny, which were also proliferative (Fig. 3D). These defects were attributable directly to PEX11b deficiency, as normal morphology and gene expression were restored by introducing a hairpin-refractory Pex11b complementary DNA (cDNA) into shPex11b epidermal progenitors in utero (Fig. 3E).
PEX11b resides in the outer membrane of the peroxisome. It is a highly conserved peroxisome-associated protein implicated in peroxisome replication (11–25). Although not well studied in the epidermis, peroxisomes house the metabolic enzymes for H2O2 processing, fatty acid oxidation, ether lipid synthesis, and other tissue-specific metabolic functions (26, 27). Although loss of PEX11b results in only minor changes in lipid metabolism in yeast and mammalian cells (11, 18, 20, 22, 23), mutations in PEX11b can generate a peroxisomal disease phenotype in both mice and humans (24). Thus, although required for tissue function, PEX11b’s function in peroxisome biology likely resides outside the realm of metabolism.
A role for PEX11b outside peroxisome metabolism
To understand how PEX11b knockdown skews the balance between epidermal growth and differentiation, we placed its behavior in the context of two other peroxisome-associated proteins: PEX5, required for importing proteins into the peroxisome, and PEX19, which chaperones requisite proteins to the peroxisomal membrane (Fig. 4A) (28–31). Lentiviral-mediated RNAi knockdown of each of these PEX proteins resulted in a reduction in peroxisome numbers in the developing epidermis (Fig. 4B and fig. S3C). The vital role of PEX19 in peroxisome assembly and function was reflected in not only its more severe effect on peroxisome numbers but also its crippling effect on oxidase activity (contained within peroxisomes and mitochondria). By contrast, PEX11b-deficient epidermal progenitors still retained appreciable oxidase activity, as well as protein levels of the very long chain fatty acid metabolism enzyme ACOX1 and the oxidase CAT (catalase) (Fig. 4, C and D). In addition, shPex11b epidermal cells displayed fewer peroxisomes both in vivo and in vitro, with reduced organelle size (fig. S3, D to F).
Fig. 4. PEX11b balances epidermal growth and differentiation by a mechanism independent of peroxisome function.
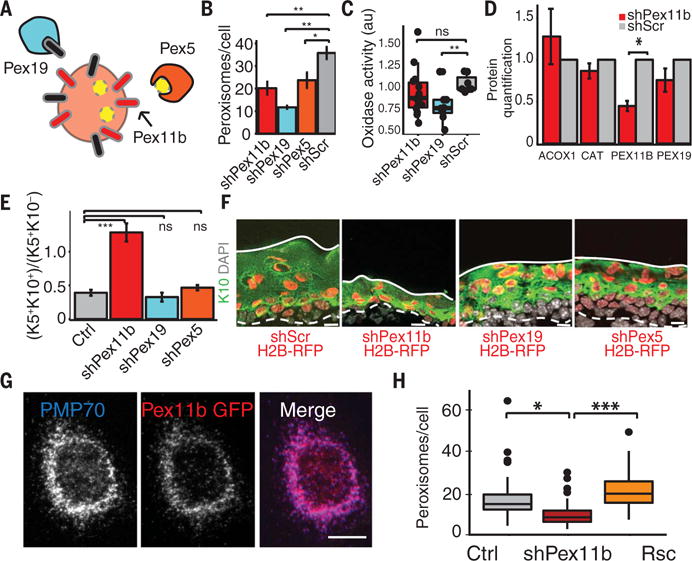
(A) Scheme of peroxisome protein functions. PEX19 chaperones and imports certain peroxisome membrane proteins; PEX5 recognizes the peroxisomal type 1 targeting sequence for the import of peroxisome proteins; and PEX11b resides in the outer peroxisome membrane and is implicated in peroxisome replication. (B) Loss of Pex5, Pex19, and Pex11b reduces keratinocyte peroxisome numbers. Quantification from 10MKs transduced with shRNAs. (C) shPex11b does not significantly change global oxidase activity levels, a measure of peroxisomal metabolic function. For (B) and (C), **P < 0.01; *P < 0.05. (D) Quantification of immunoblots for peroxisomal proteins shows that shPex11b does not cause a significant reduction of the peroxisomal matrix proteins ACOX1 and CATALASE or the peroxisomal membrane protein PEX19. (E) Pex11b-dependent alterations in epidermal homeostasis. FACS quantification of differentiation status of peroxin-depleted E16.5 epidermis. ***P < 0.001. (F) Images from E16.5 epidermis from peroxisomal knockdown embryos immunolabeled for keratins 5 and 10. (G) PEX11b localizes specifically to peroxisomes. 10MKs were transfected with a cDNA encoding a GFP-Pex11b fusion protein and immunolabeled at interphase for PMP70, a marker of peroxisomes. (H) Pex11b-dependent reductions in peroxisome number are rescued by PEX11b cDNA expression. Peroxisomes per cell per 0.5-μm epidermal Z section were counted for shPex11b, uninfected control, and GFP-Pex11b-Rescue epidermal cells. ***P < 0.001, *P < 0.05, unpaired Student’s t test. Scale bars, 10 μm.
Given the more potent effects of PEX19 depletion on peroxisome number and function, it was notable that this depletion did not cause the epidermal defects typifying PEX11b depletion (Fig. 4, E and F, and fig. S3, G and H). Moreover, as judged by immunoblot analyses, PEX19 depletion did not markedly affect PEX11B protein levels (fig. S3I). However, in agreement with its known singular role in peroxisome biology, a GFP-PEX11b fusion protein colocalized with peroxisomes (Fig. 4G) (13, 17). In addition, embryos transduced with shPex11b and shRNA-resistant Pex11b cDNA exhibited moderate to complete rescue not only of differentiation defects but also of peroxisome number deficits (Fig. 4H and fig. S3J). On the basis of these data, the imbalance in epidermal growth and differentiation caused by PEX11b depletion was likely rooted in some nonmetabolic aberration of peroxisomes.
A mitotic role for PEX11b
In all cells, peroxisomes reside and traffic on the cytoskeleton. In lower organisms, peroxisomes connect exclusively to the actin network, whereas in vertebrates, peroxisomes have been reported to associate primarily with microtubules (32–36). Probing deeper into the mechanism, we examined how peroxisomes are organized and localized within epidermal progenitors and their daughters, and whether peroxisomal organization might be altered in the absence of PEX11b. Exploiting the ability to culture primary keratinocytes (10MKs) from mouse skin epidermis, we monitored peroxisomal distribution throughout the cell cycle in vitro.
Wild-type interphase 10MKs distributed their peroxisomes along the microtubule network, with peroxisome density correlating with microtubule density throughout the cytoplasm of G1 cells (Fig. 5A). Although the number of peroxisomes was reduced by Pex11b knockdown, this did not eliminate their association with interphase microtubules. Confirming a PEX11b-independent peroxisomal-microtubule connection during interphase, treatment with the microtubule poison nocodazole resulted in a clear perturbation of the peroxisome network in 10MKs transduced with either Scr or Pex11b shRNAs (35).
Fig. 5. Alterations in organelle organization, inheritance, and spindle orientation when peroxisomes cannot localize to spindle poles during mitosis.
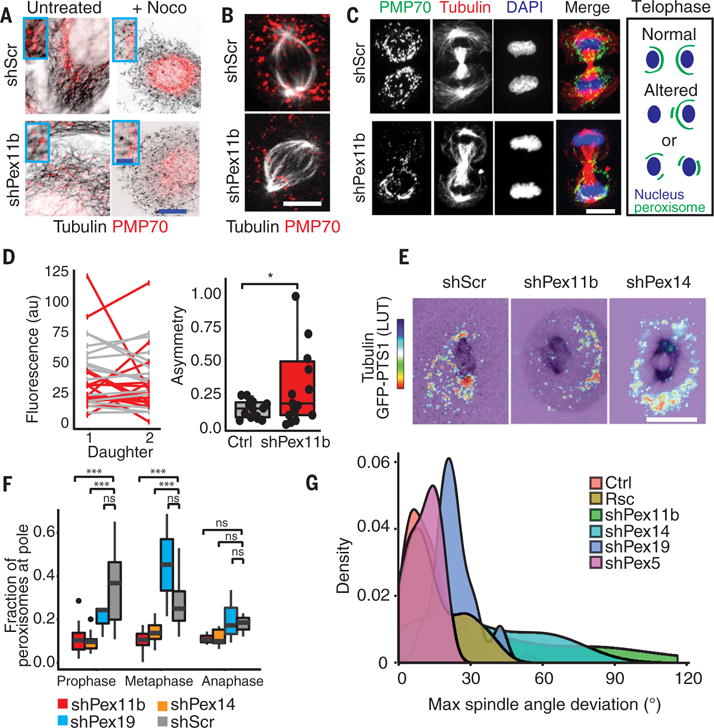
(A) Peroxisomes reside on microtubules. Interphase shScr and shPex11b keratinocytes immunolabeled for tubulin and PMP70. Images shown are before and after nocodazole treatment to disrupt microtubules. Higher magnifications are shown in insets. Scale bars, 10 μm (main panels); 2.5 μm (insets). (B) Metaphase cells immunolabeled for tubulin and PMP70 show that the spindle pole localization of peroxisomes in shScr cells is lost in shPex11b cells. Scale bar, 10 μm. (C) shPex11b-dependent peroxisome mislocalization and altered inheritance seen in representative images of late-stage mitotic keratinocytes. Cells were immunolabeled for the peroxisomal marker PMP70, tubulin to mark spindles, and DAPI to mark chromatin. Schematic depicts changes in peroxisome positions seen during telophase. Scale bar, 10 μm. (D) Asymmetric peroxisome partitioning after loss of PEX11b. Line plot of PMP70 fluorescence levels in telophase shPex11b (red) and shScr (gray) daughter cells. Note the increased slope of shPex11b pairs indicating unequal amounts of peroxisomes partitioned into daughter cells. (Right) Quantification of asymmetry [(Daughter 1 − Daughter 2)/Total] from telophase pairs. Note increased asymmetry in shPex11b divisions. *P < 0.05, Student’s t test. (E) Spindle pole enrichment of peroxisomes during mitosis. In shScr cells, peroxisomes cluster at spindle poles. This localization is lost after depletion of Pex11b or Pex14. Still images from time-lapse movies of keratinocytes with fluorescent-labeled tubulin and peroxisomal-targeted GFP. Thermal LUT for GFP-PTS1 indicates intensity of fluorescence, with red→blue indicating high→low. Scale bar, 10 μm. (F) Quantification of fraction of total cellular peroxisomes localized at spindle pole regions during early mitosis. In shScr keratinocytes, 35% of all peroxisomes localize to spindle poles in prophase. This association decreases and is lost by anaphase. By contrast, shPex14 and shPex11b keratinocytes fail to associate peroxisomes with spindle poles. ***P < 0.001. (G) Loss of Pex11b and Pex14 results in larger spindle angle movements during mitosis, indicating a defect in the ability to align the spindle. Measurement of size of spindle angle deviations from starting position from time-lapse imaging of mitotic cells. Mathematically smoothed histogram (density plot) of spindle angles quantified from time-lapse imaging of shPex11b and shScr keratinocytes. Note that distribution of shPex11b spindle angles is broader and with a higher maximum than controls. Loss of Pex14 results in large spindle angle movements. P < 0.001, Student’s t test of significance between shScr and shPex11b. shPex11b, n = 18; shScr, n = 34; shPex11b + Rsc, n = 17; shPex5, n = 12; shPex19, n = 10; shPex14, n = 11. Note that alterations arising from shPex11b are rescued by expression of an shRNA-resistant Pex11b cDNA. Note also that loss of Pex5 and Pex19 does not cause alterations in spindle behavior.
During early mitosis in wild-type keratinocytes, peroxisomes maintained an association with the microtubule network, but they typically clustered around the spindle poles (Fig. 5B). During telophase, peroxisomes reorganized, surrounding the nuclei of each daughter cell and forming sharp arcs away from the midbody (Fig. 5C). This stereotyped localization of mitotic peroxisomes was consistent with the microtubule dependency of organelle segregation during mitosis (37–42) and resembled that described for transformed cell lines and yeast (40, 41).
In contrast, peroxisomes in PEX11b-deficient keratinocytes failed to associate with the spindle poles in early mitotic cells (Fig. 5B). In addition, during later stages of mitosis, peroxisomes failed to organize and segregate equivalently in daughter cells (Fig. 5, C and D). This was in contrast with other organelles, including mitochondria and Golgi, which segregated evenly in shPex11b 10MKs (fig. S4). Finally, because no obvious aberrations were seen in the actin or microtubule cytoskeletons, our data suggested that PEX11b deficiency resulted in a selective perturbation in peroxisomal organization specifically during the mitotic phase of the cell cycle.
PEX11b and spindle alignment
To further examine these positional changes, we depleted the peroxisome-associated protein PEX14, which has been reported to mediate attachment between peroxisomes and microtubules (42). In interphase, the peroxisomes of shPex14 keratinocytes clustered unevenly throughout the cell. Similar to what we observed upon Pex11b knockdown and in contrast to what was observed in shScr, shPex5, or shPex19 keratinocytes, peroxisomes in mitotic shPex14 cells failed to associate with the spindle poles during early mitosis and instead adopted a more cortical position (Fig. 5, E and F, and fig. S5A). Moreover, this mislocalization resulted in deviations in spindle alignment, providing compelling evidence for a mitotic requirement for peroxisome association to microtubules in general and to spindle poles in particular (Fig. 5G).
Spindle orientation plays a critical role in establishing epidermal tissue architecture and homeostasis, both in postnatal epidermis and in embryogenesis (2, 3, 6, 7). Given the imbalance in epidermal differentiation and proliferation in the PEX11b-deficient skin, we examined the epidermis for changes in the quantity of cell divisions, where daughter cells take on different fates. In contrast to the perpendicular or oblique division angles seen in ~50% of wild-type E16.5 epidermal progenitors, most (Survivin-marked) late-anaphase spindles in shPex11b epidermis were parallel relative to the underlying basement membrane (Fig. 6A). The skew toward parallel divisions was visually evident through ImageStream capture of late telogen-phase cell doublets, whose daughters were both marked by integrins (Fig. 6B). Because perpendicular cell divisions expand the stratified layers at this stage of development, their notable absence explained the reduction in the thickness of shPex11b-transduced epidermis.
Fig. 6. Failed peroxisome localization to spindle poles leads to failed association of NuMA with the ACD machinery.
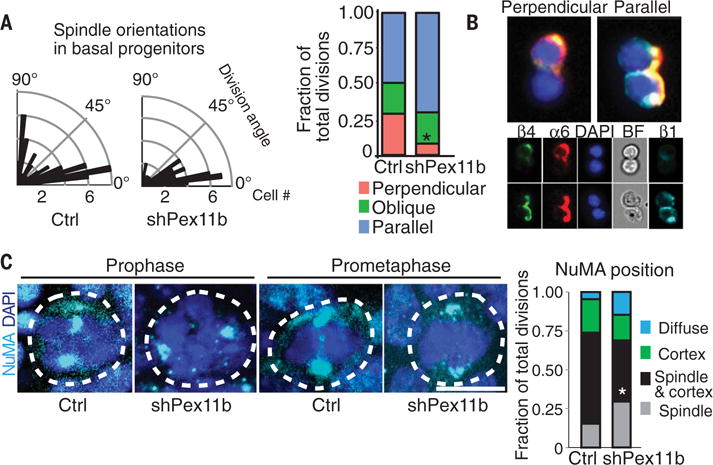
(A) Radial histograms of division angles of E16.5 basal epidermal progenitors relative to the basement membrane, showing that shPex11b results in a marked decrease in perpendicular divisions. Length of black bars represents the number of mitoses showing particular division angle. Uninfected (Ctrl), n = 50; shPex11b, n = 71. Bar plot of division angle classifications for E16.5 epidermal division angles. Perpendicular divisions = 90° to 65°, oblique divisions = 30° to 65°, parallel divisions = 0° to 30°. *P < 0.05, χ2 test. (B) ImageStream of late-stage mitotic cells distinguishes between perpendicular and parallel epidermal divisions. ImageStream X FACS of isolated keratinocytes from E17.5 epidermis, analyzed for α6 integrin, β4 integrin, β1 integrin, and DAPI. (C) Representative images of early mitotic basal progenitors (white dashed lines) from E17.5 sagittal skin sections. Immunolabeling of mitotic cells is for NuMA (cyan), which is typically associated with spindle poles and also the apical LGN cortical crescent. DNA is shown in blue. Scale bar, 10 μm. Note the selective loss of apical cortical NuMA in the shPex11b cells. Bar plot shows quantification of changes in NuMA position. *P < 0.05.
The alteration in spindle orientation was accompanied by perturbations in the NuMA-mediated perpendicular asymmetric cell divisions (ACDs) that occur at this time. Normally during mitosis, the microtubule-binding protein NuMA localizes both to the spindle poles and to the apical portion of the cell. At the cell apex, NuMA interacts with the cortical crescent of LGN, an epidermal protein necessary to link the Par3/aPKC polarity complex with astral microtubules to achieve proper spindle orientation (7, 43–46). However, in shPex11b knockdown epidermis, NuMA was markedly reduced at cortical crescents with a concomitant rise in diffusely distributed NuMA (Fig. 6C). Immunoblot analyses showed that overall NuMA levels were largely unaffected, indicating a defect in organization rather than expression (fig. S5B). When an angle was drawn between the center of the cortical LGN crescent and the spindle axis, E16.5 shPex11b basal cells exhibited a larger angle than did control cells, indicative of spindle-crescent uncoupling and deviation from a perpendicular cell division (fig. S5C). This was further corroborated by immunofluorescence, showing that even when cortical, NuMA often failed to overlap with LGN in PEX11b-depleted cells (fig. S5D). These findings were interesting because in shNuma knockdown epidermis, severe perturbations in spindle orientation, ACDs, and differentiation arise (2).
PEX11b deficiency and uncontrolled spindle rotations
To further explore the perturbations observed during mitosis upon Pex11b knockdown, we turned to live imaging. We transduced shPex11b 10MKs with mCherry-tubulin to label spindles and pKrt14-H2BGFP to label chromosomes. Time-lapse imaging revealed that compared to control cells, which spent an average of 69 ± 24 min in mitosis, shPex11b keratinocytes spent 118 ± 47 min in mitosis (Fig. 7, A and B). shPex11b cells had an increase in mitotic abnormalities, including mitotic delays accompanied by rotating spindles and enlarged metaphase plates (Fig. 7, A to C, and movies S1 and S2).
Fig. 7. Spindle rotations and mitotic delays after loss of PEX11b.
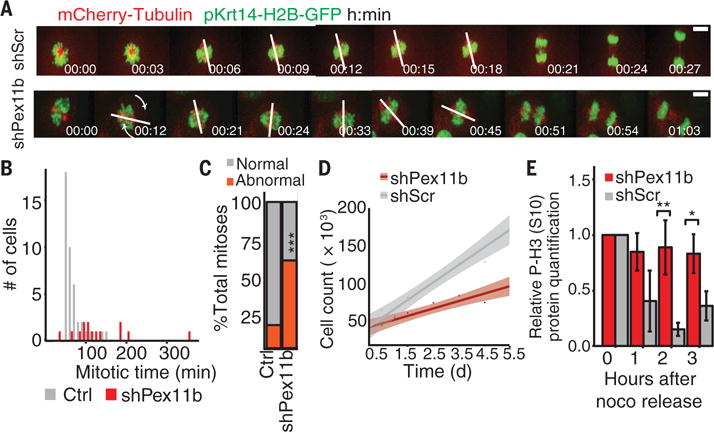
(A) shPex11b-induced uncontrolled spindle rotations with increased mitotic time seen via time-lapse imaging. Spindle angle is shown with a white line and defined as the maximum angle formed between the spindle orientation at the start of video microscopy and the spindle orientation of the particular image taken later during mitosis. Scale bar, 10 μm. (B) Histogram of data from time-lapse imaging of keratinocytes shows slowed mitotic progression (from chromosome condensation to nuclei decondensation) of shPex11b (n = 18) cells relative to shScr (n = 32) control cells. (C) Increased abnormal mitotic outcomes assessed with time-lapse imaging of shPex11b and shScr 10MKs. ***P < 0.001, χ2 test. (D) Delayed keratinocyte expansion in shPex11b cultures after 5.5 days of in vitro growth. (E) shPex11b 10MKs remain in mitosis after cells were treated with nocodazole and then released. Cell lysates were collected hourly for immunoblot analysis of the mitotic marker P-H3(S10). **P < 0.01, *P < 0.05, Student’s t test.
Turning to the consequences of defective peroxisomal localization and the associated changes in mitosis, we found that keratinocyte growth was diminished in vitro and G2-M–phase cells were increased by E16.5 in vivo (Fig. 7D and fig. S5E). shPex11b keratinocytes also held more cells in G2-M after a double thymidine block and release (fig. S5, F and G). Further exploring the presence of a mitotic delay, cells were monitored for recovery after exposure to the microtubule inhibitor nocodazole. After removal of nocodazole, control cells rapidly exited mitosis, whereas shPex11b keratinocytes maintained high levels of the mitotic marker Ser10-phosphorylated histone H3 [P-H3(S10)] for 2 to 3 hours longer (Fig. 7E). Despite a 1.75-fold increase in keratinocytes with >4N DNA content in vivo, most shPex11b cells progressed through mitosis (fig. S5H). Apoptosis after mitosis was also minimal, as judged by the few caspase-3+ cells within E16.5 shPex11b epidermis (0.14% versus 0.08%, P = 0.54) (fig. S5I). By contrast, PEX5 and PEX19 depletion caused enhanced apoptosis without alterations in S or G2-M populations (fig. S5J). Thus, the imbalance in growth and differentiation caused by PEX11b depletion likely arose from a mitotic delay rather than cell death.
Linking PEX11b, peroxisomes, spindle rotations, and epidermal growth/differentiation
The spindle rotations and NuMA mislocalization seen in PEX11b-deficient keratinocytes were particularly intriguing in light of recent studies showing that when NuMA fails to be phosphorylated by the mitotic kinase Aurora-A, spindles also rotate excessively (44). The shared location of peroxisomes and NuMA at spindle poles in wild-type cells, coupled with the aberrant presence of peroxisomes and NuMA loss at the cortex, suggests that proper peroxisomal localization may be necessary for NuMA to be modified and move from the poles to the cortex. In addition, the shPex11b-induced cell cycle delay was notable given that cell cycle progression has been observed to stall upon the inability to fragment Golgi or to segregate mitochondria during mitosis (37, 47–49). Together, these findings raise the intriguing prospect that there might be a mitotic checkpoint for organelle localization as well as segregation, and that peroxisome mislocalization is sufficient to trigger it.
To further test these hypotheses, we first showed that the mitotic delay could be triggered not only by PEX11b depletion but also by PEX14 depletion (Fig. 8A). Because this did not happen in shPex5- or shPex19-transduced cells (fig. S5J), the link between peroxisome mislocalization and mitotic delay was strengthened. To further explore this link, we also used an optogenetic system to move peroxisomes along the microtubules of living cells. We used a photosensitive protein-protein binding system to couple mRFP-labeled peroxisomes to various microtubule motor segments. Upon exposure to blue light, these two proteins bound, and peroxisomes were forced to move along microtubules (50–52).
Fig. 8. Mislocalization of peroxisomes alters mitotic progression.
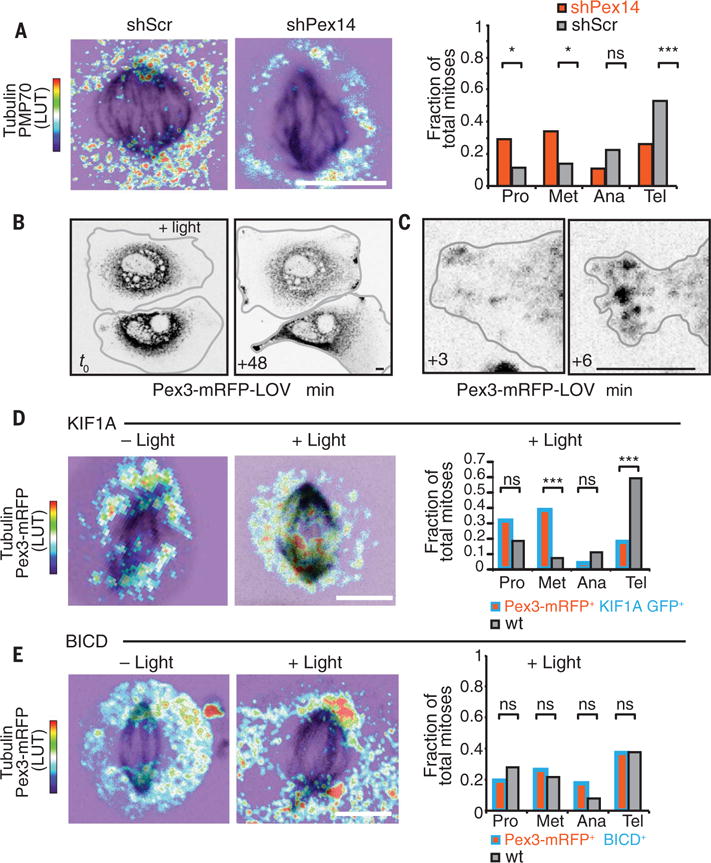
(A) shPex14 keratinocytes uncouple peroxisomes from microtubules, resulting in higher proportions of cells in early mitosis and reduced late mitotic cells relative to shScr cells. Maximal projections of z stack of the entire cell are shown with immunolabeling for tubulin and PMP70. Thermal LUT for PMP70 indicates fluorescence intensity of the peroxisome marker PMP70, with red→blue indicating high→low. ***P < 0.001; *P < 0.05. (B to D) Light-induced ectopic movements of peroxisomes in interphase [(B) and (C)] or in mitotic (D) keratinocytes transfected with Pex3-mRFP-LOVand KIF1A-GFP-ePDZ1b. Time-lapse imaging was for up to an hour [(B) and (D)] or 6 min (C) after light-induced coupling of peroxisomes to the plus-end microtubule motor (KIF1A). Note that even within minutes after photoactivation, peroxisomes move to cortical sites of interphase cells, where the plus ends of microtubules reside. Note that in mitotic cells, plus ends of microtubules reside at the spindle midzone, shifting the localization of peroxisomes. Maximal projections of z stack of the entire cell are shown with immunolabeling for tubulin and fluorescence of Pex3-mRFP-LOV. Thermal LUT for Pex3-mRFP-LOV indicates intensity of fluorescence, with red→blue indicating high→low. Bar plot shows proportions of cells in each part of mitosis. Cells with ectopic association between spindle midzone and peroxisomes have higher proportions of cells in early mitosis and reduced late mitotic cells relative to light-exposed neighbor cells. For (D), ***P < 0.001. (E) Light-induced peroxisome movement to spindle poles via coupling of Pex3-mRFP-LOV and BICD-ePDZ1b, a minus-end microtubule motor segment. Maximal projections of z stack of the entire cell are shown with immunolabeling for tubulin and fluorescence of Pex3-mRFP-LOV. Thermal LUT for Pex3-mRFP-LOV indicates intensity of fluorescence, with red→blue indicating high→low. Cells with enhanced peroxisomes at spindle poles show similar proportions as untransfected controls of cells in each phase of mitosis. Bar plot shows proportions of cells in each part of mitosis. Scale bars, 10 μm (all panels).
We first used a kinesin-3 motor segment to redirect peroxisomes to the plus ends of microtubules, which, in interphase keratinocytes, reside at the cell cortex. By 48 min, most of the peroxisomes had redistributed in this manner (Fig. 8B). Investigation on a shorter time scale revealed that the reorganization was fast, happening within minutes after light activation (Fig. 8C). This made it possible to photoactivate at the start of mitosis, move peroxisomes along microtubules to new locations, and then examine the consequences. With the kinesin-3 motor segment, peroxisomes concentrated aberrantly at plus-end interpolar spindle microtubules at the midzone (Fig. 8D). Spindle-associated peroxisomes increased by more than two times after light activation. After 1 hour, light exposure resulted in an increase in metaphase and decrease in telophase cells, although similar total numbers of mitoses were observed. Time-lapse imaging of individual light-exposed mitoses showed delayed mitotic progress upon ectopic peroxisome redistribution (Fig. 8D and fig. S6, A to C), similar to that seen upon PEX11b depletion.
By contrast, when we used a similar construct but with the minus-end motor dynein, peroxisomes still localized to microtubules, but now they concentrated at the minus-end microtubules of the spindle poles. Although peroxisomes normally localize to spindle poles in early mitosis, in the photosensitized keratinocytes, peroxisome density at spindle poles was not only increased but also sustained through later phases in mitosis (Fig. 8E). Notably, mitotic progression appeared to proceed normally despite these alterations (Fig. 8E). These data suggest that it is not only concentration of peroxisomes on the spindle per se that interferes with mitotic progression but also their mislocalization to the spindle midzone rather than the poles.
Discussion
In summary, our transcriptional profiling and RNAi screen guided us to a role for organelle inheritance in controlling the balance between growth and differentiation. In addition, we learned that peroxisome-associated PEX11b functions in governing peroxisome partitioning into epidermal daughter cells. When a single organelle type, in this case, the peroxisome, was redirected away from the spindle poles to either the cortex or spindle midzone, a checkpoint-like state was elicited, associated with mitotic delays.
Our discovery comes on the heels of a quite different but related in vitro observation that old mitochondria are segregated into the differentiating daughter of a mammary stem cell division (53). Together, these findings underscore the importance of organelle organization during mitosis and organelle inheritance in stem cell biology. Our data suggest that progenitors know how not only to couple organelles to the mitotic machinery but also to trigger a checkpoint when proper coupling fails. As our study reveals, for stem cell progenitors that divide asymmetrically and in a polarized fashion to establish tissue architecture, the consequences of inappropriate organelle localization during mitosis can be particularly dire. The perturbations likely arise in part from physical interference of misplaced organelles with the spindle orientation machinery and in part from aberrations in organelle segregation and inheritance. For the epidermis, these perturbations associated with peroxisome mislocalization were accompanied by mixed messages to resulting basal daughters, displaying differentiation markers but still proliferating, features typically associated with cancer.
Methods summary
Mice were housed and cared for in an AAALAC-accredited facility, and all animal experiments were conducted in accordance with IACUC-approved protocols. Panels showing shPex11b include average values for 2–3 shRNAs targeting Pex11b. For viral infections, keratinocytes were plated in 6-well dishes at 100,000 cells per well and incubated with lentivirus in the presence of polybrene (100 μg ml−1). After 2 days, we positively selected infected cells with puromycin (1 μg ml−1) for 4–7 days, and processed them for mRNA and protein analyses. CD1 mice were used for single gene knockdown experiments. The screen was performed in a C57/Bl6 background with 4 biological replicates of 6–10 pups each. shRNAs included in the screen and for all knockdown experiments are from Sigma TRC 1.0 or 1.5 mouse library. Based on a library targeting ~810 genes, each screen replicate had a coverage of >75X.
We used noninvasive, ultrasound-guided in utero lentiviral-mediated delivery of RNAi, which selectively transduces single-layered surface ectoderm of living E9.5 mouse embryos as previously described (54). All shRNAs were obtained from The Broad Institute’s Mission TRC-1 mouse library, and were present in the pLKO.1 lentiviral backbone, which harbors a puromycin-resistance cassette. shRNA sequences were cloned from the library vectors into our modified pLKO H2B-mRFP1, H2B-YFP, or H2B-CFP vectors and high-titer lentivirus was produced as previously described (54).
KIF1A-GFP-ePDZb1, PEX3-mRFP-LOV, and BICD-ePDZb1 plasmids were a generous gift from C. Kapitein of Utrecht University (Netherlands). Plasmids were transiently cotransfected into keratinocytes using Effectene transfection reagent (Qiagen) and incubated with SIR-tubulin (Cytoskeleton) to mark microtubules. Light activation was performed as previously described (47). Briefly, for wide field activation cells were exposed to blue spectrum light at intervals of 60–300s. Sequential imaging was taken of additional channels of interest. Early mitotic cells were found using early spindle formation as a marker, then cells were exposed to blue light and a z-series was acquired at 2-minute intervals for the next 1–2 hours. For subsequent immunostaining, 35-mm plates were pulsed in temperature/CO2 control chamber with blue light or kept in complete dark for 1 hour time course. Full materials and methods are available in supplemental materials.
Supplementary Material
Acknowledgments
We thank S. Mazel and the Rockefeller University FACS facility for assistance in cell sorting, and C. Lai for assistance in high-throughput sequencing (Rockefeller University Genomics Resource Center). We thank E.F. lab members D. Oristian, M. Sribour, and L. Polak for assistance in mouse research; H. A. Pasolli for ultrastructure; M. Nikolova, J. Racelis, and E. Wong for technical assistance; S. Chai for generating and testing the K10RFP mice; and B. Keyes, I. Matos, S. Beronja, and E. Heller for discussions and suggestions. A.A. was supported by a Medical Scientist Training Program grant from the NIH under award number T32GM007739, National Cancer Institute Ruth L. Kirschstein National Research Service Award for Individual Predoctoral Fellows (F31CA180724-03), and a United Negro College Fund/Merck Science Initiative Graduate Fellowship. E.F. is a Howard Hughes Medical Institute Investigator. This work was supported by grants from the NIH (R37-AR27883 to E.F.). RNA-seq data are deposited in the Gene Expression Omnibus database under accession number GSE75931. Correspondence and requests for materials should be addressed to E.F. All reagents engineered in the course of this study are available from jdelacruz@rockefeller.edu under a material transfer agreement with the Rockefeller University. Plasmids are available from jdelacruz@rockefeller.edu under a material transfer agreement with Rockefeller University. Author contributions: A.A. and E.F. conceived the project, designed the experiments, and wrote the manuscript. A.A. performed the experiments. J.L. carried out key in utero lentiviral injections in the final 18 months of this project.
Footnotes
The authors declare no competing financial interests.
SUPPLEMENTARY MATERIALS
www.sciencemag.org/content/355/6324/eaah4701/suppl/DC1
Materials and Methods
References (55–58)
REFERENCES AND NOTES
- 1.Fuchs E. Finding one’s niche in the skin. Cell Stem Cell. 2009;4:499–502. doi: 10.1016/j.stem.2009.05.001. [DOI] [PMC free article] [PubMed] [Google Scholar]
- 2.Williams SE, Beronja S, Pasolli HA, Fuchs E. Asymmetric cell divisions promote Notch-dependent epidermal differentiation. Nature. 2011;470:353–358. doi: 10.1038/nature09793. [DOI] [PMC free article] [PubMed] [Google Scholar]
- 3.Lechler T, Fuchs E. Asymmetric cell divisions promote stratification and differentiation of mammalian skin. Nature. 2005;437:275–280. doi: 10.1038/nature03922. [DOI] [PMC free article] [PubMed] [Google Scholar]
- 4.Habib SJ, Chen BC, Tsai FC, Anastassiadis K, Meyer T, Betzig E, Nusse R. A localized Wnt signal orients asymmetric stem cell division in vitro. Science. 2013;339:1445–1448. doi: 10.1126/science.1231077. [DOI] [PMC free article] [PubMed] [Google Scholar]
- 5.Blanpain C, Lowry WE, Pasolli HA, Fuchs E. Canonical notch signaling functions as a commitment switch in the epidermal lineage. Genes Dev. 2006;20:3022–3035. doi: 10.1101/gad.1477606. [DOI] [PMC free article] [PubMed] [Google Scholar]
- 6.Niessen MT, Scott J, Zielinski JG, Vorhagen S, Sotiropoulou PA, Blanpain C, Leitges M, Niessen CM. aPKCl controls epidermal homeostasis and stem cell fate through regulation of division orientation. J Cell Biol. 2013;202:887–900. doi: 10.1083/jcb.201307001. [DOI] [PMC free article] [PubMed] [Google Scholar]
- 7.Clayton E, Doupé DP, Klein AM, Winton DJ, Simons BD, Jones PH. A single type of progenitor cell maintains normal epidermis. Nature. 2007;446:185–189. doi: 10.1038/nature05574. [DOI] [PubMed] [Google Scholar]
- 8.Beronja S, Janki P, Heller E, Lien WH, Keyes BE, Oshimori N, Fuchs E. RNAi screens in mice identify physiological regulators of oncogenic growth. Nature. 2013;501:185–190. doi: 10.1038/nature12464. [DOI] [PMC free article] [PubMed] [Google Scholar]
- 9.Ezhkova E, Pasolli HA, Parker JS, Stokes N, Su I-h, Hannon G, Tarakhovsky A, Fuchs E. Ezh2 orchestrates gene expression for the stepwise differentiation of tissue-specific stem cells. Cell. 2009;136:1122–1135. doi: 10.1016/j.cell.2008.12.043. [DOI] [PMC free article] [PubMed] [Google Scholar]
- 10.Gandarillas A, Watt FM. c-Myc promotes differentiation of human epidermal stem cells. Genes Dev. 1997;11:2869–2882. doi: 10.1101/gad.11.21.2869. [DOI] [PMC free article] [PubMed] [Google Scholar]
- 11.Li X, Gould SJ. PEX11 promotes peroxisome division independently of peroxisome metabolism. J Cell Biol. 2002;156:643–651. doi: 10.1083/jcb.200112028. [DOI] [PMC free article] [PubMed] [Google Scholar]
- 12.Abe I, Okumoto K, Tamura S, Fujiki Y. Clofibrate-inducible, 28-kDa peroxisomal integral membrane protein is encoded by PEX11. FEBS Lett. 1998;431:468–472. doi: 10.1016/S0014-57939800815-1. [DOI] [PubMed] [Google Scholar]
- 13.Koch J, Pranjic K, Huber A, Ellinger A, Hartig A, Kragler F, Brocard C. PEX11 family members are membrane elongation factors that coordinate peroxisome proliferation and maintenance. J Cell Sci. 2010;123:3389–3400. doi: 10.1242/jcs.064907. [DOI] [PubMed] [Google Scholar]
- 14.Kobayashi S, Tanaka A, Fujiki Y. Fis1, DLP1, and Pex11p coordinately regulate peroxisome morphogenesis. Exp Cell Res. 2007;313:1675–1686. doi: 10.1016/j.yexcr.2007.02.028. [DOI] [PubMed] [Google Scholar]
- 15.Fox MA, Walsh LA, Nieuwesteeg M, Damjanovski S. PEX11β induces peroxisomal gene expression and alters peroxisome number during early Xenopus laevis development. BMC Dev Biol. 2011;11:24. doi: 10.1186/1471-213X-11-24. [DOI] [PMC free article] [PubMed] [Google Scholar]
- 16.Schrader M, Reuber BE, Morrell JC, Jimenez-Sanchez G, Obie C, Stroh TA, Valle D, Schroer TA, Gould SJ. Expression of PEX11β mediates peroxisome proliferation in the absence of extracellular stimuli. J Biol Chem. 1998;273:29607–29614. doi: 10.1074/jbc.273.45.29607. [DOI] [PubMed] [Google Scholar]
- 17.Delille HK, Agricola B, Guimaraes SC, Borta H, Lüers GH, Fransen M, Schrader M. Pex11pβ-mediated growth and division of mammalian peroxisomes follows a maturation pathway. J Cell Sci. 2010;123:2750–2762. doi: 10.1242/jcs.062109. [DOI] [PubMed] [Google Scholar]
- 18.Orth T, Reumann S, Zhang X, Fan J, Wenzel D, Quan S, Hu J. The PEROXIN11 protein family controls peroxisome proliferation in Arabidopsis. Plant Cell. 2007;19:333–350. doi: 10.1105/tpc.106.045831. [DOI] [PMC free article] [PubMed] [Google Scholar]
- 19.Marshall PA, Krimkevich YI, Lark RH, Dyer JM, Veenhuis M, Goodman JM. Pmp27 promotes peroxisomal proliferation. J Cell Biol. 1995;129:345–355. doi: 10.1083/jcb.129.2.345. [DOI] [PMC free article] [PubMed] [Google Scholar]
- 20.Sakai Y, Marshall PA, Saiganji A, Takabe K, Saiki H, Kato N, Goodman JM. The Candida boidinii peroxisomal membrane protein Pmp30 has a role in peroxisomal proliferation and is functionally homologous to Pmp27 from Saccharomyces cerevisiae. J Bacteriol. 1995;177:6773–6781. doi: 10.1128/jb.177.23.6773-6781.1995. [DOI] [PMC free article] [PubMed] [Google Scholar]
- 21.Lazarow PB, Fujiki Y. Biogenesis of peroxisomes. Annu Rev Cell Biol. 1985;1:489–530. doi: 10.1146/annurev.cb.01.110185.002421. [DOI] [PubMed] [Google Scholar]
- 22.Ahlemeyer B, Gottwald M, Baumgart-Vogt E. Deletion of a single allele of the Pex11β gene is sufficient to cause oxidative stress, delayed differentiation and neuronal death in mouse brain. Dis Model Mech. 2012;5:125–140. doi: 10.1242/dmm.007708. [DOI] [PMC free article] [PubMed] [Google Scholar]
- 23.Li X, Baumgart E, Morrell JC, Jimenez-Sanchez G, Valle D, Gould SJ. Pex11β deficiency is lethal and impairs neuronal migration but does not abrogate peroxisome function. Mol Cell Biol. 2002;22:4358–4365. doi: 10.1128/MCB.22.12.4358-4365.2002. [DOI] [PMC free article] [PubMed] [Google Scholar]
- 24.Ebberink MS, Koster J, Visser G, van Spronsen F, Stolte-Dijkstra I, Smit GPA, Fock JM, Kemp S, Wanders RJA, Waterham HR. A novel defect of peroxisome division due to a homozygous non-sense mutation in the PEX11β gene. J Med Genet. 2012;49:307–313. doi: 10.1136/jmedgenet-2012-100778. [DOI] [PubMed] [Google Scholar]
- 25.Krikken AM, Veenhuis M, van der Klei IJ. Hansenula polymorpha pex11 cells are affected in peroxisome retention. FEBS J. 2009;276:1429–1439. doi: 10.1111/j.1742-4658.2009.06883.x. [DOI] [PubMed] [Google Scholar]
- 26.Huyghe S, Casteels M, Janssen A, Meulders L, Mannaerts GP, Declercq PE, Van Veldhoven PP, Baes M. Prenatal and postnatal development of peroxisomal lipid-metabolizing pathways in the mouse. Biochem J. 2001;353:673–680. doi: 10.1042/bj3530673. [DOI] [PMC free article] [PubMed] [Google Scholar]
- 27.Janssen A, Baes M, Gressens P, Mannaerts GP, Declercq P, Van Veldhoven PP. Docosahexaenoic acid deficit is not a major pathogenic factor in peroxisome-deficient mice. Lab Invest. 2000;80:31–35. doi: 10.1038/labinvest.3780005. [DOI] [PubMed] [Google Scholar]
- 28.Jones JM, Morrell JC, Gould SJ. PEX19 is a predominantly cytosolic chaperone and import receptor for class 1 peroxisomal membrane proteins. J Cell Biol. 2004;164:57–67. doi: 10.1083/jcb.200304111. [DOI] [PMC free article] [PubMed] [Google Scholar]
- 29.Götte K, Girzalsky W, Linkert M, Baumgart E, Kammerer S, Kunau W-H, Erdmann R. Pex19p, a farnesylated protein essential for peroxisome biogenesis. Mol Cell Biol. 1998;18:616–628. doi: 10.1128/MCB.18.1.616. [DOI] [PMC free article] [PubMed] [Google Scholar]
- 30.Matsuzono Y, Kinoshita N, Tamura S, Shimozawa N, Hamasaki M, Ghaedi K, Wanders RJA, Suzuki Y, Kondo N, Fujiki Y. Human PEX19: cDNA cloning by functional complementation, mutation analysis in a patient with Zellweger syndrome, and potential role in peroxisomal membrane assembly. Proc Natl Acad Sci USA. 1999;96:2116–2121. doi: 10.1073/pnas.96.5.2116. [DOI] [PMC free article] [PubMed] [Google Scholar]
- 31.Sacksteder KA, Jones JM, South ST, Li X, Liu Y, Gould SJ. PEX19 binds multiple peroxisomal membrane proteins, is predominantly cytoplasmic, and is required for peroxisome membrane synthesis. J Cell Biol. 2000;148:931–944. doi: 10.1083/jcb.148.5.931. [DOI] [PMC free article] [PubMed] [Google Scholar]
- 32.Mathur J, Mathur N, Hülskamp M. Simultaneous visualization of peroxisomes and cytoskeletal elements reveals actin and not microtubule-based peroxisome motility in plants. Plant Physiol. 2002;128:1031–1045. doi: 10.1104/pp.011018. [DOI] [PMC free article] [PubMed] [Google Scholar]
- 33.Schrader M, King SJ, Stroh TA, Schroer TA. Real time imaging reveals a peroxisomal reticulum in living cells. J Cell Sci. 2000;113(Pt. 20)(3663–3671) doi: 10.1242/jcs.113.20.3663. [DOI] [PubMed] [Google Scholar]
- 34.Schollenberger L, Gronemeyer T, Huber CM, Lay D, Wiese S, Meyer HE, Warscheid B, Saffrich R, Peränen J, Gorgas K, Just WW. RhoA regulates peroxisome association to microtubules and the actin cytoskeleton. PLOS ONE. 2010;5:e13886. doi: 10.1371/journal.pone.0013886. [DOI] [PMC free article] [PubMed] [Google Scholar]
- 35.Wiemer EAC, Wenzel T, Deerinck TJ, Ellisman MH, Subramani S. Visualization of the peroxisomal compartment in living mammalian cells: Dynamic behavior and association with microtubules. J Cell Biol. 1997;136:71–80. doi: 10.1083/jcb.136.1.71. [DOI] [PMC free article] [PubMed] [Google Scholar]
- 36.Collings DA, Harper JDI, Vaughn KC. The association of peroxisomes with the developing cell plate in dividing onion root cells depends on actin microfilaments and myosin. Planta. 2003;218:204–216. doi: 10.1007/s00425-003-1096-2. [DOI] [PubMed] [Google Scholar]
- 37.Sütterlin C, Hsu P, Mallabiabarrena A, Malhotra V. Fragmentation and dispersal of the pericentriolar Golgi complex is required for entry into mitosis in mammalian cells. Cell. 2002;109:359–369. doi: 10.1016/S0092-86740200720-1. [DOI] [PubMed] [Google Scholar]
- 38.Nguyen T, Bjorkman J, Paton BC, Crane DI. Failure of microtubule-mediated peroxisome division and trafficking in disorders with reduced peroxisome abundance. J Cell Sci. 2006;119:636–645. doi: 10.1242/jcs.02776. [DOI] [PubMed] [Google Scholar]
- 39.Schrader M, Burkhardt JK, Baumgart-Vogt E, Lüers G, Spring H, Völkl A, Fahimi HD. Interaction of microtubules with peroxisomes. Tubular and spherical peroxisomes in HepG2 cells and their alterations induced by microtubule-active drugs. Eur J Cell Biol. 1996;69:24–35. [PubMed] [Google Scholar]
- 40.Hoepfner D, van den Berg M, Philippsen P, Tabak HF, Hettema EH. A role for Vps1p, actin, and the Myo2p motor in peroxisome abundance and inheritance in Saccharomyces cerevisiae. J Cell Biol. 2001;155:979–990. doi: 10.1083/jcb.200107028. [DOI] [PMC free article] [PubMed] [Google Scholar]
- 41.Kredel S, Oswald F, Nienhaus K, Deuschle K, Röcker C, Wolff M, Heilker R, Nienhaus GU, Wiedenmann J. mRuby, a bright monomeric red fluorescent protein for labeling of subcellular structures. PLOS ONE. 2009;4:e4391. doi: 10.1371/journal.pone.0004391. [DOI] [PMC free article] [PubMed] [Google Scholar]
- 42.Bharti P, Schliebs W, Schievelbusch T, Neuhaus A, David C, Kock K, Herrmann C, Meyer HE, Wiese S, Warscheid B, Theiss C, Erdmann R. PEX14 is required for microtubule-based peroxisome motility in human cells. J Cell Sci. 2011;124:1759–1768. doi: 10.1242/jcs.079368. [DOI] [PubMed] [Google Scholar]
- 43.Seldin L, Muroyama A, Lechler T. NuMA-microtubule interactions are critical for spindle orientation and the morphogenesis of diverse epidermal structures. eLife. 2016;5:e12504. doi: 10.7554/eLife.12504. [DOI] [PMC free article] [PubMed] [Google Scholar]
- 44.Gallini S, Carminati M, De Mattia F, Pirovano L, Martini E, Oldani A, Asteriti IA, Guarguaglini G, Mapelli M. NuMA phosphorylation by Aurora-A orchestrates spindle orientation. Curr Biol. 2016;26:458–469. doi: 10.1016/j.cub.2015.12.051. [DOI] [PubMed] [Google Scholar]
- 45.Kotak S, Busso C, Gönczy P. NuMA interacts with phosphoinositides and links the mitotic spindle with the plasma membrane. EMBO J. 2014;33:1815–1830. doi: 10.15252/embj.201488147. [DOI] [PMC free article] [PubMed] [Google Scholar]
- 46.Zheng Z, Wan Q, Meixiong G, Du Q. Cell cycle–regulated membrane binding of NuMA contributes to efficient anaphase chromosome separation. Mol Biol Cell. 2014;25:606–619. doi: 10.1091/mbc.E13-08-0474. [DOI] [PMC free article] [PubMed] [Google Scholar]
- 47.Qian W, Choi S, Gibson GA, Watkins SC, Bakkenist CJ, Van Houten B. Mitochondrial hyperfusion induced by loss of the fission protein Drp1 causes ATM-dependent G2/M arrest and aneuploidy through DNA replication stress. J Cell Sci. 2012;125:5745–5757. doi: 10.1242/jcs.109769. [DOI] [PMC free article] [PubMed] [Google Scholar]
- 48.Fagarasanu A, Mast FD, Knoblach B, Jin Y, Brunner MJ, Logan MR, Glover JNM, Eitzen GA, Aitchison JD, Weisman LS, Rachubinski RA. Myosin-driven peroxisome partitioning in S. cerevisiae. J Cell Biol. 2009;186:541–554. doi: 10.1083/jcb.200904050. [DOI] [PMC free article] [PubMed] [Google Scholar]
- 49.Rohn JL, Patel JV, Neumann B, Bulkescher J, Mchedlishvili N, McMullan RC, Quintero OA, Ellenberg J, Baum B. Myo19 ensures symmetric partitioning of mitochondria and coupling of mitochondrial segregation to cell division. Curr Biol. 2014;24:2598–2605. doi: 10.1016/j.cub.2014.09.045. [DOI] [PMC free article] [PubMed] [Google Scholar]
- 50.van Bergejik P, Adrian M, Hoogenraad CC, Kapitein LC. Optogenetic control of organelle transport and positioning. Nature. 2015;518:111–114. doi: 10.1038/nature14128. [DOI] [PMC free article] [PubMed] [Google Scholar]
- 51.Ballister ER, Ayloo S, Chenoweth DM, Lampson MA, Holzbaur ELF. Optogenetic control of organelle transport using a photocaged chemical inducer of dimerization. Curr Biol. 2015;25:R407–R408. doi: 10.1016/j.cub.2015.03.056. [DOI] [PMC free article] [PubMed] [Google Scholar]
- 52.Duan L, Che D, Zhang K, Ong Q, Guo S, Cui B. Optogenetic control of molecular motors and organelle distributions in cells. Chem Biol. 2015;22:671–682. doi: 10.1016/j.chembiol.2015.04.014. [DOI] [PMC free article] [PubMed] [Google Scholar]
- 53.Katajisto P, Döhla J, Chaffer CL, Pentinmikko N, Marjanovic N, Iqbal S, Zoncu R, Chen W, Weinberg RA, Sabatini DM. Asymmetric apportioning of aged mitochondria between daughter cells is required for stemness. Science. 2015;348:340–343. doi: 10.1126/science.1260384. [DOI] [PMC free article] [PubMed] [Google Scholar]
- 54.Trapnell C, Roberts A, Goff L, Pertea G, Kim D, Kelley DR, Pimentel H, Salzberg SL, Rinn JL, Pachter L. Differential gene and transcript expression analysis of RNA-seq experiments with TopHat and Cufflinks. Nat Protoc. 2012;7:562–578. doi: 10.1038/nprot.2012.016. [DOI] [PMC free article] [PubMed] [Google Scholar]
Associated Data
This section collects any data citations, data availability statements, or supplementary materials included in this article.