Abstract
Noonan syndrome (NS; MIM 163950) is an autosomal dominant disorder and a member of a family of developmental disorders termed “RASopathies,” which are caused mainly by gain-of-function mutations in genes encoding RAS/MAPK signaling pathway proteins. Whole exome sequencing (WES) and trio-based genomic triangulation of a 15-year-old female with a clinical diagnosis of NS and concomitant cardiac hypertrophy and her unaffected parents identified a de novo variant in MRAS-encoded RAS-related protein 3 as the cause of her disease. Mutation analysis using in silico mutation prediction tools and molecular dynamics simulations predicted the identified variant, p.Gly23Val-MRAS, to be damaging to normal protein function and adversely affect effector interaction regions and the GTP-binding site. Subsequent ectopic expression experiments revealed a 40-fold increase in MRAS activation for p.Gly23Val-MRAS compared with WT-MRAS. Additional biochemical assays demonstrated enhanced activation of both RAS/MAPK pathway signaling and downstream gene expression in cells expressing p.Gly23Val-MRAS. Mutational analysis of MRAS in a cohort of 109 unrelated patients with phenotype-positive/genotype-negative NS and cardiac hypertrophy yielded another patient with a sporadic de novo MRAS variant (p.Thr68Ile, c.203C>T). Herein, we describe the discovery of mutations in MRAS in patients with NS and cardiac hypertrophy, establishing MRAS as the newest NS with cardiac hypertrophy-susceptibility gene.
Using whole exome sequencing with proband/parent genomic triangulation, molecular dynamic simulations, and experimental/functional validation studies, MRAS was identified as a Noonan syndrome susceptibility gene.
Introduction
Noonan syndrome (NS; MIM 163950) is an autosomal dominant developmental disorder affecting approximately 1 in every 1,000 to 2,500 live births (1, 2). NS is characterized by wide phenotypic variability, including distinct facial dysmorphisms, such as broad forehead, hypertelorism, ptosis, and low-set posteriorly rotated ears. Additionally, affected individuals may have skeletal malformations, short stature, developmental delay, learning difficulties, and bleeding disorders (2, 3). Eighty percent of patients with clinically diagnosed NS also have congenital cardiovascular abnormalities, including pulmonary valve stenosis, cardiac hypertrophy, or septal defects (4, 5).
Although NS is a genetically heterogeneous disorder, nearly all genes associated with NS encode proteins that are either components or regulators of the RAS/MAPK signaling pathway. To date, besides the most common NS-susceptibility gene, PTPN11 (6), which characteristically yields a cardiac phenotype of pulmonary valve stenosis rather than cardiac hypertrophy, there are at least 9 additional NS-susceptibility genes, including SOS1 (7, 8), RAF1 (9, 10), KRAS (11), RIT1 (12, 13), NRAS (14), RRAS (15), CBL (16), and SOS2 and LZTR1 (17). A mutation in SHOC2 is responsible for NS-like disorder with loose anagen hair (NS-LAH; MIM 607721) (18). Most recently, PPP1CB mutations have been identified in a syndrome closely resembling NS-LAH (19).
The RAS/MAPK pathway is associated with a number of fundamental cellular processes, including proliferation, differentiation, migration, and apoptosis and is particularly important for normal early development (20, 21). NS and a number of other phenotypically overlapping developmental disorders termed “RASopathies” are caused by dysregulation, which is generally embodied by an increase in signaling, of this pathway early in development. Other RASopathies include Costello syndrome (MIM 218040), cardiofaciocutaneous syndrome (MIM 115150), and NS with multiple lentigines (previously referred to as LEOPARD syndrome; MIM 151100); these RASopathies, like NS, are caused by germline mutations in genes encoding proteins involved in Ras/MAPK signaling (22).
Although understanding of the genetic underpinnings of NS has continued to grow over the last decade, approximately 20% of all NS cases remain elusive genetically. Identifying the remaining NS genes is critical for proper patient diagnosis and management, as well as elucidating genotype-phenotype correlations, which remain limited. Herein, using whole exome sequencing (WES) with proband/parent genomic triangulation, molecular dynamic simulations (MDS), and experimental/functional validation studies, we describe the identification of MRAS as what we believe to be the newest NS-susceptibility gene.
Results
WES and proband/parent genomic triangulation elucidate a sporadic p.Gly23Val-MRAS variant in a proband with NS with concomitant cardiac hypertrophy.
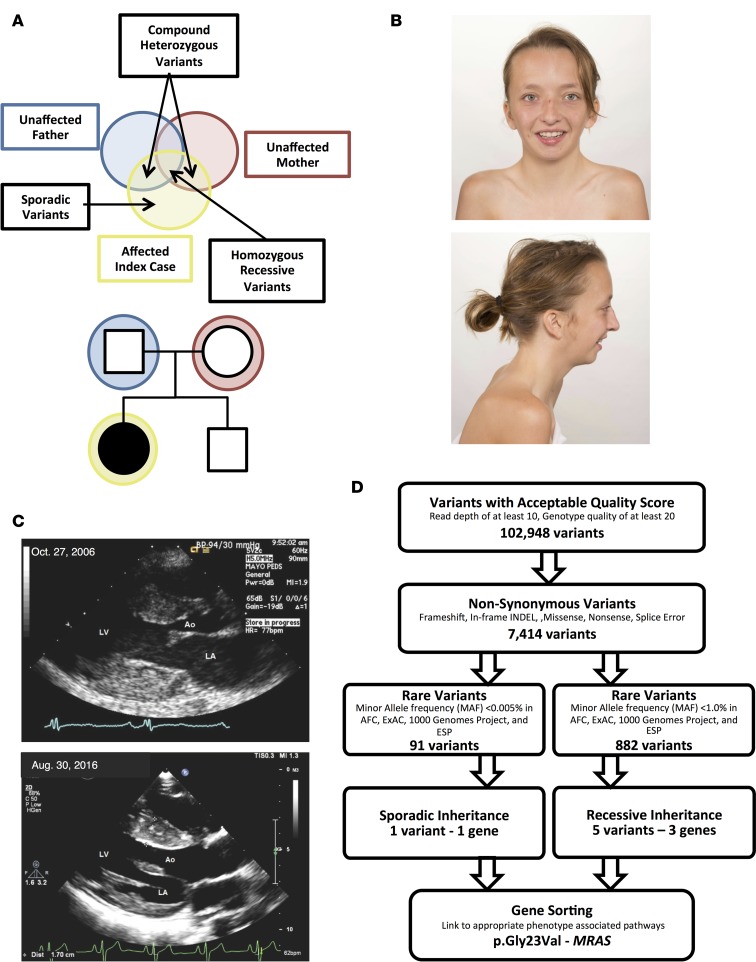
A family with presumed sporadic, possibly autosomal recessive, NS was referred to the Mayo Clinic’s Windland Smith Rice Sudden Death Genomics Laboratory for further research-based genetic testing following negative commercially available clinical genetic testing for most NS- and myofilament-associated hypertrophic cardiomyopathy genes (Figure 1A). At the time of WES, the index case was a 15-year-old female who was diagnosed with biventricular cardiac hypertrophy in infancy following evaluation of a cardiac murmur. In addition to cardiac hypertrophy, she presented with short stature and facial dysmorphisms and with mildly posteriorly rotated ears (Figure 1B). She also displayed a static pattern of globally delayed acquisition of developmental milestones and cognitive disability. She underwent surgical myectomy for biventricular outflow tract obstruction at age 8 and was diagnosed with NS at that time as well (Figure 1C). Both parents were considered unaffected, with repeated normal echocardiograms and no identifiable characteristics of NS; there was no family history of NS or related disorders.
Figure 1. Whole exome sequencing and familial genomic triangulation for the elucidation of a genetic substrate for Noonan syndrome.
(A) Noonan syndrome pedigree with presumed sporadic or autosomal recessive (compound heterozygous or homozygous) inheritance pattern showing the case-parent trio with the affected index case (black circle) and unaffected family members (white symbols). (B) Clinical appearance of the patient at 17 years old, showing facial characteristics of Noonan syndrome, such as long facies and low-set posteriorly rotated ears. Images were obtained and published with both patient’s and parents’ permission. (C) Parasternal long-axis view of the index case’s echocardiogram performed at age 8 (October 27, 2006) and age 17 (August 30, 2016). The echocardiogram shows left ventricular hypertrophy with maximal septal thickness of 18 and 17 mm for these 2 echocardiograms, respectively (Ao, aorta; LA, left atrium; LV, left ventricle). (D) A flow diagram of the variant filtering process following whole exome sequencing, and results for both a sporadic and autosomal recessive inheritance model.
WES was performed on the index case and her unaffected parents. Given the lack of phenotype in both parents, the mutational results from the WES were scrutinized based on a sporadic de novo model of inheritance. Since there are some reports of autosomal recessive forms of NS, the results were evaluated for an autosomal recessive inheritance pattern as well (Figure 1A). Following initial filtering, a total of 102,948 variants with an acceptable quality score (read depth of at least 10, genotype quality of at least 20, and present in genes outside the top 1% of genes with high variability) were identified (Figure 1D). Of these, 7,414 variants were nonsynonymous or protein-altering variants. In the sporadic model, the total variants were limited to only ultra-rare variants with a minor allele frequency (MAF) <0.005% in the Allele Frequency Community (AFC), Exome Aggregation Consortium (ExAC), 1000 Genomes Project (1KG), and Exome Sequencing Project (ESP) databases, resulting in a total of 91 variants. Of these, one single de novo variant (present in the case and absent in both parents) was discovered. In the recessive model, 882 rare variants with a MAF <1.0% in the AFC, ExAC, 1KG, and ESP databases were identified. Of these, rare nonsynonymous variants, 5 variants in 3 different genes fit a recessive, either homozygous or compound heterozygous, inheritance pattern based on parent exome subtraction/inclusion criteria (Figure 1D).
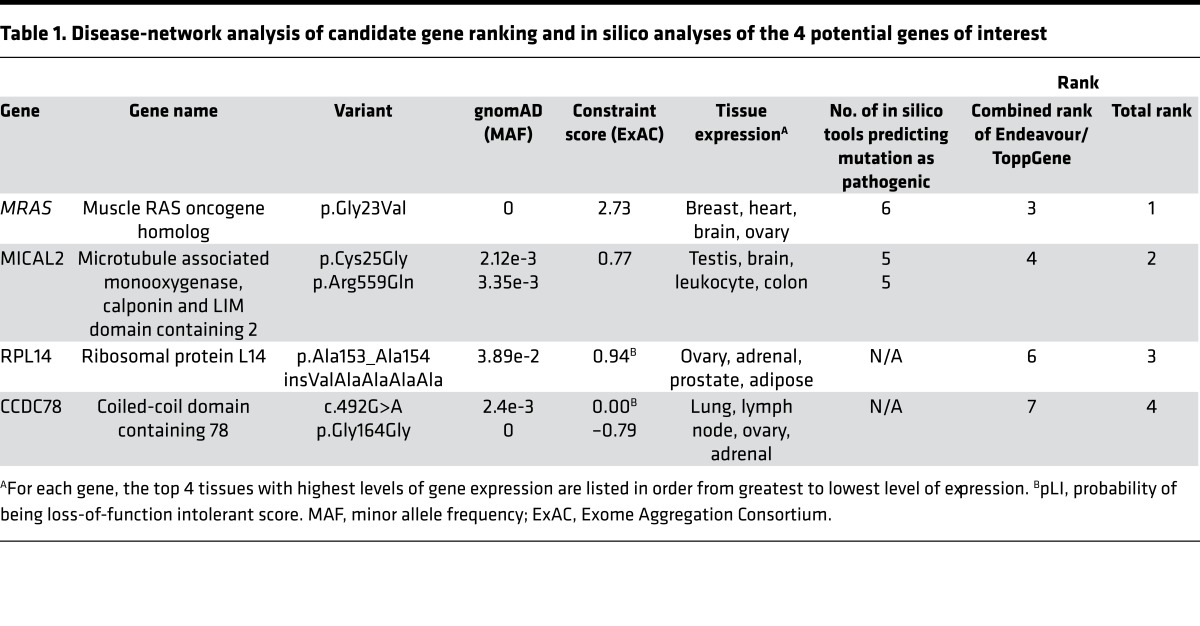
Following WES and genomic triangulation, 4 candidate genes (one from the sporadic model and 3 from the autosomal recessive model) were subjected to disease-network analysis ranking using ToppGene and Endeavour. MRAS (NM_012219), which encodes the muscle RAS oncogene homolog (MRAS, R-RAS3, NP_036351) and is a member of the Ras super family of proteins and a regulator of Ras/MAPK pathway signaling, was ranked as the most likely candidate gene based on the provided training genes (genes listed in Methods section). Following additional analyses assessing the frequency of each mutation in gnomAD, ExAC constraint score, tissue expression for each gene, and pathogenic mutation prediction using in silico tools (Supplemental Table 1; supplemental material available online with this article; https://doi.org/10.1172/jci.insight.91225DS1), MRAS emerged as the top ranked NS-susceptibility gene (Table 1).
Table 1. Disease-network analysis of candidate gene ranking and in silico analyses of the 4 potential genes of interest.
Sanger DNA sequencing confirmed the de novo, heterozygous p.Gly23Val-MRAS (c.68G>T) missense mutation in the patient. As implicated by the WES data, both parents again tested negative for this mutation, and maternity/paternity was verified. p.Gly23Val-MRAS is ultra-rare, being absent in all individuals from the Genome Aggregation Database (i.e., absent in >280,000 alleles) (gnomAD, n = 141,353) (23).
Detailed sequence and structural based bioinformatic studies predict that the p.Gly23Val-MRAS variant yields a constitutively active form of this protein.
We first sought to gain insight into the potential damaging effect of p.Gly23Val-MRAS using commonly used in silico tools developed to assess the phylogenetic and/or physiochemical properties of amino acids altered by a genetic mutation in order to predict the “pathogenic” likelihood of patient-derived protein mutations. All six tools (PolyPhen2, PROVEAN, SIFT, Mutation Assessor, fathmm, and Align GVGD) predicted a damaging or deleterious effect of p.Gly23Val-MRAS, providing in silico support for its consideration as a pathogenic mutation.
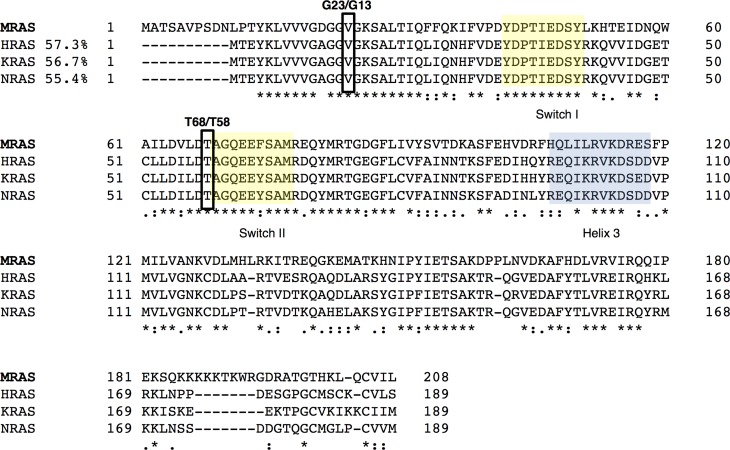
From a structural bioinformatics perspective, paralog annotation analyses and ELM searches (24) demonstrated that the p.Gly23Val-MRAS substitution resides within the GTP-binding domain of the protein, as defined by the GXGGXGKS consensus motif. This well-characterized motif, also known as the Walker A box or P-loop, is present in many GTPases and binds the α and β phosphates of the nucleotide. Additionally, a multiple sequence alignment with better studied MRAS paralogs demonstrated that despite differences in the sequence among these proteins (homology of these proteins compared with MRAS: HRAS, 57.3%; NRAS, 56.7%; KRAS, 55.4%), the regions corresponding to the nucleotide-binding site, switch I and II as well as helix 3, which are critical for the activation of these proteins, were conserved highly among all 4 proteins (Figure 2). This analysis revealed that p.Gly23Val-MRAS is equivalent to the constitutively active p.Gly13Val mutation in other RAS proteins, including H-, N-, and K-RAS, previously shown to induce cell growth and neoplastic transformation (25).
Figure 2. Multiple sequence alignment of MRAS in comparison with HRAS, KRAS, and NRAS paralogs.
Multiple sequence alignment was performed using T-COFFEE as previously described (62). Note that, in spite of differences in the sequence among these proteins (HRAS: 57.3%; NRAS: 56.7%; KRAS: 55.4%), the regions corresponding to the switch I and II and helix 3, which are critical for the activation of these proteins, are highly conserved. Additionally, sequence alignment demonstrated that the MRAS variants aligned to critical and conserved regions, matching previously identified disease-associated variants in one or more of the MRAS paralogs.
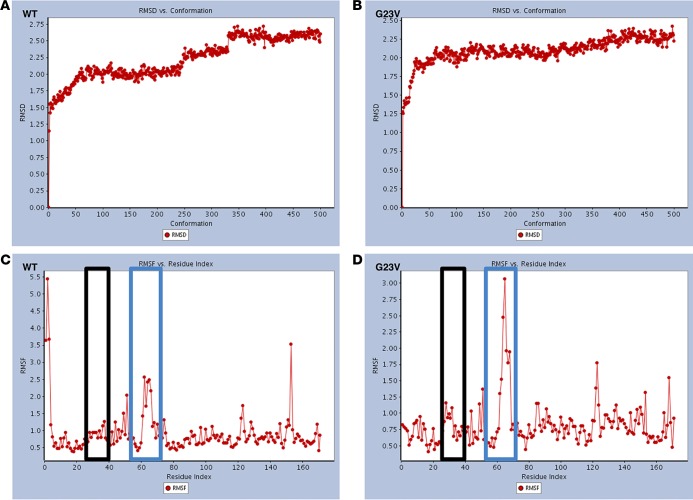
Molecular modeling and MDS were also performed. This method has been used extensively to define whether variants in Ras proteins are able to induce the state I–to–state II transition, which underlies the activation of these proteins (26). These studies indicate that when compared with WT-MRAS, p.Gly23Val-MRAS displays differences in molecular dynamics (Figure 3, A–D). The most conspicuous of these differences was a dramatic increase in root-mean-square fluctuations (Figure 3, C and D) from WT to mutant, corresponding to the switch II region.
Figure 3. Root-mean-square deviation and root-mean-square fluctuation values of both WT-MRAS and p.Gly23Val-MRAS during the molecular dynamic simulations.
(A and B) Root-mean-square deviation (RMSD) values for WT-MRAS (A) and p.Gly23Val-MRAS (B). (C and D) Root-mean-square fluctuation (RMSF) values for WT-MRAS (C) and p.Gly23Val-MRAS (D) are used here as a measure of the flexibility of different regions of the protein during the 20-ns molecular dynamic simulations (MDS). The black boxes represent the switch I region and the blue boxes represent the switch II region. The dynamics of these regions are critical for the transition from state I to state II.
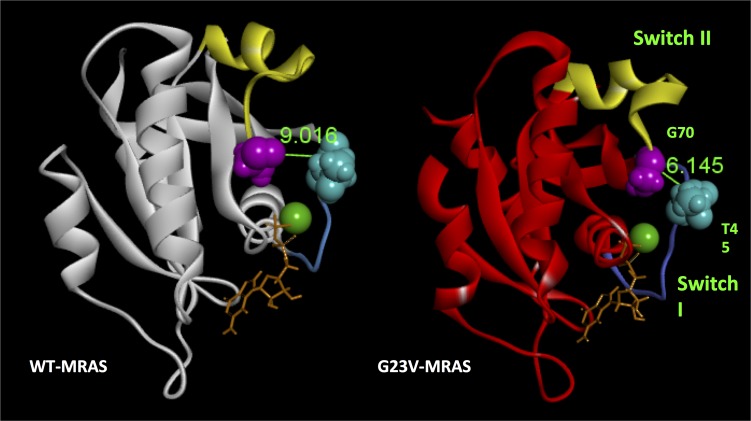
Careful analyses of the switch II region indicate that switch II is indeed remodeled in a manner that has been described previously (26) to characterize the GDP- to GTP-bound state of this protein (Supplemental Figure 1). Subsequently, we measured the distance between amino acids T45 and G70 (Figure 4). This distance is a surrogate for detecting the remodeling in the GDP/GTP-binding site. Notably, as expected from a transition between state I and state II, the distance between these residues decreased dramatically in the mutant (9.106A ± 0.410 SD for WT-MRAS compared with 6.145A ± 0.683 for p.Gly23Val-MRAS). This attenuation in the T45-to-G70 distance remodels the active site in a manner that brings it in closer contact with the nucleotide, reflecting a tendency of p.Gly23Val-MRAS to have a higher affinity for GTP.
Figure 4. Changes of the switch region and remodeling of the active site of p.Gly23Val-MRAS after molecular dynamic simulations.
WT-MRAS (white) and p.Gly23Val-MRAS (red) variants are shown after 20-ns molecular dynamic simulations. Mutation-associated remodeling of the switch I and switch II regions as well as the nucleotide-binding site are noticeable by comparison. This missense mutation results in a marked attenuation of the distance between the T45 and G70 residues by 2.871A, resulting in these two residues being brought closer to the phosphate groups of the bound nucleotide and the magnesium ion.
Last, since these changes should have an effect on exposing distinct interphase surfaces for interaction with effectors, we performed a comparative surface analysis between WT-MRAS and p.Gly23Val-MRAS. As shown in Supplemental Figure 2, after 20 ns of MDS, the p.Gly23Val-MRAS protein displayed surface changes, in particular at the switch II region and those covering the nucleotide-binding site, which have been associated previously with a state II transition (26). Collectively, the in silico analyses, molecular modeling, and MDS predict that this sporadic de novo missense mutation, p.Gly23Val-MRAS, will be disruptive functionally, creating a constitutively active form of this protein that resides primarily in a GTP-bound state.
Biochemical studies confirm that the p.Gly23Val-MRAS variant yields a constitutively active form of this protein with the ability to stimulate cytoplasmic-to-nuclear signaling cascades.
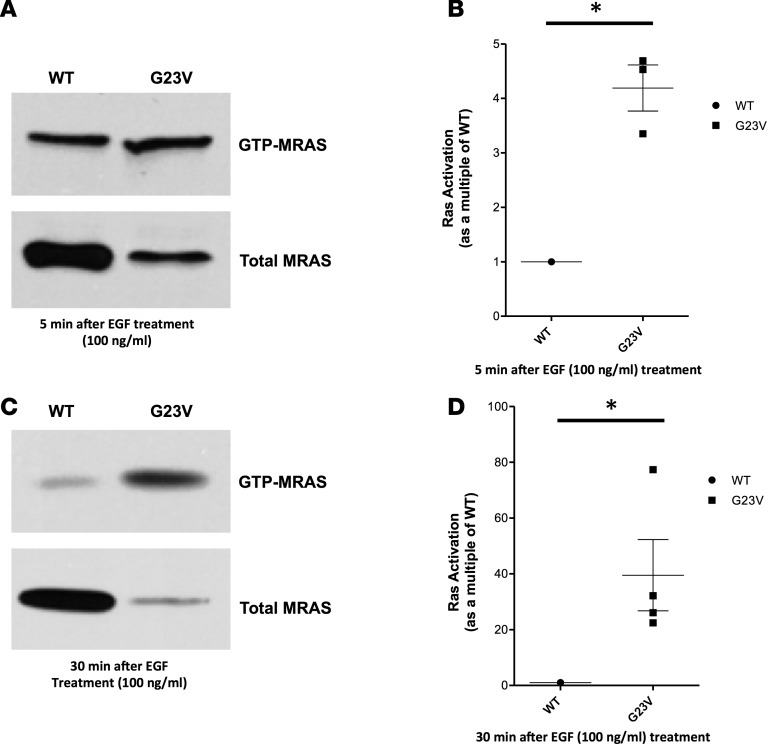
The effect of p.Gly23Val-MRAS mutation on MRAS activation and GTP loading was analyzed by Raf-RBD pulldown followed by Western blotting in transfected HEK293T/17 cells. Western blot followed by quantification analysis showed that, when normalized for MRAS expression, p.Gly23Val-MRAS precipitated a 4.2-fold increase (SD: 0.73, SEM: 0.42) in GTP loading compared with cells transfected with WT-MRAS following a 5-minute stimulation with EGF (100 ng/ml) (Figure 5, A and B). These findings are consistent with the in silico prediction that p.Gly23Val-MRAS is an activating mutation, leading to increased GTP loading and constitutive activation of MRAS. Similarly, p.Gly23Val-MRAS precipitated a 40-fold increase (SD: 25.53, SEM: 12.77) in GTP loading compared with cells transfected with WT-MRAS following a 30-minute stimulation with EGF (100 ng/ml) (Figure 5, C and D). Taken together, these results indicate both enhanced and prolonged activation of p.Gly23Val-MRAS, suggesting increased activation of downstream Ras/MAPK pathway signaling, consistent with the known final common pathway for NS pathogenesis.
Figure 5. Ras activation assay.
Full-length, hemaglutinin-tagged (HA-tagged) WT-MRAS or p.Gly23Val-MRAS was expressed in HEK293T/17 cells. Cells were stimulated with EGF (100 ng/ml) for either 5 or 30 minutes. Cells were collected in 1× Mg2+ Lysis/Wash Buffer (MLB), and active MRAS was pulled down by incubation of cell lysates with GST-Raf–Ras-binding domain (GST-Raf-RBD) prebound to glutathione sepharose. Following resuspension of beads in 4× Laemmli sample buffer, bound proteins were subjected to electrophoresis and blotted with an anti-HA tag antibody. (A) Total MRAS, detected immunologically with anti-HA in the whole-cell lysates collected from cells treated with EGF (100 ng/ml) for 5 minutes, and activated MRAS, detected immunologically with anti-HA. Immunoblots are representative for 3 independent experiments. (B) MRAS activation as a multiple of WT-MRAS activation 5 minutes after EGF (100 ng/ml) treatment. p.Gly23Val-MRAS precipitated a 4-fold increase (SD: 0.73, SEM: 0.42) in GTP loading compared with cells transfected with WT-MRAS. Data are presented as mean ± SEM. n = 3 per group. *P < 0.05 by 2-tailed Student’s t test. (C) Total MRAS, detected immunologically with anti-HA in the whole-cell lysates collected from cells treated with EGF (100 ng/ml) for 30 minutes, and activated MRAS, detected immunologically with anti-HA. Immunoblots are representative for 3 independent experiments. (D) MRAS activation as a multiple of WT-MRAS activation 30 minutes after after EGF (100 ng/ml) treatment. p.Gly23Val-MRAS precipitated a 40-fold increase (SD: 25.53, SEM: 12.77) in GTP loading compared with cells transfected with WT-MRAS. Data are presented as mean ± SEM. n = 4 per group. *P < 0.05 by 2-tailed Student’s t test.
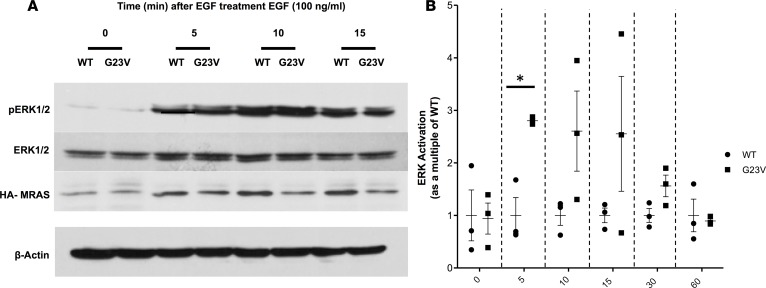
To further test this hypothesis, we determined the functional effect of the p.Gly23Val-MRAS mutation on Ras/MAPK signal transduction by evaluating EGF-induced ERK activation. Expression of WT-MRAS in HEK293T/17 cells resulted in negligible ERK activation in serum-deprived cells and a modest, rapid increase after EGF stimulation (Figure 6). While the basal level of p-ERK following serum deprivation was similar in p.Gly23Val-MRAS–expressing cells compared with WT-MRAS–expressing cells (P = 0.9), the phosphorylation of ERK was accentuated significantly in cells transfected with p.Gly23Val-MRAS 5 minutes after EGF stimulation (P = 0.006; Figure 6). Overall, ERK activation remained lower in cells expressing WT-MRAS compared with p.Gly23Val-MRAS for the remainder of the time course; however, this difference was not statistically significant (10 minutes: P = 0.1; 15 minutes: P = 0.2; 30 minutes: P = 0.08; 60 minutes: P = 0.8; Figure 6B). This increased activation of ERK in cells expressing p.Gly23Val-MRAS confirms an enhanced activation of Ras/MAPK pathway signaling compared with cells expressing WT-MRAS, which should activate downstream transcription factor pathways.
Figure 6. ERK activation assay.
Full-length, hemaglutinin-tagged (HA-tagged) WT-MRAS or p.Gly23Val-MRAS was expressed in HEK293T/17 cells. Serum-starved cells were stimulated with EGF (100 ng/ml) and collected in 4× Laemmli sample buffer. Following sonication of the cell lysates, proteins were subjected to electrophoresis and blotted with the indicated antibody. The fraction of ERK that was phosphorylated was calculated for each sample at each time point. (A) Representative immunoblots for 3 independent experiments. (B) ERK activation in cells transfected with p.Gly23Val-MRAS as a multiple of ERK activation in cells transfected with WT-MRAS and normalized for MRAS expression. ERK activation for p.Gly23Val-MRAS–expressing cells was calculated as a multiple of ERK activation in WT-MRAS–expressing cells from 3 separate experiments and demonstrated that the phosphorylation of ERK was accentuated significantly in cells transfected with p.Gly23Val-MRAS 5 minutes after EGF stimulation (P = 0.006). Overall, ERK activation remained lower in cells expressing WT-MRAS compared with p.Gly23Val-MRAS for the remainder of the time course; however, this difference was not statistically significant (10 minutes: P = 0.1; 15 minutes: P = 0.2; 30 minutes: P = 0.08; 60 minutes: P = 0.8). Data are presented as mean ± SEM. n = 3 per group. *P < 0.0083 by 2-tailed Student’s t test with Bonferroni multiple-significance-test correction.
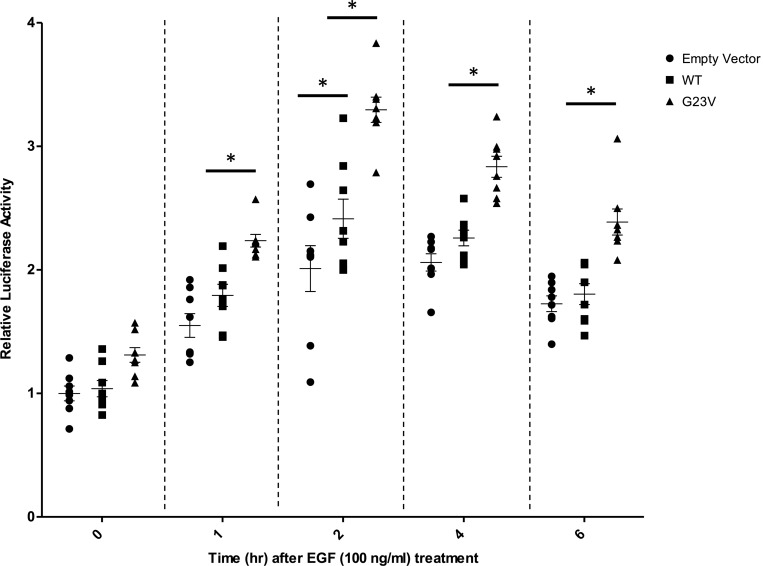
Following Ras/MAPK/ERK signaling activation, phosphorylated Elk1 forms a complex with serum response factor and binds to the serum response element (SRE), resulting in the expression of numerous mitogen-inducible genes. To evaluate the effect of the p.Gly23Val-MRAS mutation on the downstream activity of the Ras/MAPK signaling pathway, a SRE reporter assay was used. The reporter construct contained the firefly luciferase gene under the control of an SRE located upstream of a minimal reporter. After stimulation with EGF, mouse embryonic fibroblast (MEF) cells transfected with WT-MRAS, p.Gly23Val-MRAS, or an empty vector demonstrated an increase in luciferase expression over time following EGF treatment. While there was a significant difference between cells expressing WT-MRAS and cells transfected with an empty vector only at the 2-hour time point (P < 0.01), luciferase expression was significantly higher (P < 0.01) at all but the 0-hour time point in cells transfected with p.Gly23Val-MRAS (Figure 7). Increased luciferase expression following stimulation with EGF further validates p.Gly23Val-MRAS–precipitated accentuation of Ras/MAPK pathway signaling and the subsequent increase in downstream gene transcription activation. This modulation of downstream gene transcription, which includes the activation of transcription factors, such as early activators of the hypertrophic gene program MEF2, JUN, and GATA4, is what ultimately underlies and drives cellular signaling changes that result in clinically observable phenotypes (27, 28).
Figure 7. Serum response element reporter assay.
Full-length, hemaglutinin-tagged WT-MRAS or p.Gly23Val-MRAS was coexpressed in MEF cells along with the serum response element reporter plasmid. Serum-starved cells were stimulated with EGF (100 ng/ml) for the indicated time intervals and collected in 1X passive lysis buffer (PLB). The luciferase activity was measured and normalized to protein concentration, as measured by bicinchoninic acid assay. Luciferase activity was calculated relative to the empty vector construct from 4 independent experiments. While there was a significant difference between cells expressing WT-MRAS compared with cells transfected with an empty vector only at the 2-hour time point (P < 0.01), luciferase expression was significantly higher (P < 0.01) at all but the 0-hour time point in cells transfected with p.Gly23Val-MRAS. Data are presented as mean ± SEM. n = 8 per group. *P < 0.01 by 2-way ANOVA with Tukey’s multiple comparison test.
Throughout the described biochemical assays, it was noted that p.Gly23Val-MRAS consistently appeared to be expressed at a lower level than WT-MRAS. The exact reason for this discrepancy in expression level is not completely clear, although we hypothesize that this is caused by enhanced degradation of mutated MRAS or decreased expression of the p.Gly23Val-containing vector. However, in the context of these experiments, it is ultimately the level of active, GTP-bound MRAS, rather than total MRAS, that is critical for the observed cellular phenotypes. In this regard, using Ras activation assays, we have demonstrated that p.Gly23Val-MRAS–expressing cells consistently maintain significantly higher levels of active, GTP-bound MRAS, regardless of level of total MRAS.
MRAS mutational analysis in unrelated patients with phenotype-positive/genotype-negative NS and concomitant cardiac hypertrophy yields another patient with a sporadic de novo MRAS variant.
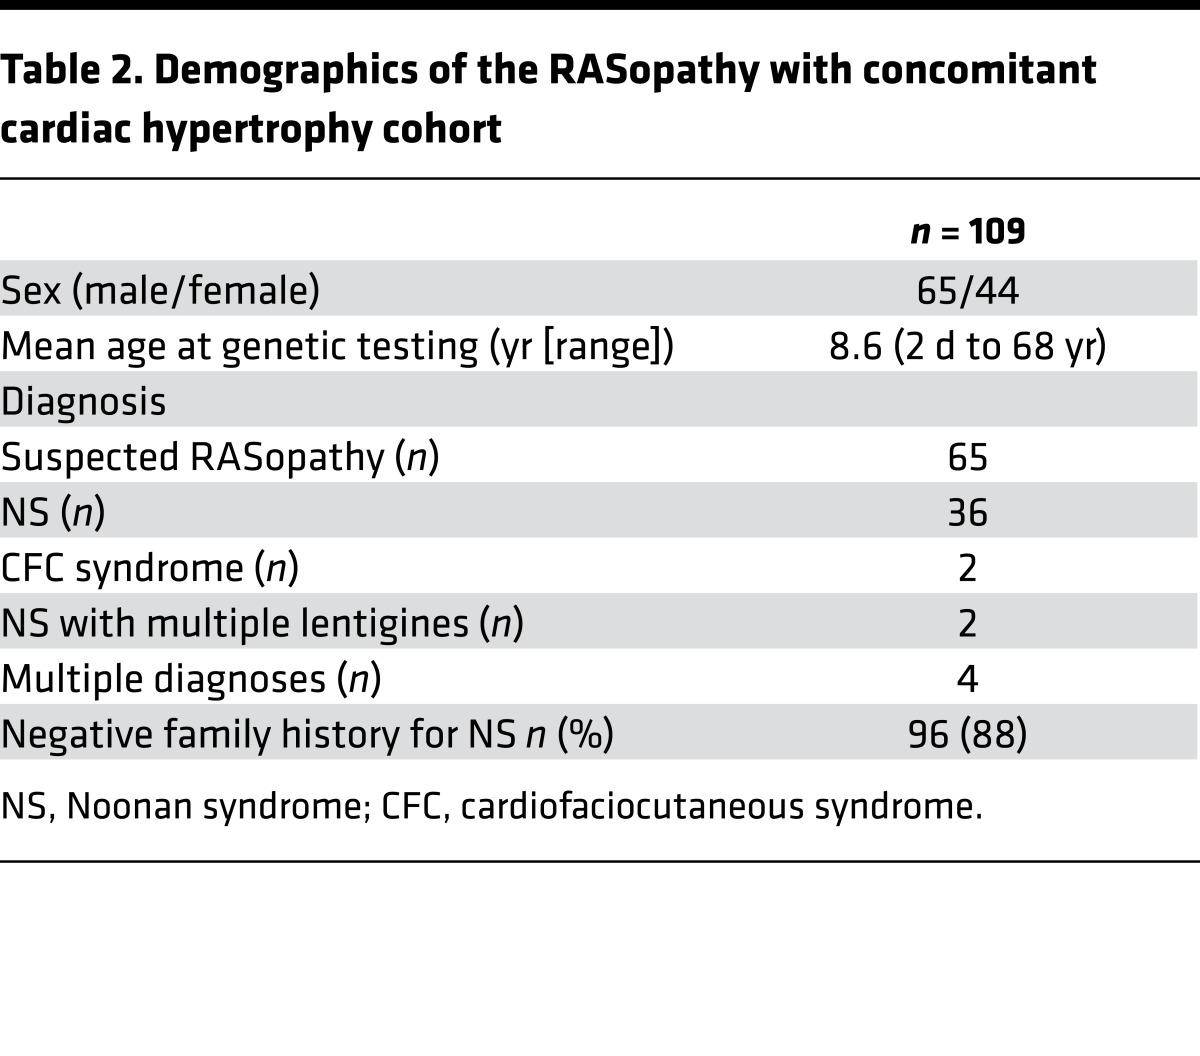
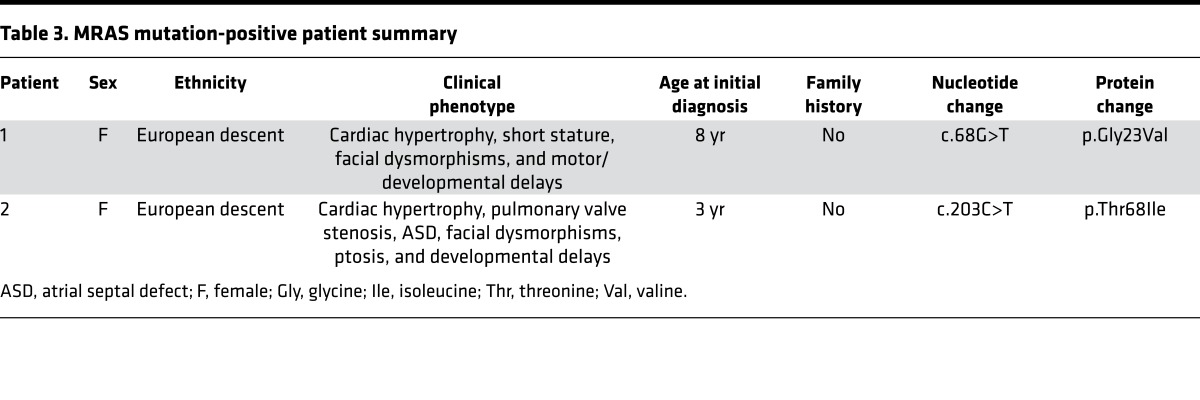
To determine the frequency of MRAS-mediated NS with cardiac hypertrophy, we assembled a cohort of 109 additional unrelated patients that were clinically diagnosed with suspected RASopathy along with concomitant cardiac hypertrophy (i.e., phenotype positive) but were genotype negative based on contemporary NS genetic testing and sent this cohort to the Mayo Clinic for MRAS mutational analysis. Of these 109 cases, 44 were female and 65 were male. Demographics of this cohort are summarized in Table 2. Following mutational analysis of MRAS, one additional patient had a novel missense mutation, p.Thr68Ile-MRAS (c.203C>T-MRAS). Akin to the first patient, this patient demonstrated clinical characteristics of NS combined with moderate developmental and intellectual delays. She had low set and mildly posteriorly angulated ears, very mild pectus excavatum, numerous wrinkles in her palms with slight redundancy of the soft tissue, mild hyperextensibility of her small joints, and hypotonia (Supplemental Figure 3). She walked independently at 2.5 years, used signs at around 15 months and spoken words at age 4 years, and was not fully toilet trained until age 6. At 6 years of age, she attended kindergarten in a mixed mainstream and special education setting with an aide and a learning support teacher.
Table 2. Demographics of the RASopathy with concomitant cardiac hypertrophy cohort.
Similar to our WES-based finding, there was no family history of NS, other RASopathies, or cardiac disorders in this family. Following direct DNA sequencing, this MRAS mutation was not detected in either parent, confirming that it too was a sporadic de novo variant. The biological relationship was confirmed for each parent. The patient’s younger sister is phenotypically normal and, due to the absence of the mutation in both parents, she was not genetically tested.
While in silico analyses of p.Thr68Ile-MRAS also predict a damaging/deleterious effect of this mutation, MDS and additional biochemical/functional validation assays will be necessary in the future to fully assess the effect of this mutation on MRAS activity and Ras/MAPK pathway regulation. The clinical phenotype of both patients with MRAS-mediated NS is summarized in Table 3.
Table 3. MRAS mutation-positive patient summary.
Discussion
Trio-based WES, genomic triangulation, and systems biology/disease network analysis-based gene ranking is a useful technique to identify pathogenetic mechanisms of disease. This technique is particularly useful in patients with a clear phenotype for which commercial genetic testing for the known disease-causative genes has failed to elucidate a cause. Herein, we identified MRAS as a NS-susceptibility gene using this strategy. Additionally, in a cohort of 109 genetically elusive RASopathy patients with concomitant cardiac hypertrophy, one other NS patient had an ultra-rare, sporadic mutation in MRAS.
MRAS has variable expression throughout the body, with high expression in the heart, brain, breast, and ovaries. MRAS encodes a 208–amino acid, membrane-associated protein. MRAS participates in Ras/MAPK pathway signaling, similar to nearly all genes previously associated with NS, supporting this disease’s RASopathy-centric final common pathway. MRAS specifically functions within the Ras/MAPK pathway by forming a ternary complex with SHOC2 and PP1. The formation of this complex localizes SHOC2 and PP1 to the cell membrane where SHOC2 acts as a regulatory subunit of PP1c, targeting it to specifically dephosphorylate the P-S259 inhibitory site of RAF1 kinase. The removal of this inhibitory phosphate stimulates Raf1 activity and, thereby, activity of downstream MAPK pathway signaling (29). MRAS, therefore, makes a critical contribution to ERK activation by receptor tyrosine kinases and downstream MAPK signaling (30). Mutations in the other components of this ternary complex, SHOC2 and PP1, have been implicated previously in the pathogenesis of RASopathies. A gain-of-function mutation in SHOC2, as well as gain-of-function mutations in PPP1CB, have been demonstrated previously to cause NS-LAH and PPP1CB-related NS-LAH, respectively (18, 19). Additionally, gain-of-function RAF1 mutations cause NS. In fact, these mutations seem to cluster around the S259 phosphorylation site, emphasizing the importance of MRAS/SHOC2/PP1C-mediated dephosphorylation of RAF1’s serine residue at amino acid 259 in RAF/ERK/MAPK pathway activation and associated disease pathogenesis (9, 30, 31). Our data suggest that activating mutations in MRAS similarly lead to enhanced Ras/MAPK pathway signaling, likely through the activity of this MRAS/SHOC2/PP1C complex.
MRAS is a member of the Ras super family of proteins, which includes HRAS, KRAS, NRAS, Rit1, and RRAS, several of which have been associated with NS or related RASopathies (11, 12, 14, 15, 32). All Ras proteins belong to a class of small GTPases and cycle between an active GTP-bound state and an inactive, GDP-bound state. In the active, GTP-bound state, Ras proteins undergo a conformational change allowing binding to other effector proteins and participation in signaling cascades. The intrinsic Ras GTPase hydrolyzes Ras-GTP back to Ras-GDP, with the aid of GTPase-activating proteins (GAPs), to terminate activity and signaling. Somatic KRAS and NRAS mutations, which introduce amino acid substitutions at codons 12, 13, and 61, have been observed previously in myeloid malignancies and other cancers and encode proteins with defective intrinsic GTPase activity and resistance to GAPs, leading to an accumulation in the GTP-bound conformation (25, 33, 34). Similar activating mutations in KRAS, NRAS, and HRAS, including those at amino acids 12, 13, and 58, have been observed in NS and Costello syndrome (11, 14, 32, 35). Sequence alignment (Figure 2) demonstrates that while MRAS is less similar to the well-known Ras oncogenes (overall homology ~55%), the switch I and II domains as well as helix 3 are conserved highly among all 4 paralogs. The dynamic behavior of these regions forms the structural basis of the state I to state II transition, namely the transition from an inactive-to-active form. Furthermore, the alignment shows that MRAS’s glycine 23, the amino acid mutated to valine in our index case (p.Gly23Val), corresponds to Gly13 of N-, K-, and H-RAS, respectively (Figure 2). Similarly, Thr68-MRAS, the amino acid mutated to isoleucine in a second patient from the cohort analysis, corresponds to Thr58- N-, K-, and H-RAS (Figure 2). These comparisons lend further paralog support for NS secondary to either p.Gly23Val or p.Thr68Ile mutations in MRAS.
In silico analyses of patient-derived MRAS mutations p.Gly23Val and p.Thr68Ile predict that both mutations are deleterious or damaging to normal function. Initial MDS models, as described in the Results, indicate that p.Gly23Val adversely affects effector interaction regions and the GTP-binding site, supporting the subsequent functional evidence that p.Gly23Val-MRAS yields an activated form of MRAS. Notably, artificially engineered variants, p.Gly22Val and p.Gln71Leu, were shown previously to also be constitutively active variants, akin to our patients’ p.Gly23Val and p.Thr68Ile NS-causing variants, and have been utilized as activated forms of MRAS to study MRAS function and behavior (36, 37). These models demonstrate the role of MRAS in MAPK signaling and pathway activity and demonstrated that activating mutations enhance MRAS activity in MAPK regulation (37).
Despite the phenotypic overlap among the RASopathies due to shared pathogenesis resulting from Ras/MAPK pathway dysregulation, there are distinct intersyndromic as well as intrasyndromic phenotypic differences that provide evidence that mutations in different genes, and potentially even specific lesions within those genes, lead to different phenotypic outcomes. Several examples provide evidence to suggest that mutations in specific genes may be associated with a particular phenotype, such as cardiac hypertrophy, compared with other genes that cause the same disease with a different phenotypic profile. The identification of MRAS mutations in two different NS patients with similar phenotypic profiles, including extensive cardiac hypertrophy, indicates that MRAS may be one of these genes. This is further evidenced by initial functional studies indicating that p.Gly23Val-MRAS is an activating mutation that leads to enhanced Ras/MAPK pathway signaling, a pathway critical in cardiac development and the development of cardiac hypertrophy (reviewed in ref. 38). Additionally, activation and dysregulation of pathways parallel to the Ras/MAPK signaling pathway may play a role in phenotypic heterogeneity and the development particular phenotypes (39). p.Gln71Leu-MRAS has previously been shown to lead to activation of the PI3K/AKT signaling pathway, which has been associated with the development of cardiac hypertrophy (ref. 40; reviewed in ref. 41). In fact, transactivation of the PI3K/AKT pathway may provide an additional avenue whereby activating mutations in MRAS may lead to NS with a specific cardiac hypertrophy phenotype. All of the various aforementioned lines of evidence combined make a cogent case for causality for MRAS-mediated NS with cardiac hypertrophy.
In summary, genetic studies, based on the identification and filtering of variants identified by next-generation sequencing as well as their validation in an independent cohort of patients, identify MRAS as a disease-associated gene in patients with clinically diagnosed NS that includes the cardiac phenotype of cardiac hypertrophy. Both sequence- and structure-based bioinformatics approaches predict that the p.Gly23Val-MRAS variant identified in our index case yields a constitutively active form of MRAS. Key biochemical/functional validation assays confirmed the in silico predictions by demonstrating that p.Gly23Val-MRAS resides within the cell in a primarily GTP-bound form. Cells expressing the patient’s mutant MRAS also display enhanced ERK activation and signaling as well as gene transcription activation in response to growth factors. These studies justify the classification of MRAS as a NS-causative gene.
Methods
WES.
WES and subsequent variant analysis was performed on genomic DNA derived from the symptomatic index case, the unaffected father, and the unaffected mother by the Mayo Clinic Advanced Genomics Technology Center and Bioinformatics Core facility as previously described (42, 43). In brief, blood was collected for all 3 family members and genomic DNA was isolated. Paired-end libraries were prepared following the manufacturer’s protocol (Agilent) using the Bravo liquid handler from Agilent. A Covaris E210 sonicator was used to fragment 1–3 μg genomic DNA to 150–200 bp. Ends were repaired and an “A” base was added to the 3′ ends. Paired-end Index DNA adaptors (Agilent) with a single “T” base overhang at the 3′ end were ligated. Resulting constructs were purified using AMPure SPRI beads (Agencourt). Adapter-modified DNA fragments were enriched by 4 cycles of PCR using SureSelect forward and SureSelect ILM Pre-Capture Indexing reverse (Agilent) primers. The Agilent Bioanalyzer DNA 1000 chip determined the concentration and size distribution of the libraries.
Whole exon capture was performed based on the protocol for Agilent’s Sure SelectXT Human All Exon V5+UTR kit. Whole exon biotinylated RNA capture baits were incubated with 750 ng of the prepped library for 24 hours at 65°C. Captured DNA/RNA hybrids were recovered with Dynabeads MyOne Streptavidin T1 (Dynal) and DNA was eluted from the beads and purified using Ampure XP beads (Agencourt). Sure Select Post-Capture Indexing forward and Index PCR reverse primers (Agilent) were used to amplify purified capture products.
Exome libraries were loaded onto paired-end flow cells at equimolar concentrations of 7–8 pM to generate cluster densities of 600,000–800,000/mm2 using the Illumina cBot and HiSeq Paired-end cluster kit version 3, following Illumina’s standard protocol. Each lane of a HiSeq flow cell produced 21–39 gigabases of sequence, and the level of sample pooling was controlled by the size of the capture region and the desired depth of coverage. The flow cells were sequenced as 101 × 2 paired-end reads on an Illumina HiSeq 2000 using TruSeq SBS sequencing kit version 3 and HiSeq data collect version 2.0.12.0 software. Base calling was performed using Illumina’s RTA version 1.17.21.3.
The Illumina paired-end reads were aligned to the hg19 reference genome using NovoAlign (Novacraft), followed by the sorting and marking of duplicate reads with Picard (http://picard.sourceforge.net). The Genome Analysis Toolkit (GATK; Broad Institute) was used for local realignment of insertions/deletions (INDELs) and base quality score recalibration. Single nucleotide variants and INDELs were called across all of the samples simultaneously using GATK’s UnifiedGenotyper (Broad Institute) with variant quality score recalibration (44).
Following WES, sequencing data were analyzed using QIAGEN’s Ingenuity Variant Analysis Software (Qiagen) and filtered following steps and criteria outline in Figure 1D. First, only variants with acceptable quality scores (read depth of at least 10, genotype quality of at least 20, and present in genes outside the top 1% of genes with high variability) were put through the filtering process. Next, filters identified nonsynonymous or protein-altering variants, including frameshift INDEL, in-frame INDEL, missense, nonsense, or splice error. Because of the complete absence of a NS and/or cardiac phenotype in both parents, WES data were analyzed assuming either a sporadic or autosomal recessive inheritance model. Protein-altering variants considered for the sporadic model were filtered to include only ultra-rare variants (MAF < 0.005% in AFC, n = 13,000, ref. 45; ExAC, n = 60,706, ref. 23; 1KG, n = 1,094, ref. 46; and the National Heart, Lung and Blood Institute Grand Opportunity ESP, n = 6,503, ref. 47) that were absent in the exomes of both parents. For the recessive inheritance model, only rare (MAF < 1.0% in the AFC, ExAC, 1KG, and ESP databases) variants present as either homozygotes (same mutation inherited from both parents) or compound heterozygotes (two unique mutations in the same gene each inherited from a different parent) were considered.
Candidate gene priority ranking was performed on candidate genes identified by Ingenuity analysis. Candidate genes were ranked by ToppGene (48) and Endeavour (49) disease-network analysis candidate gene–ranking algorithms based on association with the currently known NS-susceptibility genes (PTPN11, SOS1, RAF1, KRAS, NRAS, RIT1, BRAF, MEK1, SHOC2, and CBL). Default settings for each tool were used. A cumulative “rank list” was assembled based on the combination of each algorithm’s read out to determine the best overall candidate between the two tools. The MAF of each variant in gnomAD was determined as well as the constraint score in ExAC. Constraint scores were calculated by ExAC to determine a gene’s intolerance to variation. For synonymous and missense variants, a signed Z score was calculated based on the deviation of the observed number of variants from the expected number. Positive Z scores indicate increased constraint and, therefore, intolerance to variation. Negative Z scores indicate that a gene has more variants than expected. For loss-of-function variants, a pLI (probability of being loss-of-function intolerant) was calculated. The number of observed and expected variants were used to determine the probability that a given gene was extremely intolerant to loss-of-function variation. A pLI ≥ 0.9 is considered an extremely loss-of-function intolerant gene (23). Tissue expression was evaluated by Expression Atlas (50).
In silico analysis.
The phylogenetic and physiochemical properties of patient-derived MRAS and MICAL2 mutations were assessed by commonly used in silico prediction tools: PolyPhen2 (polymorphism phenotyping), PROVEAN (Protein Variation Effect Analyzer), SIFT (Sorting Intolerant From Tolerant), Mutation Assessor, fathmm (functional analysis through hidden Markov models), and Align-GVGD. The assumptions and exact methodology employed by each tool have been described previously (51–58).
DNA Sanger sequencing for variant confirmation.
Following design of variant-specific primers (Supplemental Table 2), standard DNA dye terminator cycle sequencing protocols and an ABI Prism 377 automated sequencer (Applied Biosystems Inc.) were used for direct DNA sequencing confirmation of the MRAS (NM_012219) mutation (c.68G>T) in the index case. Absence of the mutation was also confirmed in both parents, and maternity/paternity was verified. DNA sequence and chromatograms were analyzed using Chromas version 1.45 (Technelysium) and Sequencher version 5.4.1 sequence analysis software (Gene Codes Corporation).
Structural bioinformatics, molecular modeling, and molecular dynamics simulations.
Linear motif and paralog annotation analyses were performed as previously described (59, 60). Briefly, for this purpose multiple sequence alignment of paralogs was generated using paralog sequences gathered from Ensembl (61) gene ENSG00000158186 using annotations from GRCh38.p8. The multiple sequence alignment was constructed using T-COFFEE as previously described (62). Published variants in paralogs were obtained from PubMed and projected on the sequence of human MRAS (Figure 2) (11, 14, 32, 35).
For structural modeling, we followed an approach previously described by our laboratory (63). Homology-based protein structure models were constructed using Modeller version 9.15 (64, 65). Using the previously modeled state I structure of the murine MRAS protein (PDB: 1X1R), WT-MRAS and p.Gly23Val-MRAS were modeled by homology and modified by in silico mutagenesis followed by energy minimization (Supplemental Figure 4) (66, 67). The quality of this model was determined by generating Ramachandran plots (Psi vs. Phi angles plots), using PROCHECK (68), which revealed that 97% of residues were in favored and allowed regions (Supplemental Figure 4). Twenty nanosecond MDS were performed using the all-atom force field in CHARMM c36b2 at a temperature of 300 K (NPT ensemble). A distance-dependent, dielectrics-implicit solvent model was used with a dielectric constant of 80 and a pH of 7.4 (66). Changes in bonding patterns, root-mean-square deviations, and root-mean-square fluctuations and the state of the switch I and II regions were measured. Comparative changes in the structure of WT-MRAS and p.Gly23Val-MRAS, after MDS, were visualized by both superimpositions on a surface level as well as secondary structure component. For the surface analyses, water-accessible surface parameters and representation were used.
Plasmids and antibodies.
A pcDNA3.1+C-HA vector customized with MRAS cDNA subcloned in at 5′BamHI-3′XhoI sites was purchased from GenScript. cDNA sequence was verified by sequencing. p.Gly23Val-MRAS missense mutations were engineered into pcDNA3.1-MRAS-C-HA vector using primers containing the missense mutations with the Quikchange II XL Site-Directed Mutagenesis Kit (Stratagene). The mutant constructs were verified by sequencing.
Primary antibodies were used at the following dilutions: anti-phospho-ERK1/2 (1:1,000, Cell Signaling 9101) in 3% BSA, anti-ERK1/2 (1:1,000, Cell Signaling 9102) in 3% BSA, anti-HA tag (1:1,000, Santa Cruz Biotechnology SC-7392) in 3% BSA, and β-actin (1:5,000, Sigma-Aldrich A2228) in 5% nonfat dried milk. Phospho-ERK1/2, ERK1/2, HA-tagged MRAS, and β-actin proteins were detected with horseradish peroxidase–conjugated secondary antibody. Secondary antibodies were used at the following dilutions: anti-rabbit-HRP (1:5,000, phopho-ERK and ERK1/2) or anti-mouse-HRP (1:5,000, HA-tag and β-actin).
Transfection and immunoblotting.
HEK293T/17 cells (ATCC CRL-11268) were cultured in DMEM (ThermoFisher) supplemented with 10% FBS and 1% antibiotic/antimycotic in a 5% CO2 incubator at 37°C. MEF (MTI-GlobalStem GSC-6002) cells were cultured in DMEM supplemented with 15% FBS, 1% antibiotic/antimycotic in a 5% CO2 incubator at 37°C.
For Ras and ERK activation assays, prior to transfection, HEK293T/17 cells were seeded in 100-mm dishes at a density of 3 × 10⁶ to 5 × 10⁶ cells per plate. Expression of MRAS was accomplished by transfecting 10 μg MRAS WT or mutant p.Gly23Val-MRAS cDNA with the use of Effectene Transfection Reagent (Qiagen) according to the manufacturer’s instructions. Transfection media were removed after 15 hours and replaced with complete DMEM media containing 10% FBS. Twenty-four hours after transfection, cells were cultured in serum starvation medium (0% DMEM) for an additional 24 hours prior to EGF treatment.
For luciferase reporter assays, prior to transfection, MEF cells were seeded in 100-mm dishes at a density of 4 × 10⁶ cells per plate. Coexpression of MRAS and SRE was accomplished by transfecting 9 μg MRAS WT or mutant p.Gly23Val-MRAS cDNA and 3 μg pSRE-Luc plasmid cis-reporter plasmid (Agilent) with the use of Lipofectamine 3000 Reagent (ThermoFisher) according to the manufacturer’s instruction. Coexpression with the empty effector vector allowed for normalization to basal transcriptional activity. Twenty-four hours after transfection, MEF cells were plated on 6-well plates in 15% DMEM. Eight hours after plating, complete medium (15% DMEM) was removed and cells were cultured in serum starvation medium (0% DMEM) for 24 hours prior to EGF treatment.
For Western blot analyses, protein was run on 14% gel over 3 hours at 80 V, followed by transfer to Immobilon-P transfer membrane (Millipore). Membranes were incubated for 1 hour in blocking solution (Tris-buffered saline solution containing 3% BSA or 5% nonfat dried milk and 0.1% Tween-20). After blocking, immunoblotting was performed with specified primary antibodies overnight at 4°C. Immune complexes were visualized using an ECL luminescence detection kit (ThermoScientific, Pierce ECL Western Blotting Substrate) and resolved on X-ray film. Exposed films were scanned, and digitized images were analyzed using ImageJ software (NIH).
Ras activation assay.
In order to assess the effect of the p.Gly23Val mutation on MRAS activation and GTP loading, Ras activation assays were carried out using a Ras activation assay kit (Millipore 17-218) according to the manufacturer’s instructions. Briefly, after stimulation with EGF (100 ng/ml) for 5 or 30 minutes at 37°C, cells were washed in ice-cold PBS and collected in 1× MLB lysis buffer. Active Ras was pulled down by incubation of cell lysates with GST-Raf-RBD prebound to glutathione sepharose, followed by centrifugation and resuspension of beads in 4× Laemmli sample buffer. Bound proteins were then subjected to electrophoresis and blotted with an anti-HA tag (1:1,000, Santa Cruz Biotechnology) in 3% BSA overnight followed by an anti-mouse-HRP (1:5000) conjugate and ECL luminescence detection (ThermoScientific, Pierce ECL Western Blotting Substrate).
MRAS activation was assessed by densitometry using ImageJ software. For each sample, the ratio of GTP-MRAS to total MRAS was calculated. The relative MRAS activation for p.Gly23Val-MRAS was calculated by normalizing the WT-MRAS sample to 1.
ERK activation assay.
In order to assess the effect of p.Gly23Val-MRAS on MAPK pathway regulation, ERK activation assays were carried out. Briefly, after stimulation with EGF (100 ng/ml) for the indicated time intervals at 37°C, cells were lysed in 4× Laemmli sample buffer and sonicated for 10–15 seconds. Lysates were then subjected to electrophoresis and blotted with antibodies against Phospho-ERK1/2, ERK1/2, HA-tagged MRAS, and β-actin as described.
ERK activation was assessed by densitometry using ImageJ software. For each sample, the ratio of pERK to total ERK was calculated. This ratio was normalized for HA-MRAS expression in the sample. The relative ERK activation for p.Gly23Val-MRAS was calculated by normalizing the WT-MRAS sample for each time point to the average ERK activation of the 3 WT biological replicates at each time point.
Luciferase reporter assay.
Luciferase reporter assays were used to assess the effect of p.Gly23Val-MRAS on RAS/MAPK pathway signaling and downstream transcriptional activity. Fifty-six hours after transfection, cells were stimulated with EGF (100 ng/ml) for the indicated time intervals at 37°C. Cell lysates were prepared by adding 150 μl PLB to each well. The relative luciferase activity was measured using the luciferase assay system (Promega) and read using a Turner 20/20 luminometer. Luciferase activities were normalized to protein concentration, as measured by bicinchoninic acid assay, for each sample. The relative luciferase expression for each sample was calculated by normalizing empty vector at time 0 (hour) to 1.
MRAS candidate gene mutational analysis in a cohort of unrelated patients with phenotype-positive/genotype-negative NS with concomitant cardiac hypertrophy.
A cohort composed of 109 unrelated patients with cardiac hypertrophy and a clinical diagnosis of NS, other RASopathy, or suspected RASopathy, who were heretofore mutation negative after analysis of the known NS-susceptibility genes (i.e., genotype negative/phenotype positive), was analyzed for MRAS mutations.
Comprehensive mutational analysis of all 5 coding region exons of MRAS was performed on genomic DNA from these 109 patients using PCR and direct DNA sequencing. Only rare, nonsynonymous mutations absent in the gnomAD database were considered to be pathogenic. PCR reactions were performed in 20-μl volumes using 50 ng DNA, 16 pmol of each primer, 200 μM of each dNTP, 50 mMol/l KCl, 10 mMol/l Tris-HCl (pH 8.3), 2 mMol/l MgCl2, and 1.0 U Amplitaq Gold (Roche Molecular Systems). PCR amplification was performed using a DNA Engine Tetrad 2 thermal cycler (Bio-Rad) using the following thermal cycling conditions: 94°C initial denaturation for 15 minutes; followed by 35 cycles of 94°C for 30 seconds, 58°C for 30 seconds, and 72°C for 30 seconds; and a final extension of 72°C for 10 minutes. PCR primer sequences are available in Supplemental Table 2.
Statistics.
Results are presented as mean ± SEM. For Ras activation assays, statistical differences between WT-MRAS– and p.Gly23Val-MRAS–expressing cells were analyzed by unpaired, 2-tailed Student’s t test. Differences were considered statistically significant at P ≤ 0.05. For ERK activation assays, statistical differences between WT-MRAS– and p.Gly23Val-MRAS–expressing cells were analyzed by unpaired, 2-tailed Student’s t test with Bonferroni multiple-significance-test correction, with P ≤ 0.008 considered statistically significant. Luciferase reporter assays were analyzed by 2-way ANOVA with Tukey’s multiple-comparison-test correction. P ≤ 0.01 was considered significant for luciferase reporter assays.
Study approval.
WES and subsequent studies of the index case were performed following written informed consent and were approved by the Mayo Clinic IRB. For the cohort analysis, all patient samples had been submitted previously to the Laboratory of Molecular Medicine, Partners Healthcare, for commercial genetic testing for suspected NS or related RASopathy; testing of these samples was approved by the Partners HealthCare IRB. Informed written patient/guardian consent for each patient was obtained at their respective institutions (Mayo Clinic and Alfred I. duPont Hospital for Children) for the publication of genetic test results, photographs, and imaging study results.
Author contributions
EMH performed the experiments and contributed to conceptualization of the project, experimental design, data acquisition and analysis, and the writing of the manuscript. JMB contributed to conceptualization of the project, the design of research studies and experiments, data analysis, and the writing of the manuscript. HMS contributed to data acquisition. DJT contributed to data acquisition and analysis. JPA contributed to data analysis. CAM contributed to design of research studies and experiments. KSC and KWG contributed to acquisition and analysis of data. RU contributed to design of research studies and experiments, performance of experiments, data acquisition and analysis, and the writing of the manuscript. MJA contributed to conceptualization of the project, design of research studies and experiments, data acquisition and analysis, and the writing of the manuscript. All authors discussed the results and commented on the manuscript.
Supplementary Material
Acknowledgments
We thank the patients and their families for their participation in this study as well as Angela J. Mathison, Monique Williams, and Deborah L. Stabley for technical support. This work was supported by the Mayo Clinic Graduate School of Biomedical Sciences (to EMH), the Windland Smith Rice Comprehensive Sudden Cardiac Death Program (to EMH, JMB, DJT, JPA, and MJA), the NIH (DK52913, to RU), the Mayo Clinic Center for Cell Signaling in Gastroenterology (P30DK084567, to RU), the Mayo Clinic Center for Individualized Medicine (to RU and MJA), the National Center for Advancing Translational Sciences (UL1 TR000135), and the Institutional Development Award from the NIH’s National Institute of General Medical Sciences under grant numbers P20GM103446 and P30GM114736 (to KS). Its contents are solely the responsibility of the authors and do not necessarily represent the official views of the NIH.
Footnotes
Conflict of interest: D.J. Tester and M.J. Ackerman receive royalties from Transgenomic for the FAMILION genetic tests. M.J. Ackerman is a consultant for or is on the advisory board of Boston Scientific, Gilead Sciences, Invitae, Medtronic, MyoKardia, and St. Jude Medical.
Reference information:JCI Insight. 2017;2(5):e91225. https://doi.org/10.1172/jci.insight.91225.
Contributor Information
Heather Mason-Suares, Email: hmason-suares@partners.org.
Calum A. MacRae, Email: macrae@cvrc.mgh.harvard.edu.
Katia Sol-Church, Email: Katia.SolChurch@nemours.org.
Karen W. Gripp, Email: Karen.Gripp@nemours.org.
Raul Urrutia, Email: urrutia.raul@mayo.edu.
References
- 1.Mendez HM, Opitz JM. Noonan syndrome: a review. Am J Med Genet. 1985;21(3):493–506. doi: 10.1002/ajmg.1320210312. [DOI] [PubMed] [Google Scholar]
- 2.Allanson JE. Noonan syndrome. J Med Genet. 1987;24(1):9–13. doi: 10.1136/jmg.24.1.9. [DOI] [PMC free article] [PubMed] [Google Scholar]
- 3.Noonan JA. Hypertelorism with Turner phenotype. A new syndrome with associated congenital heart disease. Am J Dis Child. 1968;116(4):373–380. doi: 10.1001/archpedi.1968.02100020377005. [DOI] [PubMed] [Google Scholar]
- 4.Burch M, Sharland M, Shinebourne E, Smith G, Patton M, McKenna W. Cardiologic abnormalities in Noonan syndrome: phenotypic diagnosis and echocardiographic assessment of 118 patients. J Am Coll Cardiol. 1993;22(4):1189–1192. doi: 10.1016/0735-1097(93)90436-5. [DOI] [PubMed] [Google Scholar]
- 5.Prendiville TW, et al. Cardiovascular disease in Noonan syndrome. Arch Dis Child. 2014;99(7):629–634. doi: 10.1136/archdischild-2013-305047. [DOI] [PubMed] [Google Scholar]
- 6.Tartaglia M, et al. Mutations in PTPN11, encoding the protein tyrosine phosphatase SHP-2, cause Noonan syndrome. Nat Genet. 2001;29(4):465–468. doi: 10.1038/ng772. [DOI] [PubMed] [Google Scholar]
- 7.Tartaglia M, et al. Gain-of-function SOS1 mutations cause a distinctive form of Noonan syndrome. Nat Genet. 2007;39(1):75–79. doi: 10.1038/ng1939. [DOI] [PubMed] [Google Scholar]
- 8.Roberts AE, et al. Germline gain-of-function mutations in SOS1 cause Noonan syndrome. Nat Genet. 2007;39(1):70–74. doi: 10.1038/ng1926. [DOI] [PubMed] [Google Scholar]
- 9.Pandit B, et al. Gain-of-function RAF1 mutations cause Noonan and LEOPARD syndromes with hypertrophic cardiomyopathy. Nat Genet. 2007;39(8):1007–1012. doi: 10.1038/ng2073. [DOI] [PubMed] [Google Scholar]
- 10.Razzaque MA, et al. Germline gain-of-function mutations in RAF1 cause Noonan syndrome. Nat Genet. 2007;39(8):1013–1017. doi: 10.1038/ng2078. [DOI] [PubMed] [Google Scholar]
- 11.Schubbert S, et al. Germline KRAS mutations cause Noonan syndrome. Nat Genet. 2006;38(3):331–336. doi: 10.1038/ng1748. [DOI] [PubMed] [Google Scholar]
- 12.Aoki Y, et al. Gain-of-function mutations in RIT1 cause Noonan syndrome, a RAS/MAPK pathway syndrome. Am J Hum Genet. 2013;93(1):173–180. doi: 10.1016/j.ajhg.2013.05.021. [DOI] [PMC free article] [PubMed] [Google Scholar]
- 13.Kouz K, et al. Genotype and phenotype in patients with Noonan syndrome and a RIT1 mutation. Genet Med. 2016;18(12):1226–1234. doi: 10.1038/gim.2016.32. [DOI] [PubMed] [Google Scholar]
- 14.Cirstea IC, et al. A restricted spectrum of NRAS mutations causes Noonan syndrome. Nat Genet. 2010;42(1):27–29. doi: 10.1038/ng.497. [DOI] [PMC free article] [PubMed] [Google Scholar]
- 15.Flex E, et al. Activating mutations in RRAS underlie a phenotype within the RASopathy spectrum and contribute to leukaemogenesis. Hum Mol Genet. 2014;23(16):4315–4327. doi: 10.1093/hmg/ddu148. [DOI] [PMC free article] [PubMed] [Google Scholar]
- 16.Martinelli S, et al. Heterozygous germline mutations in the CBL tumor-suppressor gene cause a Noonan syndrome-like phenotype. Am J Hum Genet. 2010;87(2):250–257. doi: 10.1016/j.ajhg.2010.06.015. [DOI] [PMC free article] [PubMed] [Google Scholar]
- 17.Yamamoto GL, et al. Rare variants in SOS2 and LZTR1 are associated with Noonan syndrome. J Med Genet. 2015;52(6):413–421. doi: 10.1136/jmedgenet-2015-103018. [DOI] [PubMed] [Google Scholar]
- 18.Cordeddu V, et al. Mutation of SHOC2 promotes aberrant protein N-myristoylation and causes Noonan-like syndrome with loose anagen hair. Nat Genet. 2009;41(9):1022–1026. doi: 10.1038/ng.425. [DOI] [PMC free article] [PubMed] [Google Scholar]
- 19.Gripp KW, et al. A novel rasopathy caused by recurrent de novo missense mutations in PPP1CB closely resembles Noonan syndrome with loose anagen hair. Am J Med Genet A. 2016;170(9):2237–2247. doi: 10.1002/ajmg.a.37781. [DOI] [PMC free article] [PubMed] [Google Scholar]
- 20.Yoon S, Seger R. The extracellular signal-regulated kinase: multiple substrates regulate diverse cellular functions. Growth Factors. 2006;24(1):21–44. doi: 10.1080/02699050500284218. [DOI] [PubMed] [Google Scholar]
- 21.Krens SF, Spaink HP, Snaar-Jagalska BE. Functions of the MAPK family in vertebrate-development. FEBS Lett. 2006;580(21):4984–4990. doi: 10.1016/j.febslet.2006.08.025. [DOI] [PubMed] [Google Scholar]
- 22.Tidyman WE, Rauen KA. The RASopathies: developmental syndromes of Ras/MAPK pathway dysregulation. Curr Opin Genet Dev. 2009;19(3):230–236. doi: 10.1016/j.gde.2009.04.001. [DOI] [PMC free article] [PubMed] [Google Scholar]
- 23.Lek M, et al. Analysis of protein-coding genetic variation in 60,706 humans. Nature. 2016;536(7616):285–291. doi: 10.1038/nature19057. [DOI] [PMC free article] [PubMed] [Google Scholar]
- 24.Dinkel H, et al. The eukaryotic linear motif resource ELM: 10 years and counting. Nucleic Acids Res. 2014;42(Database issue):D259–D266. doi: 10.1093/nar/gkt1047. [DOI] [PMC free article] [PubMed] [Google Scholar]
- 25.Rajalingam K, Schreck R, Rapp UR, Albert S. Ras oncogenes and their downstream targets. Biochim Biophys Acta. 2007;1773(8):1177–1195. doi: 10.1016/j.bbamcr.2007.01.012. [DOI] [PubMed] [Google Scholar]
- 26.Shima F, et al. Structural basis for conformational dynamics of GTP-bound Ras protein. J Biol Chem. 2010;285(29):22696–22705. doi: 10.1074/jbc.M110.125161. [DOI] [PMC free article] [PubMed] [Google Scholar]
- 27.Sala V, Gallo S, Leo C, Gatti S, Gelb BD, Crepaldi T. Signaling to cardiac hypertrophy: insights from human and mouse RASopathies. Mol Med. 2012;18:938–947. doi: 10.2119/molmed.2011.00512. [DOI] [PMC free article] [PubMed] [Google Scholar]
- 28.Ferrero GB, et al. Transcriptional hallmarks of Noonan syndrome and Noonan-like syndrome with loose anagen hair. Hum Mutat. 2012;33(4):703–709. doi: 10.1002/humu.22026. [DOI] [PMC free article] [PubMed] [Google Scholar]
- 29.Rodriguez-Viciana P, Oses-Prieto J, Burlingame A, Fried M, McCormick F. A phosphatase holoenzyme comprised of Shoc2/Sur8 and the catalytic subunit of PP1 functions as an M-Ras effector to modulate Raf activity. Mol Cell. 2006;22(2):217–230. doi: 10.1016/j.molcel.2006.03.027. [DOI] [PubMed] [Google Scholar]
- 30.Young LC, et al. An MRAS, SHOC2, and SCRIB complex coordinates ERK pathway activation with polarity and tumorigenic growth. Mol Cell. 2013;52(5):679–692. doi: 10.1016/j.molcel.2013.10.004. [DOI] [PubMed] [Google Scholar]
- 31.Kobayashi T, et al. Molecular and clinical analysis of RAF1 in Noonan syndrome and related disorders: dephosphorylation of serine 259 as the essential mechanism for mutant activation. Hum Mutat. 2010;31(3):284–294. doi: 10.1002/humu.21187. [DOI] [PubMed] [Google Scholar]
- 32.Aoki Y, et al. Germline mutations in HRAS proto-oncogene cause Costello syndrome. Nat Genet. 2005;37(10):1038–1040. doi: 10.1038/ng1641. [DOI] [PubMed] [Google Scholar]
- 33.Donovan S, Shannon KM, Bollag G. GTPase activating proteins: critical regulators of intracellular signaling. Biochim Biophys Acta. 2002;1602(1):23–45. doi: 10.1016/s0304-419x(01)00041-5. [DOI] [PubMed] [Google Scholar]
- 34.Vetter IR, Wittinghofer A. The guanine nucleotide-binding switch in three dimensions. Science. 2001;294(5545):1299–1304. doi: 10.1126/science.1062023. [DOI] [PubMed] [Google Scholar]
- 35.Gripp KW, et al. Costello syndrome associated with novel germline HRAS mutations: an attenuated phenotype? Am J Med Genet A. 2008;146A(6):683–690. doi: 10.1002/ajmg.a.32227. [DOI] [PubMed] [Google Scholar]
- 36.Ehrhardt GR, Leslie KB, Lee F, Wieler JS, Schrader JW. M-Ras, a widely expressed 29-kD homologue of p21 Ras: expression of a constitutively active mutant results in factor-independent growth of an interleukin-3-dependent cell line. Blood. 1999;94(7):2433–2444. [PubMed] [Google Scholar]
- 37.Kimmelman A, Tolkacheva T, Lorenzi MV, Osada M, Chan AM. Identification and characterization of R-ras3: a novel member of the RAS gene family with a non-ubiquitous pattern of tissue distribution. Oncogene. 1997;15(22):2675–2685. doi: 10.1038/sj.onc.1201674. [DOI] [PubMed] [Google Scholar]
- 38.Wang Y. Mitogen-activated protein kinases in heart development and diseases. Circulation. 2007;116(12):1413–1423. doi: 10.1161/CIRCULATIONAHA.106.679589. [DOI] [PMC free article] [PubMed] [Google Scholar]
- 39.Bentires-Alj M, Kontaridis MI, Neel BG. Stops along the RAS pathway in human genetic disease. Nat Med. 2006;12(3):283–285. doi: 10.1038/nm0306-283. [DOI] [PubMed] [Google Scholar]
- 40.Kimmelman AC, Osada M, Chan AM. R-Ras3, a brain-specific Ras-related protein, activates Akt and promotes cell survival in PC12 cells. Oncogene. 2000;19(16):2014–2022. doi: 10.1038/sj.onc.1203530. [DOI] [PubMed] [Google Scholar]
- 41.Harvey PA, Leinwand LA. The cell biology of disease: cellular mechanisms of cardiomyopathy. J Cell Biol. 2011;194(3):355–365. doi: 10.1083/jcb.201101100. [DOI] [PMC free article] [PubMed] [Google Scholar]
- 42.Altmann HM, et al. Homozygous/compound heterozygous Triadin mutations associated with autosomal-recessive long-QT syndrome and pediatric sudden cardiac arrest: elucidation of the Triadin knockout syndrome. Circulation. 2015;131(23):2051–2060. doi: 10.1161/CIRCULATIONAHA.115.015397. [DOI] [PubMed] [Google Scholar]
- 43.Boczek NJ, et al. Identification and functional characterization of a novel CACNA1C-mediated cardiac disorder characterized by prolonged QT intervals with hypertrophic cardiomyopathy, congenital heart defects, and sudden cardiac death. Circ Arrhythm Electrophysiol. 2015;8(5):1122–1132. doi: 10.1161/CIRCEP.115.002745. [DOI] [PMC free article] [PubMed] [Google Scholar]
- 44.DePristo MA, et al. A framework for variation discovery and genotyping using next-generation DNA sequencing data. Nat Genet. 2011;43(5):491–498. doi: 10.1038/ng.806. [DOI] [PMC free article] [PubMed] [Google Scholar]
- 45.Wendelsdorf K, Shah S. Empowered genome community: leveraging a bioinformatics platform as a citizen-scientist collaboration tool. Appl Transl Genom. 2015;6:7–10. doi: 10.1016/j.atg.2015.08.002. [DOI] [PMC free article] [PubMed] [Google Scholar]
- 46.Clarke L, et al. The 1000 Genomes Project: data management and community access. Nat Methods. 2012;9(5):459–462. doi: 10.1038/nmeth.1974. [DOI] [PMC free article] [PubMed] [Google Scholar]
- 47. Exome Variant Server, NHLBI GO Exome Sequencing Project (ESP), Seattle, WA. http://evs.gs.washington.edu/EVS/) Accessed January 13, 2016.
- 48.Chen J, Xu H, Aronow BJ, Jegga AG. Improved human disease candidate gene prioritization using mouse phenotype. BMC Bioinformatics. 2007;8:392. doi: 10.1186/1471-2105-8-392. [DOI] [PMC free article] [PubMed] [Google Scholar]
- 49.Aerts S, et al. Gene prioritization through genomic data fusion. Nat Biotechnol. 2006;24(5):537–544. doi: 10.1038/nbt1203. [DOI] [PubMed] [Google Scholar]
- 50.Petryszak R, et al. Expression Atlas update--an integrated database of gene and protein expression in humans, animals and plants. Nucleic Acids Res. 2016;44(D1):D746–D752. doi: 10.1093/nar/gkv1045. [DOI] [PMC free article] [PubMed] [Google Scholar]
- 51.Ramensky V, Bork P, Sunyaev S. Human non-synonymous SNPs: server and survey. Nucleic Acids Res. 2002;30(17):3894–3900. doi: 10.1093/nar/gkf493. [DOI] [PMC free article] [PubMed] [Google Scholar]
- 52.Choi Y, Sims GE, Murphy S, Miller JR, Chan AP. Predicting the functional effect of amino acid substitutions and indels. PLoS ONE. 2012;7(10):e46688. doi: 10.1371/journal.pone.0046688. [DOI] [PMC free article] [PubMed] [Google Scholar]
- 53.Kumar P, Henikoff S, Ng PC. Predicting the effects of coding non-synonymous variants on protein function using the SIFT algorithm. Nat Protoc. 2009;4(7):1073–1081. doi: 10.1038/nprot.2009.86. [DOI] [PubMed] [Google Scholar]
- 54.Reva B, Antipin Y, Sander C. Determinants of protein function revealed by combinatorial entropy optimization. Genome Biol. 2007;8(11):R232. doi: 10.1186/gb-2007-8-11-r232. [DOI] [PMC free article] [PubMed] [Google Scholar]
- 55.Reva B, Antipin Y, Sander C. Predicting the functional impact of protein mutations: application to cancer genomics. Nucleic Acids Res. 2011;39(17):e118. doi: 10.1093/nar/gkr407. [DOI] [PMC free article] [PubMed] [Google Scholar]
- 56.Shihab HA, et al. Predicting the functional, molecular, and phenotypic consequences of amino acid substitutions using hidden Markov models. Hum Mutat. 2013;34(1):57–65. doi: 10.1002/humu.22225. [DOI] [PMC free article] [PubMed] [Google Scholar]
- 57.Mathe E, Olivier M, Kato S, Ishioka C, Hainaut P, Tavtigian SV. Computational approaches for predicting the biological effect of p53 missense mutations: a comparison of three sequence analysis based methods. Nucleic Acids Res. 2006;34(5):1317–1325. doi: 10.1093/nar/gkj518. [DOI] [PMC free article] [PubMed] [Google Scholar]
- 58.Tavtigian SV, et al. Comprehensive statistical study of 452 BRCA1 missense substitutions with classification of eight recurrent substitutions as neutral. J Med Genet. 2006;43(4):295–305. doi: 10.1136/jmg.2005.033878. [DOI] [PMC free article] [PubMed] [Google Scholar]
- 59.Boczek NJ, et al. Functional characterization of a GFAP variant of uncertain significance in an Alexander disease case within the setting of an individualized medicine clinic. Clin Case Rep. 2016;4(9):885–895. doi: 10.1002/ccr3.655. [DOI] [PMC free article] [PubMed] [Google Scholar]
- 60.Urrutia R, Velez G, Lin M, Lomberk G, Neira JL, Iovanna J. Evidence supporting the existence of a NUPR1-like family of helix-loop-helix chromatin proteins related to, yet distinct from, AT hook-containing HMG proteins. J Mol Model. 2014;20(8):2357. doi: 10.1007/s00894-014-2357-7. [DOI] [PMC free article] [PubMed] [Google Scholar]
- 61.Cunningham F, et al. Ensembl 2015. Nucleic Acids Res. 2015;43(Database issue):D662–D669. doi: 10.1093/nar/gku1010. [DOI] [PMC free article] [PubMed] [Google Scholar]
- 62.Notredame C, Higgins DG, Heringa J. T-Coffee: A novel method for fast and accurate multiple sequence alignment. J Mol Biol. 2000;302(1):205–217. doi: 10.1006/jmbi.2000.4042. [DOI] [PubMed] [Google Scholar]
- 63.Velez G, Lin M, Christensen T, Faubion WA, Lomberk G, Urrutia R. Evidence supporting a critical contribution of intrinsically disordered regions to the biochemical behavior of full-length human HP1γ. J Mol Model. 2016;22(1):12. doi: 10.1007/s00894-015-2874-z. [DOI] [PMC free article] [PubMed] [Google Scholar]
- 64.Sali A, Blundell TL. Comparative protein modelling by satisfaction of spatial restraints. J Mol Biol. 1993;234(3):779–815. doi: 10.1006/jmbi.1993.1626. [DOI] [PubMed] [Google Scholar]
- 65.Webb B, Sali A. Comparative Protein Structure Modeling Using MODELLER. Curr Protoc Bioinformatics. 2014;47:5.6.1–5.632. doi: 10.1002/0471250953.bi0506s47. [DOI] [PubMed] [Google Scholar]
- 66. Dassault Systèmes BIOVIA, Discovery Studio Modeling Environment. http://accelrys.com/products/collaborative-science/biovia-discovery-studio/ Accessed February 20, 2016.
- 67.Ryckaert JP, Ciccotti G, Berendsen HJC. Numerical integration of the cartesian equations of motion of a system with constraints: molecular dynamics of n-alkanes. J Comput Phys. 1977;23(3):327–341. doi: 10.1016/0021-9991(77)90098-5. [DOI] [Google Scholar]
- 68.Laskowski RA, Rullmannn JA, MacArthur MW, Kaptein R, Thornton JM. AQUA and PROCHECK-NMR: programs for checking the quality of protein structures solved by NMR. J Biomol NMR. 1996;8(4):477–486. doi: 10.1007/BF00228148. [DOI] [PubMed] [Google Scholar]
Associated Data
This section collects any data citations, data availability statements, or supplementary materials included in this article.


