Abstract
HER2+ breast tumors have been shown to express elevated levels of poly (ADP-ribose) polymerase 1 (PARP1) protein. Yet, the mechanism by which PARP1 is upregulated in HER2+ breast cancer is unknown. Here, knockdown of HER2 (ERBB2) in HER2+ breast cancer cells resulted in a reduction in PARP1 protein. Conversely, ectopic overexpression of HER2 in a non-HER2 overexpressing cell line resulted in increased PARP1 protein. Alterations in HER2 expression had no significant effect on PARP1 transcript levels. Instead, HER2 mRNA status was inversely correlated with let-7a microRNA (miRNA) levels in breast cancer cells. Ectopic expression of let-7a miRNA resulted in downregulation of PARP1 protein while expression of the let-7a anti-miRNA increased PARP1 protein. Further, luciferase assays demonstrate that let-7a regulates PARP1 via its 3'UTR. Importantly, let-7a was significantly lower in human HER2-positive breast tumors compared to HER2-negative breast tumors and inversely correlated with PARP1 protein levels. Lastly, HER2+ breast cancer cells exhibited similar cytotoxicity to ectopic let-7a expression as the PARP inhibitor veliparib (ABT-888). Collectively these results reveal that increased PARP1 expression in HER2+ breast cancers is regulated by the let-7a miRNA, and that let-7a is a potential strategy to suppress PARP1 activity. Implications: This study reports the novel findings that HER2 increases PARP1 protein via suppression of the let-7a miRNA, which regulates the PARP1 3'-UTR. Moreover, HER2 status correlates with high PARP1 and low let-7a in breast cancer clinical specimens.
Keywords: Human epidermal growth factor receptor 2, poly (ADP-ribose) polymerase-1 (PARP1) breast cancer, let-7a, miRNA, PARP inhibitors
Introduction
Poly (ADP-ribose) polymerase inhibitors (PARPi) are a novel targeted therapy for homologous recombination (HR) deficient tumors, and are extremely well tolerated (1). These agents target PARP1, an enzyme that has multiple cellular functions (2). Its most studied roles include DNA repair and transcription (3,4). PARP1 is also overexpressed in many cancer cells compared to normal cells (5).
We previously reported that ectopic overexpression of HER2 itself was sufficient to confer susceptibility to PARPi while HER2 knockdown in HER2+ breast cancer cells induced resistance to PARPi (6). Our laboratory also recently reported that PARP1 protein expression is elevated in HER2+ human breast tumor tissues as compared to HER2− breast tumor tissues (7). However, the mechanism behind the increased PARP1 expression in this particular breast cancer subtype is unknown.
Recently, multiple studies have shown that miRNAs regulate gene expression at the post-transcriptional level (8). These short non-coding RNAs repress protein synthesis by binding to mRNA to inhibit translation or promote their degradation (9). The expression levels of several miRNAs are also altered in HER2-overexpressing breast carcinomas and can be up- or down-regulated by HER2 (10,11). A recent study demonstrated that PARP1 is targeted by miR-223 in Barrett’s esophagus-associated esophageal adenocarcinoma (12).
In this study, we report for the first time that elevated HER2 expression correlated with reduced let-7a levels and enhanced PARP1 protein expression. Ectopic expression of the let-7a miRNA downregulated PARP1 protein levels while expression of the let-7a anti-miRNA increased PARP1 protein. Further, luciferase assays implicate let-7a in regulating PARP1 via its 3’UTR. Importantly, in human breast tumors, let-7a was expressed at significantly lower levels in human HER2+ breast tumors compared to HER2− breast tumors and inversely correlated with PARP1 protein levels. Lastly, HER2+ breast cancer cells exhibited similar cytotoxicity to ectopic let-7a expression as the PARP inhibitor veliparib (ABT-888). Altogether, these data suggested that a novel connection between let-7a and PARP1 exists in human breast cancer cells, and altering this association may have therapeutic potential in HER2+ breast cancer patients.
Materials and Methods
Cell culture
The HER2+ breast cancer cell lines BT-474 and SKBR3 were generously donated by Dr. Donald Buchsbaum (University of Alabama at Birmingham). The BT-474 was maintained in RPMI medium supplemented with 10% FBS, 10 mM HEPES, 1 mM sodium pyruvate, 4.5 g/L glucose, and 10 µg/mL insulin. SKBR3 were grown in McCoy’s 5A medium supplemented with 15% FBS. MCF7 were maintained in EMEM medium supplemented with 10% FBS and 10 µg/mL insulin and were obtained from ATCC. The cell lines used in these studies were not authenticated in our laboratory but were tested negative for mycoplasma.
HER2 stable cell lines
MDA-MB-231 cells were transfected with 4 µg of the pcDNA3-HER2-WT plasmid (Addgene plasmid 16257) (231 HER2) or pcDNA3-vec (231 NEO) using the Lipofectamine 2000 regent. Briefly, 250,000 cells were seeded in a 6 well dish and then transfected the following day. Cells were selected and grown in selection media with 700 µg/mL G418 (Mediatech, Inc., catalog #: 30-234-CR). Individual G418 resistant-clones were then picked and analyzed for HER2 expression via Western blot analysis. The clones were then expanded and maintained in DMEM with 700 µg/mL G418.
Reagents
Control siRNA (Cell Signaling Technology, catalog # 6568) and HER2 siRNA II (Cell Signaling Technology, catalog # 6283) were purchased from Cell Signaling. Let-7a mimics, let-7a antagomiRs, and negative control miRNAs were purchased from Ambion/Life Technologies. For let-7a mimic studies, we transfected 40,000 cells plated in a 6 well dish with hsa-let-7a-5p (Thermo Fisher, catalog #: AM17100, ID: PM10050) as well as its Negative Control #1 (Thermo Fisher, catalog #: AM17110). The let-7a antagomiR used in this study was anti-hsa-let-7a-5p (Thermo Fisher, catalog #: AM17000, ID: PM10050) as well as its Negative Control #1 (Thermo Fisher, catalog #: AM17010). Both siRNA and miRNA constructs were transfected with the Lipofectamine RNAiMAX reagent (Thermo Fisher, catalog # 13778150), according to the manufacturer-supplied protocol. Co-transfections were performed with the Lipofectamine 2000 reagent (Thermo Fisher, catalog #: 11668019).
Western Blot
Cell lysates were harvested in MPER buffer containing phosphatase and protease inhibitors. Approximately 10–25 µg of protein was separated on polyacrylamide SDS-page gels and then transferred to PVDF membranes, as previously described (13). The following are the primary antibodies used in this study: anti-human HER2 (2165S; Cell Signaling, Danvers, MA, USA), PARP1 (9532S; Cell Signaling, Danvers, MA, USA), PARP2 (ab176330; Abcam, Cambridge, MA, USA), c-Myc (5605S; Cell Signaling, Danvers, MA, USA), and β-actin HRP (sc-47778 HRP; Santa Cruz, Dallas, TX, USA). The secondary antibody used in this study was the rabbit horseradish peroxidase-conjugated (sc-2004; Santa Cruz, Dallas, TX, USA).
Luciferase assay
The PARP1 3’-UTR clone (SC209859, OriGene Technologies, Rockville, MD, USA) or the vector control (PS100062, OriGene Technologies, Rockville, MD, USA) were co-transfected with the let-7a mimic or let-7a antagomiR along with their respective controls. Forty-eight hours after transfection luciferase expression was measured using the britelite™ Plus system (6066769, Perkin Elmer, Waltham, MA, USA) and the TopCount NXT luminescence counter.
RNA extraction and real-time RT-PCR
Total RNA was isolated from cell lines using the PureLink RNA Mini Kit (12183018A; Thermo Fisher Scientific, Waltham, MA, USA) or from FFPE slides using the High Pure FFPET RNA isolation kit (06650775001; Roche Applied Science, Penzberg, Germany). A few RNA samples were cleaned using the Zymo RNA Clean and Concentrator kit (R1015; Zymo Research, Irvine, CA, USA). The mirVana miRNA Isolation kit with phenol (AM1560; Thermo Fisher Scientific, Waltham, MA, USA) was used to extract miRNAs from cell lines.
cDNA was generated using the SuperScript III First-Strand Synthesis System kit (Invitrogen; catalog # 18080-051) or the TaqMan MicroRNA Reverse Transcription Kit (Thermo Fisher Scientific; catalog #4366596). Real-time PCR was done with TaqMan primer probes for PARP1, HER2, hsa-let-7a, and hsa-let-7i. GAPDH or U6 primers were used as the endogenous controls and relative gene expression levels were calculated using the following formulas: 2−ΔΔCt or 2−ΔCt. Expression levels of 800 miRNAs were measured using the Human v3 nCounter miRNA Panel in the 231 NEO and HER2 cell lines, as previously described (13).
Patient samples
The Institutional Review Board at University of Alabama at Birmingham approved all the protocols and procedures used on patient samples, before this study was initiated (IRB #: X101214005). The patient and tumor features of the UAB patients used in this study are thoroughly described in our recent paper (7). Briefly, HER2− patient tissues with low PARP1 levels and HER2+ patient tissues with high PARP1 levels were obtained from the UAB Department of Pathology. Tumor tissues were demarcated by a UAB pathologist and then total RNA was extracted from these tissues. Let-7a gene expression levels were measured via qRT-PCR analysis and calculated using the following formula: 2−ΔCt.
Cell Proliferation
Cell proliferation experiments were used to examine the therapeutic potential of let-7a. Briefly, 1.0×10^5 cells per well were plated in a 6-well plate. Cells were then transfected with the let-7a mimic. Twenty-fours hours after transfection, the cells were harvested and then re-plated in a 24-well plate. The following day, cells were treated with DMSO or 10µM of ABT-888. Following four days of treatment, the cells were removed by trypsin and counted using a cell counter (Beckman Coulter, Fullerton, CA).
Statistical analysis
Our data was analyzed using the one-way Anova followed by a Bonferroni post-test or the two-tailed, student t-test using GraphPad Prism version 4.02 (GraphPad Software). Correlation between let-7a gene expression and PARP1 protein expression levels were assessed using a two-tailed, nonparametric Spearman’s correlation test. Data were considered significant if p<0.05 and presented as average ± standard error of mean (SEM).
Results
PARP1 protein expression positively correlates with HER2 in breast cancer cells
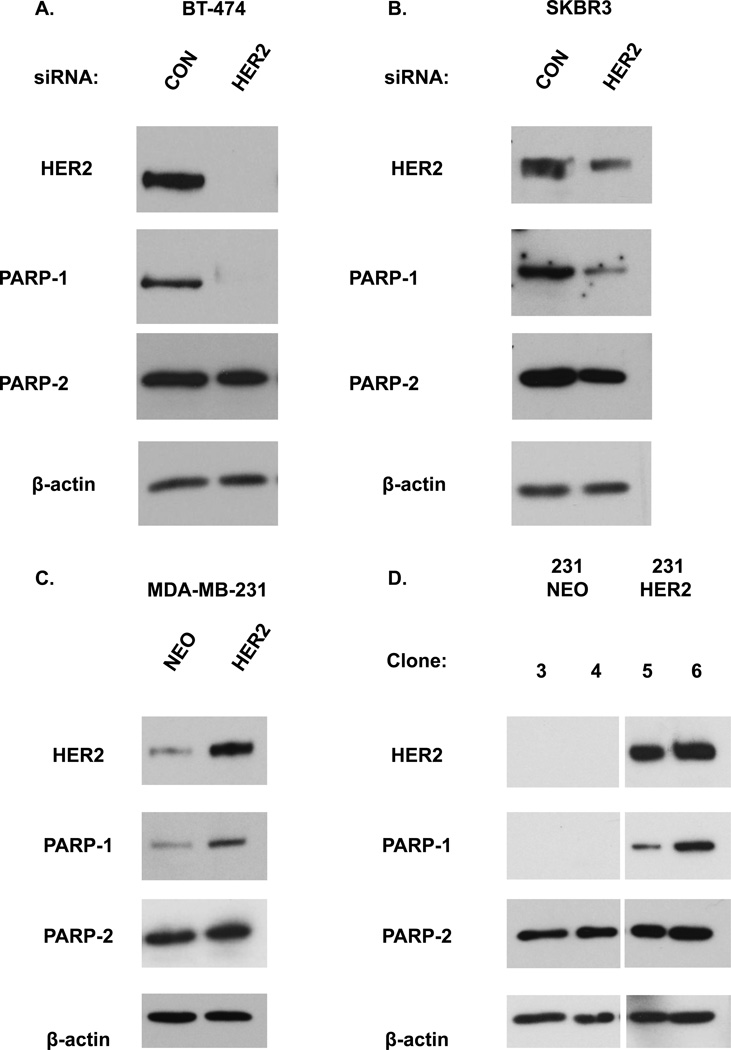
We previously reported a significant correlation between HER2 and PARP1 protein expression in human breast tumor samples (7). To examine the effect of altering HER2 expression on PARP1 protein levels, we silenced HER2 via HER2 siRNA in two HER2 overexpressing breast cells lines, BT-474 and SKBR3. We observed that HER2 knockdown decreased PARP1 protein (Figure 1A–B). We also generated 231 HER2 cells, which are MDA-MB-231 cells (a non-HER2 overexpressing cell line) that overexpress HER2. In contrast to HER2 silencing, transient HER2 overexpression alone resulted in elevated protein levels of PARP1 as compared to cells transfected with the vector alone (Figure 1C). Similar results were also observed after stable HER2 overexpression (Figure 1D). PARP2 levels were not significantly altered after HER2 overexpression or knockdown (Figure 1A–D). All together, these data suggest that HER2 protein levels positively correlate with and may regulate PARP1 levels.
Figure 1. Altering HER2 expression changes PARP1 but not PARP2 protein levels.
(A, B) Cells were transfected with HER2 or control (CON) siRNA for 72 hours and then analyzed by Western blot analysis for HER2, PARP1, and PARP2 protein levels. β-actin was used as a loading control. MDA-MB-231 cells that (C) transiently or (D) stably express the HER2 vector (231 HER2) as compared to cells expressing the control plasmid (231 NEO) were subjected to Western blot analysis for HER2, PARP1, PARP2, and β-actin. Data shown are representative immmunoblots from one of two independent experiments.
Let-7a expression inversely correlates with HER2 status
Previously, we found that PARP1 mRNA expression was increased in HER2+ breast cancer patients from the TCGA PAM-50 breast cancer data set (7). To address whether that HER2 could be regulating PARP1 at the transcriptional level, we suppressed HER2 levels via a HER2 siRNA in the BT-474 and SKBR3 breast cancer cells and then measured PARP1 mRNA levels. We observed that PARP1 mRNA expression was not significantly altered after HER2 knockdown (Supplementary Figure S1).
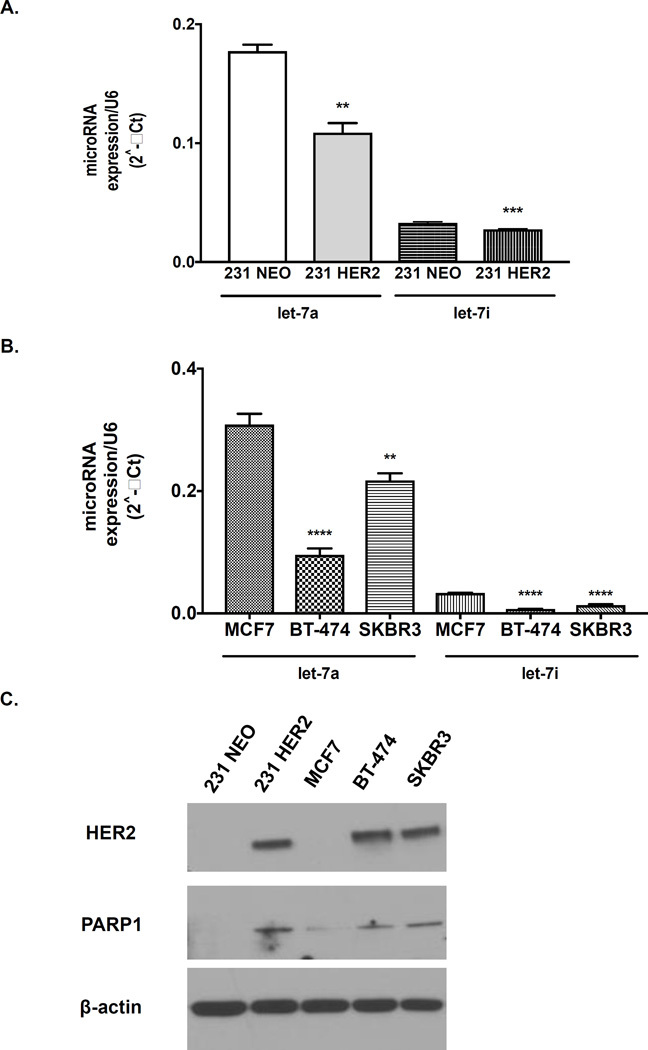
Next, we evaluated whether PARP1 levels were regulated at the post-transcriptional level via a miRNA. To identify miRNAs that are differentially expressed in HER2+ versus HER2− breast cancers, we compared expression levels of 800 miRNAs simultaneously using the NanoString nCounter system in 231 NEO compared to 231 HER2 breast cell lines. We observed that miR-223, which was previously shown to regulate PARP1 levels in esophageal adenocarcinoma, was not significantly altered between these two breast cancer cells (Supplementary Table S1). However, the expression levels of the let-7 family of miRNAs were significantly decreased in the 231 HER2 versus the 231 NEO cells (Table 1). One of the most significantly altered miRNA from this family was let-7a, which was reduced by 2 fold in 231 HER2 compared to its isogenic control 231 NEO (Table 1). These results were also validated via qRT-PCR analysis (Figure 2A). Further, let-7a levels also negatively correlated with HER2 and PARP1 status in human breast cancer cell lines MCF7, BT-474 and SKBR3 (Figure 2B–C).
Table 1.
Expression of the Let-7 miRNA family is altered after HER2 overexpression in breast cancer cells lines.
| MDA-MB-231 | |||
|---|---|---|---|
| NEO | HER2 | Fold Reduction: | |
| let-7a | 15250 | 7402.24 | −2.06 |
| let-7b | 1788.33 | 997.22 | −1.79 |
| let-7c | 59.11 | 32.97 | −1.79 |
| let-7d | 530.39 | 515.65 | −1.03 |
| let-7e | 500.86 | 382.19 | −1.31 |
| let-7f | 94.54 | 61.88 | −1.53 |
| let-7g | 655.6 | 473.39 | −1.38 |
| let-7i | 1529.65 | 730.3 | −2.09 |
Normalized miRNA counts after ectopic HER2 overexpression in the MDA-MB-231 cell line (231 HER2). Fold change values were determined based on respective controls for each cell line.
Figure 2. Let-7a and let-7i levels are inversely correlated with HER2 status in breast cancer cells.
Ten nanograms of isolated miRNA from 70% confluent (A) 231 NEO and 231 HER2 or (B) MCF7, BT-474, and SKBR3 human breast cancer cells were reverse transcribed to cDNA and then analyzed by qRT-PCR for let-7a, let-7i, and U6 expression. The figures are representative from (A, B) one of two independent experiments performed in triplicate. A t-test or one-way ANOVA test was performed. (C) Western blot analysis of HER2, PARP1, PARP2 and β-actin levels in untreated 231 NEO, 231 HER2, MCF7, BT-474, and SKBR3 cell lines. **p<0.01, ***p<0.001 and ****p<0.0001.
Nanostring analysis of miRNAs also revealed differential regulation of let-7i between 231 NEO versus 231 HER2 breast cancer cells. These data were validated via qRT-PCR analysis (Figure 2A). Further, expression levels of let-7i were also significantly decreased in two other HER2+ breast cancer cells versus a HER2− cell line (Figure 2B). However, the HER2+ breast cancer cells expressed much higher levels of let-7a than let-7i, suggesting let-7i may be playing a lesser role in PARP1 regulation (Table 1 and Figures 2A and 2B). Due to these findings, we focused on let-7a in our remaining studies.
Let-7a regulates PARP1 protein
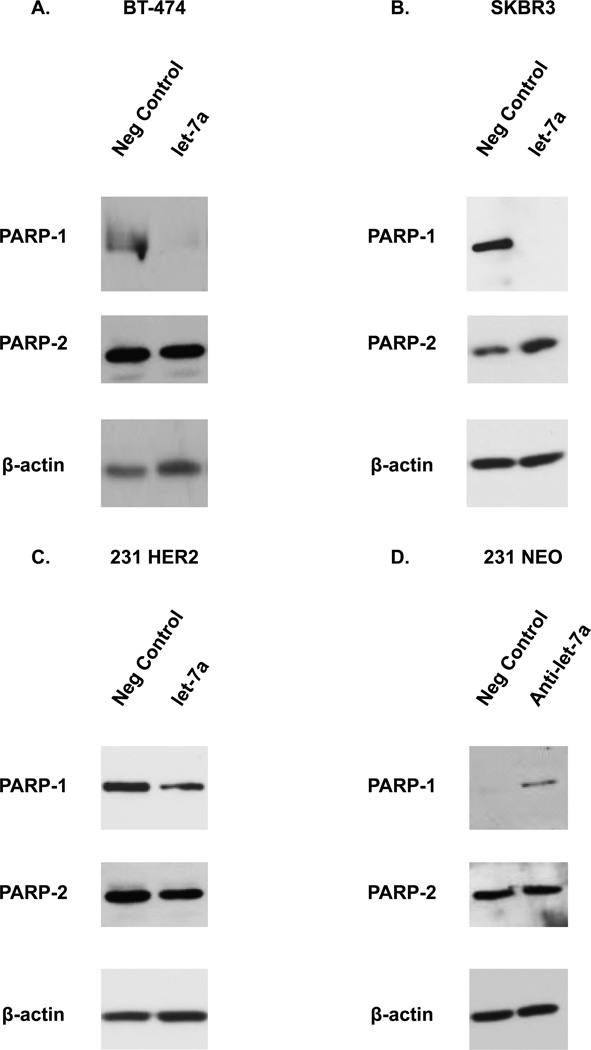
Having observed a difference in expression levels of let-7a between HER2− versus HER2+ breast cancer cell lines, we hypothesized that diminished let-7a may be one mechanism for the elevated PARP1 expression observed in HER2+ breast cancer cells. To test this hypothesis, we first investigated the effects of let-7a on PARP1 protein. As shown in Figure 3A–C, ectopic expression of let-7a reduced the levels of PARP1 protein in all three HER2 overexpressing cell lines as compared to cells treated with the negative control miRNA (neg control). We also validated these results by assessing the effect of the let-7a mimic on the expression of c-myc, a known target of let-7a. Ectopic let-7a expression decreased the protein levels of c-myc in the BT-474 cell line (Supplementary Figure S3A) (14). Conversely, inhibiting the expression of let-7a using an anti-let-7a miRNA in the 231 NEO or MCF7 cell lines increased the levels of the PARP1 protein (Figure 3D and Supplementary Figure S3B). PARP2 levels were not altered in the BT-474, SKBR3, 231 HER2, and 231 NEO cells lines (Figure 3A–D).
Figure 3. Let-7a regulates PARP1 expression in human breast cancer cells.
(A–C) BT-474, SKBR3 and 231 HER2 cells were transiently transfected with a let-7a miRNA (hsa-let-7a-5p) or its neg control miRNA (negative control). Following transfection, cells were analyzed by Western blot analysis for PARP-1, PARP-2, and β-actin. (D) The 231 NEO cell line was transiently transfected with an anti-let-7a miRNA (let-7a antagomiR) or a neg control miRNA (negative control). Following transfection, cells were analyzed by Western blot analysis for PARP-1, PARP-2, and β-actin. Results shown are from one of two independent experiments performed duplicate.
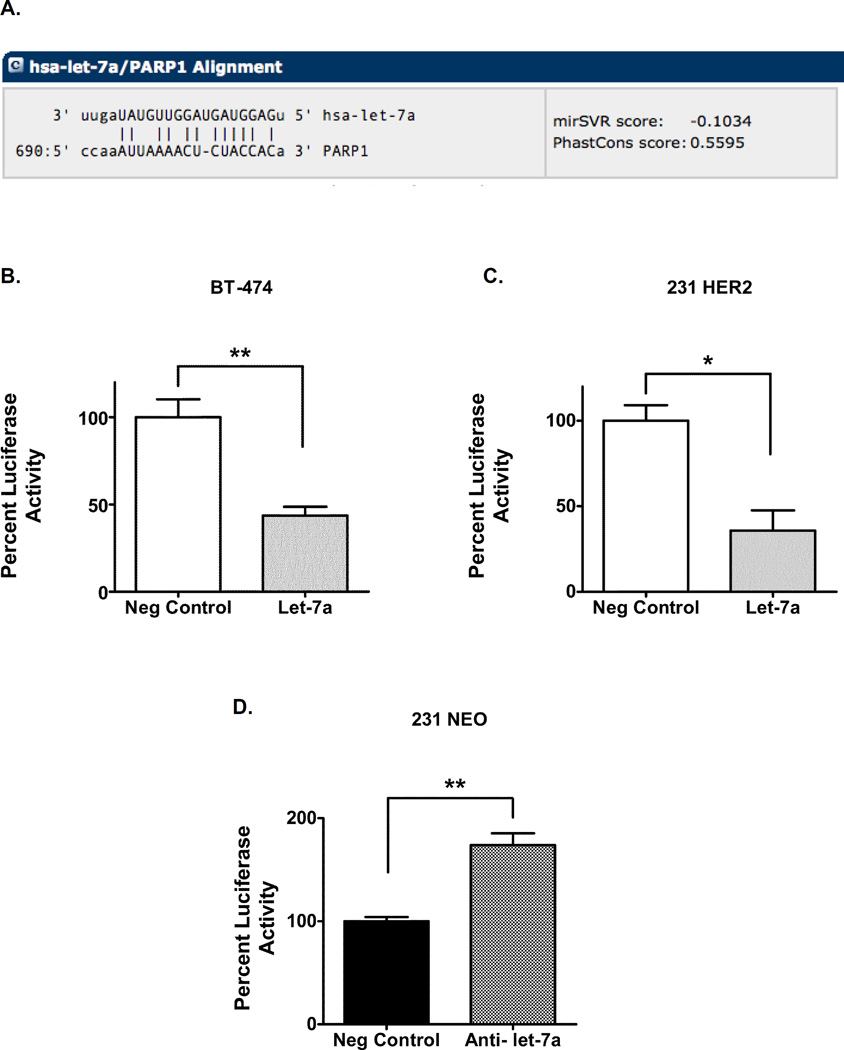
To investigate the direct role of let-7a in regulating PARP1 levels, we assessed the effects of let-7a at the PARP1 3’-UTR. Let-7a had a high predicted binding score to the 3’ UTR of PARP1, according to the microRNA.org database (Figure 4A). To validate direct effects of let-7a on PARP1 3’ UTR, a let-7a mimic was co-transfected with the 3’ UTR of PARP1 downstream of a firefly luciferase gene in HER2 overexpressing cell lines. Following 48 hours of transfection, firefly luciferase activity was decreased in the BT-474 and 231 HER2 cell line transfected with let-7a (Figure 4B–C). In contrast, co-transfection with the anti-let-7a miRNA and 3’UTR of PARP1 in the 231 NEO cells increased luciferase activity (Figure 4D). Together, these data suggest that let-7a directly targets PARP1 in breast cancer cells.
Figure 4. Let-7a targets the PARP1 3’-UTR.
(A) The PARP1 3’UTR was aligned with the seed sequence of the let-7a miRNA. (B, C) BT-474 and 231 HER2 cells were co-transfected with a let-7a miRNA or its neg control miRNA and a plasmid containing a firefly luciferase gene and the 3’UTR of PARP1 or a control 3’UTR. (D) 231 NEO cell line was co-transfected with an anti-let-7a miRNA or its neg control miRNA and a plasmid containing a firefly luciferase gene and the 3’UTR of PARP1 or a control 3’UTR. Luciferase activity was normalized to cells co-transfected with the respective neg control miRNA and the plasmid containing the control 3’UTR. The fold change values were calculated back to the cells co-transfected with the respective neg control miRNA and the plasmid containing the 3’UTR of PARP1. Results shown are from one of two independent experiments performed in quadruplicate. *p<0.05, **p<0.01
Inverse relationship between let-7a and PARP1 levels in breast cancer patients
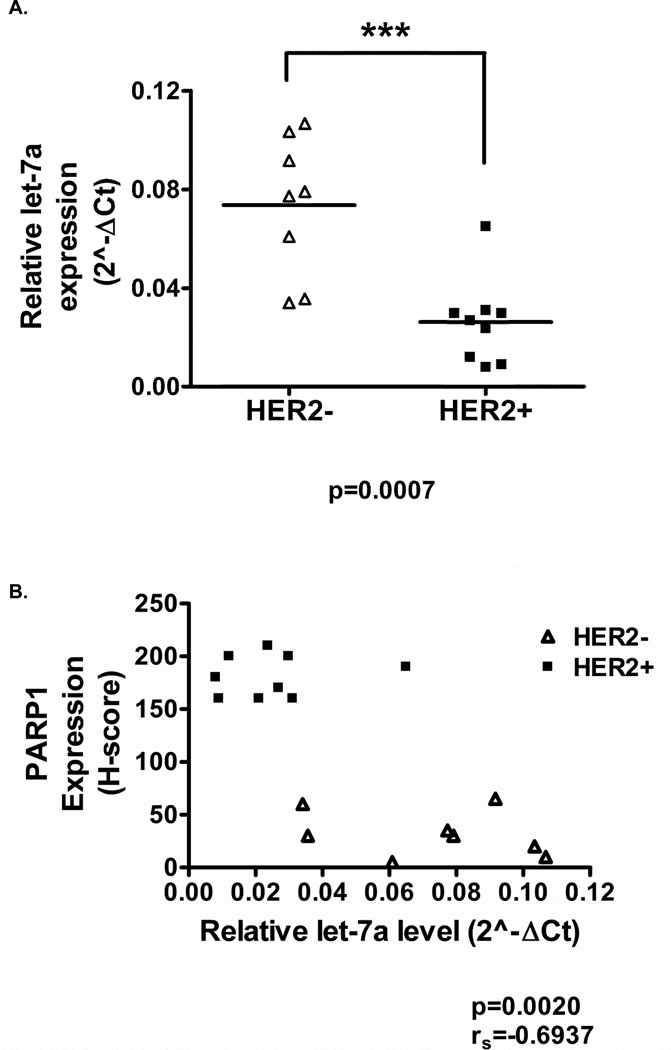
To further validate let-7a as a regulator of PARP1 protein expression, we evaluated let-7a expression in patient breast tumors by qRT-PCR analysis. We observed a significant decrease in let-7a expression in HER2+ breast cancer patients, while higher levels of let-7a were observed in HER2− breast cancer patients (Figure 5A). Moreover, PARP1 expression was elevated in HER2+ patients with low let-7a expression and decreased in HER2− patients with high let-7a expression (Figure 5B). Spearman’s test was used to determine the association between the expression of PARP1 and let-7a expression. As shown in Figure 5B a significant inverse relationship between PARP1 and let-7a expression was observed (rs=−0.6937, p=0.002). Collectively, these results suggest that there is an inverse correlation between let-7a and PARP1 expression in human breast tumor samples.
Figure 5. HER2+ breast cancers express low let-7a levels and high PARP1 levels.
(A) Let-7a levels were measured by qRT-PCR analysis in HER2+ and HER2− breast cancer specimens. U6 was used to normalize data. (B) Let-7a gene and PARP1 protein expression levels were correlated in 17 UAB HER2− and HER2+ breast cancer patients (rs=−0.6937, p=0.0020). ***p<0.001
Let-7a reduces cell viability of HER2+ breast cancer cells
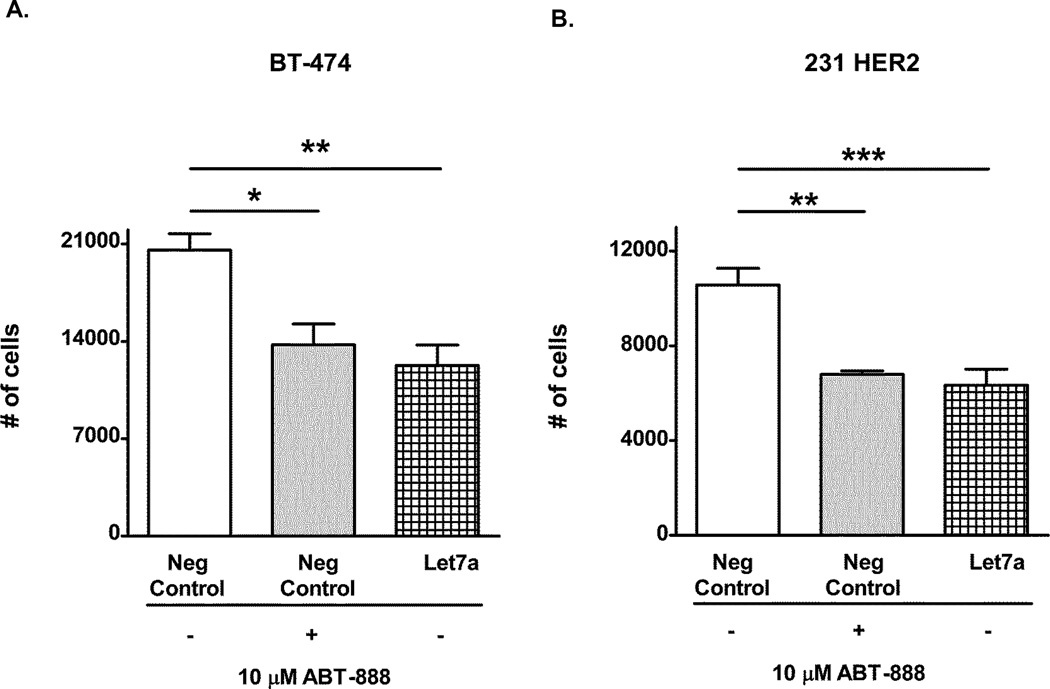
We previously reported that HER2+ breast cancer cells were sensitive to PARP inhibitors (PARPi) or PARP1 siRNA. Because let-7a suppresses PARP1 levels, we next examined whether ectopic let-7a expression could alter cell viability by diminishing PARP1 expression in HER2+ breast cancer cell lines. In both the BT-474 and 231 HER2 cells, transient transfection of let-7a significantly reduced cell proliferation to a similar extent as control transfected cells treated with 10µM of the PARP inhibitor, ABT-888 (Figure 6A–B). These results demonstrate let-7a is as efficacious as ABT-888 at reducing cell proliferation.
Figure 6. Let-7a reduces cell proliferation of HER2+ breast cancers similar to the PARP inhibitor ABT-888.
(A) BT-474 and (B) 231 HER2 cells were transiently transfected with a let-7a miRNA or its negative control. Forty-eight hours after transfection, the cells were treated with DMSO or 10µM ABT-888 for 96 hours and then analyzed by a cellular proliferation assay. Results shown are from one of two independent experiments performed in quadruplicate. *p<0.05, **p<0.01, and ***p<0.001
Next, we investigated whether this decrease in cell viability may be due to mutations in the DNA damage response (DDR) and repair genes. Data collected from the Cancer Cell Line Encyclopedia (CCLE) revealed that both the BT-474 and MDA-MB-231 cell lines had p53 missense mutations. The BT-474 cells also contained a BRCA2 nonsense mutation and an ATM missense mutation while the MDA-MB-231 cell line exhibited no mutations in these two genes as well as other DDR genes (Table 2). However, we previously showed that p53 status did not influence PARPi sensitivity observed in HER2+ breast cancer cells, and BT-474 cells also exhibited ability to form Rad51 foci induced by radiation, suggesting intact HR (6). These findings indicate that these results were likely independent of mutational status of genes involved in DNA damage response (DDR) pathways.
Table 2.
Mutational status of DDR genes as reported by the CCLE (+, wildtype).
| BT-474 | MDA-MB-231 | |
|---|---|---|
| BRCA1 | + | + |
| BRCA2 | nonsense mutation (SNP) | + |
| PALB2 | + | + |
| ATM | missense mutation (SNP) | + |
| ATR | + | + |
| TP53 | missense mutation (SNP) | missense mutation (SNP) |
| NBN | + | + |
| CHEK1 | + | + |
| CHEK2 | + | + |
| BARD1 | + | + |
| CDH1 | + | + |
| PTEN | + | + |
| STK11 | + | + |
Discussion
Multiple studies have recently focused on determining the clinical significance of PARP1 gene and protein expression in breast cancers (5,15). We previously reported that PARP1 protein expression was elevated in HER2+ breast tumors as compared to luminal breast tumors (7). Additionally, Rojo et al. observed that the nuclear PARP1 protein was overexpressed in HER2+ breast cancers and correlated with worse outcomes (16). The purpose of this study was to investigate the mechanism behind elevated PARP1 protein levels in the HER2+ breast cancer subtype, a concept that has been left unexplained in many studies. Here, we demonstrated that HER2 levels positively correlate with PARP1 protein expression through suppression of the let-7a miRNA.
To better understand the mechanism behind PARP1 upregulation, we examined whether PARP1 expression was regulated at either the transcriptional or post-transcriptional level. We observed that HER2 knockdown did not affect PARP1 mRNA levels, suggesting that regulation may not be occurring at the transcriptional level. We previously reported that PARP1 mRNA expression was altered in the 24% of 58 patients with HER2 enriched breast cancer from the TCGA PAM50 data set (7). A possible explanation behind these contradicting results could be due to the cellular heterogeneity observed in patient tumor samples versus the cellular homogeneity created with passaging established cell lines (17). Furthermore, HER2 regulation of PARP1 levels is likely mumultifactorial, which is reflected by the tissue results and not fully tested in our cell line models. We are currently investigating the possible factors that differ between both model systems that could produce the differences in mRNA expression. Nevertheless, alterations observed in PARP1 protein expression were consistent in both our cell lines and human tissues.
Next, due to the emerging role of miRNA in gene regulation and altered expression in cancer cells, we examined whether miRNAs might regulate PARP1 expression. Nanostring miRNA profiling revealed differential regulation of the let-7 family. We focused on one of the let-7 family members, whose expression was significantly lower in HER2+ breast cancer cell lines. We found an inverse correlation between PARP1 and let-7a expression levels in human breast tumor samples. This is consistent with another study where HER2+ breast cancers were found to express low levels of the let-7a miRNA compared to normal breast tissue samples (18). However, we also discovered that let-7a expression from two HER2− and one HER2+ breast cancer patients did not act in accordance with this trend. These results exemplify that breast cancer is a heterogeneous disease and patients within the same subtype can also exhibit differences in molecular expression. The data also emphasize the importance of personalized medicine in the field of breast cancer research. Altogether, our research suggests that specifically HER2+ breast cancer tumors with elevated PARP1 protein and low expression levels of let-7a may benefit from PARPi versus the complete HER2+ subtype of breast cancer.
The mechanism by which HER2 inhibits let-7a remains to be deciphered. One possible mechanism is that Lin28A or Lin28B, repressors of let-7a expression, may be altered in HER2+ breast cancer tumors. Interestingly, one study detected an increase in Lin28A in HER2+ breast tumors and an increase in Lin28B in triple negative breast tumors (18). Another study showed that Lin28B inhibited let-7a gene expression levels and resulted in elevated levels of IL-6 and ultimately STAT3 (19). A second possible mechanism is c-myc transcriptionally represses let-7a levels (20). Our future studies are working to address this mechanism.
Nanostring analysis of miRNA expression also identified other let-7 family members. These let-7 family members also have high binding scores to the 3’UTR of PARP1 (data not shown). Therefore, we cannot exclude these miRNAs as essential factors in the regulation of PARP1 expression.
Importantly, ectopic let-7a expression decreased cell proliferation to the same extent as ABT-888. Recent evidence suggests that PARP trapping is a mechanism of PARPi cytotoxicity (21,22). Because let-7a reduces PARP1 levels, these results suggest that cytotoxicity may be independent of a PARP1 trapping mechanism in HER2+ breast cancer cells but due to alternative functions of PARP1, such as its role in coactivation of transcription factors (6,23). Further, as we have previously shown that BT-474 have intact HR (6), the decrease in cell proliferation after let-7a expression or PARPi is independent of HR functional defects. Importantly, our results highlight the dire need of discovering new biomarkers for PARPI sensitivity other than DDR mutations.
As more PARP inhibitors are being tested in the clinical setting, there seems to be an enhanced interest in the development of new predictive biomarkers for these targeted agents. Ultimately, let-7a or PARP1 could be potential biomarkers for PARPi therapy and should be investigated further in other preclinical and clinical studies. In summary, we are the first group to correlate let-7a and PARP1 expression with HER2 status to ultimately decipher the mechanism behind elevated PARP1 protein expression observed in many studies.
Supplementary Material
Acknowledgments
Eddy Yang has served on the advisory board of NanoString Technologies and has received honorarium from them. He also has a Materials Transfer Agreement with AbbVie, Inc.
We would also like to thank Debbie Della Manna for her help with several experiments.
Grant Support
Eddy Yang was supported by grants from the American Association of Cancer Research/Genentech Career Development Award (12-30-18-YANG) to ESY), Susan G. Komen Career Catalyst Award (CCR12364491, to ESY), Breast Cancer Research Foundation of Alabama, and the Breast SPORE (5P50CA089019) from the University of Alabama-Birmingham Comprehensive Cancer Center.
Footnotes
Disclosure of Potential Conflicts of Interest
The other authors have no conflicts of interest to disclose.
Author’s Contributions
Conception and design: M. Wielgos and E. Yang
Development of methodology: M. Wielgos, S. Nozell, E. Yang
Acquistion of data: M. Wielgos, T. Cooper, and S. Wei
Analysis and interpretation of data: M. Wielgos, T. Cooper, S. Nozell, and E. Yang
Writing review, and/or revision of the manuscript: M. Wielgos, T. Cooper, S. Wei, S. Nozell, and E. Yang
Adminstrative, technical, or material support: R. Rajbhandari, S. Wei, S. Nozell, E. Yang
Study supervision: E. Yang
References
- 1.Kim G, Ison G, McKee AE, Zhang H, Tang S, Gwise T, et al. FDA Approval Summary: Olaparib Monotherapy in Patients with Deleterious Germline BRCA-Mutated Advanced Ovarian Cancer Treated with Three or More Lines of Chemotherapy. Clin Cancer Res. 2015;21(19):4257–4261. doi: 10.1158/1078-0432.CCR-15-0887. [DOI] [PubMed] [Google Scholar]
- 2.Weaver AN, Yang ES. Beyond DNA Repair: Additional Functions of PARP-1 in Cancer. Front Oncol. 2013;3:290. doi: 10.3389/fonc.2013.00290. [DOI] [PMC free article] [PubMed] [Google Scholar]
- 3.Amé JC, Spenlehauer C, de Murcia G. The PARP superfamily. Bioessays. 2004;26(8):882–893. doi: 10.1002/bies.20085. [DOI] [PubMed] [Google Scholar]
- 4.Hassa PO, Hottiger MO. A role of poly (ADP-ribose) polymerase in NF-kappaB transcriptional activation. Biol Chem. 1999;380(7–8):953–959. doi: 10.1515/BC.1999.118. [DOI] [PubMed] [Google Scholar]
- 5.Ossovskaya V, Koo IC, Kaldjian EP, Alvares C, Sherman BM. Upregulation of Poly (ADP-Ribose) Polymerase-1 (PARP1) in Triple-Negative Breast Cancer and Other Primary Human Tumor Types. Genes Cancer. 2010;1(8):812–821. doi: 10.1177/1947601910383418. [DOI] [PMC free article] [PubMed] [Google Scholar]
- 6.Nowsheen S, Cooper T, Bonner JA, LoBuglio AF, Yang ES. HER2 overexpression renders human breast cancers sensitive to PARP inhibition independently of any defect in homologous recombination DNA repair. Cancer Res. 2012;72(18):4796–4806. doi: 10.1158/0008-5472.CAN-12-1287. [DOI] [PMC free article] [PubMed] [Google Scholar]
- 7.Stanley J, Klepczyk L, Keene K, Wei S, Li Y, Forero A, et al. PARP1 and phospho-p65 protein expression is increased in human HER2-positive breast cancers. Breast Cancer Res Treat. 2015;150(3):569–579. doi: 10.1007/s10549-015-3359-6. [DOI] [PMC free article] [PubMed] [Google Scholar]
- 8.Filipowicz W, Bhattacharyya SN, Sonenberg N. Mechanisms of post-transcriptional regulation by microRNAs: are the answers in sight? Nat Rev Genet. 2008;9(2):102–114. doi: 10.1038/nrg2290. [DOI] [PubMed] [Google Scholar]
- 9.Bartel DP. MicroRNAs: genomics, biogenesis, mechanism, and function. Cell. 2004;116(2):281–297. doi: 10.1016/s0092-8674(04)00045-5. [DOI] [PubMed] [Google Scholar]
- 10.Huang TH, Wu F, Loeb GB, Hsu R, Heidersbach A, Brincat A, et al. Up-regulation of miR-21 by HER2/neu signaling promotes cell invasion. J Biol Chem. 2009;284(27):18515–18524. doi: 10.1074/jbc.M109.006676. [DOI] [PMC free article] [PubMed] [Google Scholar]
- 11.Adachi R, Horiuchi S, Sakurazawa Y, Hasegawa T, Sato K, Sakamaki T. ErbB2 down-regulates microRNA-205 in breast cancer. Biochem Biophys Res Commun. 2011;411(4):804–808. doi: 10.1016/j.bbrc.2011.07.033. [DOI] [PubMed] [Google Scholar]
- 12.Streppel MM, Pai S, Campbell NR, Hu C, Yabuuchi S, Canto MI, et al. MicroRNA 223 is upregulated in the multistep progression of Barrett's esophagus and modulates sensitivity to chemotherapy by targeting PARP1. Clin Cancer Res. 2013;19(15):4067–4078. doi: 10.1158/1078-0432.CCR-13-0601. [DOI] [PMC free article] [PubMed] [Google Scholar]
- 13.Weaver AN, Cooper TS, Rodriguez M, Trummell HQ, Bonner JA, Rosenthal EL, et al. DNA double strand break repair defect and sensitivity to poly ADP-ribose polymerase (PARP) inhibition in human papillomavirus 16-positive head and neck squamous cell carcinoma. Oncotarget. 2015 doi: 10.18632/oncotarget.4863. [DOI] [PMC free article] [PubMed] [Google Scholar]
- 14.Sampson VB, Rong NH, Han J, Yang Q, Aris V, Soteropoulos P, et al. MicroRNA let-7a down-regulates MYC and reverts MYC-induced growth in Burkitt lymphoma cells. Cancer Res. 2007;67(20):9762–9770. doi: 10.1158/0008-5472.CAN-07-2462. [DOI] [PubMed] [Google Scholar]
- 15.Green AR, Caracappa D, Benhasouna AA, Alshareeda A, Nolan CC, Macmillan RD, et al. Biological and clinical significance of PARP1 protein expression in breast cancer. Breast Cancer Res Treat. 2015;149(2):353–362. doi: 10.1007/s10549-014-3230-1. [DOI] [PMC free article] [PubMed] [Google Scholar]
- 16.Rojo F, García-Parra J, Zazo S, Tusquets I, Ferrer-Lozano J, Menendez S, et al. Nuclear PARP-1 protein overexpression is associated with poor overall survival in early breast cancer. Ann Oncol. 2012;23(5):1156–1164. doi: 10.1093/annonc/mdr361. [DOI] [PubMed] [Google Scholar]
- 17.Choi SY, Lin D, Gout PW, Collins CC, Xu Y, Wang Y. Lessons from patient-derived xenografts for better in vitro modeling of human cancer. Adv Drug Deliv Rev. 2014;79–80:222–237. doi: 10.1016/j.addr.2014.09.009. [DOI] [PubMed] [Google Scholar]
- 18.Piskounova E, Polytarchou C, Thornton JE, LaPierre RJ, Pothoulakis C, Hagan JP, et al. Lin28A and Lin28B inhibit let-7 microRNA biogenesis by distinct mechanisms. Cell. 2011;147(5):1066–1079. doi: 10.1016/j.cell.2011.10.039. [DOI] [PMC free article] [PubMed] [Google Scholar]
- 19.Iliopoulos D, Hirsch HA, Struhl K. An epigenetic switch involving NF-kappaB, Lin28, Let-7 MicroRNA, and IL6 links inflammation to cell transformation. Cell. 2009;139(4):693–706. doi: 10.1016/j.cell.2009.10.014. [DOI] [PMC free article] [PubMed] [Google Scholar]
- 20.Kawano M, Tanaka K, Itonaga I, Iwasaki T, Tsumura H. c-Myc Represses Tumor-Suppressive microRNAs, let-7a, miR-16 and miR-29b, and Induces Cyclin D2-Mediated Cell Proliferation in Ewing's Sarcoma Cell Line. PLoS One. 2015;10(9):e0138560. doi: 10.1371/journal.pone.0138560. [DOI] [PMC free article] [PubMed] [Google Scholar]
- 21.Hopkins TA, Shi Y, Rodriguez LE, Solomon LR, Donawho CK, DiGiammarino EL, et al. Mechanistic Dissection of PARP1 Trapping and the Impact on In Vivo Tolerability and Efficacy of PARP Inhibitors. Mol Cancer Res. 2015;13(11):1465–1477. doi: 10.1158/1541-7786.MCR-15-0191-T. [DOI] [PubMed] [Google Scholar]
- 22.Ström CE, Johansson F, Uhlén M, Szigyarto CA, Erixon K, Helleday T. Poly (ADP-ribose) polymerase (PARP) is not involved in base excision repair but PARP inhibition traps a single-strand intermediate. Nucleic Acids Res. 2011;39(8):3166–3175. doi: 10.1093/nar/gkq1241. [DOI] [PMC free article] [PubMed] [Google Scholar]
- 23.Schiewer MJ, Goodwin JF, Han S, Brenner JC, Augello MA, Dean JL, et al. Dual roles of PARP-1 promote cancer growth and progression. Cancer Discov. 2012;2(12):1134–1149. doi: 10.1158/2159-8290.CD-12-0120. [DOI] [PMC free article] [PubMed] [Google Scholar]
Associated Data
This section collects any data citations, data availability statements, or supplementary materials included in this article.


