Abstract
PD-L1 is expressed in a percentage of lung cancer patients and those patients show increased likelihood of response to PD-1 axis therapies. However, the methods and assays for assessment of PD-L1 using immunohistochemistry are variable and PD-L1 expression appears to be highly heterogeneous. Here, we examine assay heterogeneity parameters toward the goal of determining variability of sampling and the variability due to pathologist-based reading of the immunohistochemistry slide. SP142, a rabbit monoclonal antibody, was used to detect PD-L1 by both chromogenic immunohistochemistry and quantitative immunofluorescenceusing a laboratory derived test. Five pathologists scored the percentage of PD-L1 positivity in tumor- and stromal immune cells of 35 resected non-small cell lung cancer cases, each represented on three separate blocks. An intraclass correlation coefficient of 94% agreement was seen among the pathologists for assessment of PD-L1 in tumor cells, but only 27% agreement was seen in stromal/immune cell PD-L1 expression. The block-to-block reproducibility of each pathologist’s score was 94% for tumor cells and 75% among stromal/immune cells. Lin’s concordance correlation coefficient between pathologists’ readings and the mean immunofluorescence score among blocks was 94% in tumor and 68% in stroma. Pathologists were highly concordant for PD-L1 tumor scoring, but not for stromal/immune cell scoring. Pathologist scores and immunofluorescence scores were concordant for tumor tissue, but not for stromal/immune cells. PD-L1 expression was similar among all 3 blocks from each tumor, indicating that staining of 1 block is enough to represent the entire tumor and that the spatial distribution of heterogeneity of expression of PD-L1 is within the area represented in a single block. Future studies are needed to determine the minimum representative tumor area for PD-L1 assessment for response to therapy.
Keywords: Non-small cell lung cancer, immune therapy, companion diagnostics, heterogeneity
Introduction
Last year, the Food and Drug Administration approved two second-line monoclonal IgG4 antibodies against PD-1 in advanced stage non-small cell lung cancer (1). Pembrolizumab showed a 45.2% response rate in those patients whose tumors stained over 50% PD-L1 positive and this response was decreased in tumors with a lower ligand expression (2). Similarly patients receiving Nivolumab had greater objective responses and tumor burden reductions for tumors expressing PD-L1, albeit defined by a different cut-point in a different assay (3, 4). Despite these findings, the predictive value of PD-L1 as a biomarker was questioned due to observations of response or benefit in patients with no evidence of PD-L1 expression (5–7). One explanation for this observation could be that the tissue sample that tested negative for PD-L1 might have been from a region distinct from other untested areas of the tumor which were positive (6, 7). Another explanation is that patients may respond to checkpoint inhibitors regardless of their tumors’ PD-L1 expression (8).
Previous work in our laboratory indicated discordance between different assays measuring PD-L1 among areas within similarly-cut sections of the same tumor (9). This difference could be related to tumor heterogeneity or variability of the assay, the antibody, or the assessment. Here we use a single rabbit monoclonal antibody SP142 (Spring Bioscience) and both quantitative immunofluorescence and conventional chromogenic immunohistochemistry to assess the PD-L1 expression in 3 separate blocks from 35 resected NSCLC cases. We evaluated the three-block concordance among readers for diaminobenzidine staining in both tumor- and immune cells and then compared these results with QIF data of serial sections to define intra-block and inter-block heterogeneity in PD-L1 expression.
Materials and Methods
Patient Cohort and Tissue Procurement
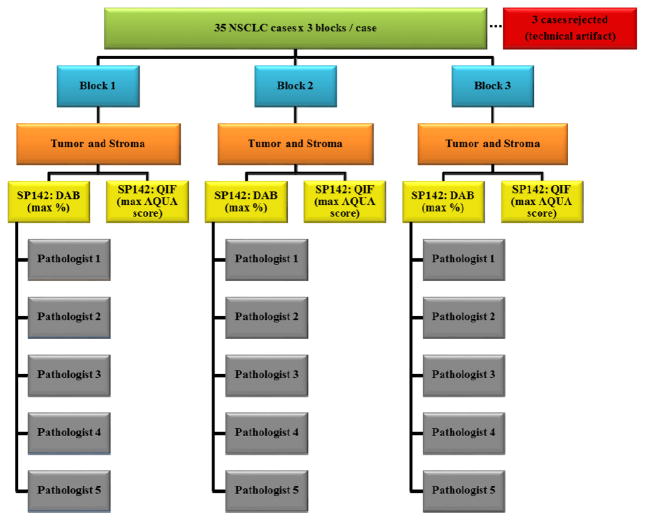
Thirty-five cases of untreated, non-small cell lung cancers resected in 2008–2009 were chosen based on tumor size and histology. The corresponding hematoxylin/eosin-stained slides of all 105 blocks were reviewed by a pathologist to verify the diagnosis and the presence of at least 1 cm2 of tumor on each of 3 blocks. Only those tumors which were of sufficient size to be represented on three independent tissue blocks were selected for inclusion in the study. A consort diagram providing the overall outline of this project is described in figure 1. About half of the cases were squamous cell carcinoma and the other half were adenocarcinoma. All tissue was collected under the conditions of the Yale Human Investigation committee protocols (#9505008219 or #2003025173) to Dr. Rimm stipulating signed consent or waiver of consent from all patients. The clinical characteristics of this cohort are in table 1.
Figure 1. Consort Diagram.
This study included resections of 35 non-small cell lung cancer tumors. Three quantitative immunofluorescence cases were rejected due to the technical artifact of antibody trapping.
Table 1.
| Characteristic | Number of Patients | Percentage of Patients |
|---|---|---|
|
| ||
| All Patients | 35 | 100% |
|
| ||
| Age at Diagnosis | ||
| <70 | 14 | 40% |
| ≥70 | 21 | 60% |
|
| ||
| Sex | ||
| Male | 15 | 43% |
| Female | 20 | 57% |
|
| ||
| Histology | ||
| Adenocarcinoma | 17 | 49% |
| Squamous cell | 18 | 51% |
|
| ||
| Stage | ||
| I | 15 | 43% |
| II | 14 | 40% |
| III-IV | 6 | 17% |
|
| ||
| Tumor size, centimeters | ||
| <2 | 5 | 14% |
| 2–5 | 27 | 77% |
| >5 | 3 | 9% |
|
| ||
| Lymph node status | ||
| Negative | 20 | 57% |
| Positive | 13 | 37% |
| N/A | 2 | 6% |
PD-L1 Antibody Validation
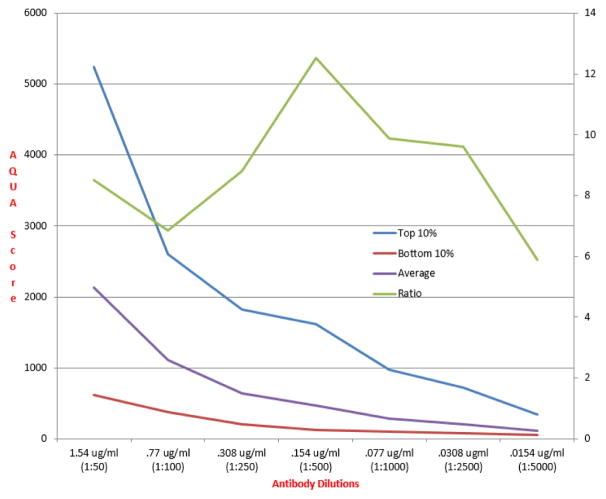
SP142 (Spring Bioscience, Cat #: M4420), a rabbit monoclonal antibody clone of PD-L1, was used to stain whole-tissue sections of each of the 105 formalin-fixed paraffin-embedded blocks. Customized index tissue microarrays (YTMA 245 and 295) containing representative lung cases with variable PD-L1 expression were utilized for antibody titration and validation. Positive- and negative control spots on these tissue microarrays included previously validated lung cases which contained a range of PD-L1 expression. Control samples and reproducibility data are shown in supplemental figures 1 and 2. The antibody concentration needed to generate the optimal signal to noise was quantitatively determined on serial cuts of the index tissue microarrays by testing across two logs of antibody concentrations from 1:50 (1.54 ug/ml) to 1:5000 (0.0154 ug/ml). The use of 0.154 ug/ml (1:500 dilution) of SP142 for overnight incubation at 4°C resulted in the highest signal-to-noise ratio of PD-L1 expression (figure 2).
Figure 2. Illustration of quantitative assessment of optimal titration.
Quantitative assessment of optimal antibody titer is achieved by plotting the average of the top 10% of scores on the test tissue microarray (blue line) and the average of the bottom 10% of the scores (red line) for each antibody concentration tested (X axis). The optimal titration is the maximal signal to noise (shown on the right side Y axis) plotted (orange line) to show a peak at 0.154ug/ml.
Fluorescent and Chromogenic immunohistochemistry staining
Whole-tissue sections with respective internal control tissue microarray slides were deparaffinized overnight at 60°C in a standard laboratory convection oven followed by placement in xylenes twice (20 minutes each), followed by 100% ethanol twice (1 minute each), then 70% ethanol (1 minute), and finally a streaming tap water rinse (5 minutes). Tris-EDTA antigen retrieval buffer was prepared using 1.48g of EDTA (J.T. Baker, Cat #8993-01) dissolved in 4L of deionized water, and using 1M sodium hydroxide dropwise to bring the solution to pH 8. The slides and buffer were then placed in a PT Module (Lab Vision), which heated the buffer to 97°C for 10 minutes. Afterwards, the slides were rinsed under a stream of tap water for 10 minutes before being placed in a methanol/hydrogen peroxide solution (0.75% hydrogen peroxide in methanol) for 30 minutes. After gently shaking all slides in double distilled water for 5 minutes, the samples were transferred to an autostainer (Thermo Scientific/Lab Vision) and blocked for 30 minutes at room temperature with 0.3% bovine serum albumin/tris-buffered saline and tween.
For quantitative immunofluorescence, primary antibody and cytokeratin cocktail, SP142 [0.154 ug/ml (1:500)] and mouse monoclonal anti-human cytokeratin antibody (1:100) (Dako, Cat #: M3515, clone AE1/AE3) were diluted in 0.3% bovine serum albumin/tris-buffered saline and tween. This cocktail was then applied to all slides which were incubated overnight at 4°C. The secondary antibody cocktail was prepared with a goat anti-mouse antibody, Alexa Fluor 546 (Life Technologies, Cat #: A11003), which was diluted 1:100 in an anti-rabbit horse radish peroxidase-labelled polymer reagent (Dako, Cat #: K4003), and applied to all slides for 1 hour at room temperature. Cyanine 5 Tyramide reagent (Perkin Elmer, Cat #: FP1117) was then diluted 1:50 in an amplification diluent (Perkin Elmer, Cat #: 1050) and then added to the batch slides for 10 minutes. All slides were coverslipped using ProLong Gold reagent with 4′,6-diamidino-2-phenylindole (Life Technologies, Cat #: P36931) for nuclear staining.
The serial cuts of whole-tissue sections and control tissue microarrays used for quantitative immunofluorescence were then used for chromogenic immunohistochemistry. This primary antibody cocktail contained only SP142 [0.154 ug/ml (1:500)] diluted in 0.3% bovine serum albumin/tris-buffered saline and tween. After an overnight incubation at 4°C, the slides were transferred to the in-house autostainer and only incubated with the anti-rabbit horse radish peroxidase-labelled polymer reagent for 1 hour at room temperature, then incubated for 7 minutes at room temperature with diaminobenzidine chromogen (Dako, Cat #: K3468) diluted 1:50 in diaminobenzidine substrate buffer, then counterstained with hematoxylin (Dako, Cat #: S3301). This was followed with dehydration washes and coverslipping.
Scoring and Measurement of Fluorescence
The fluorophores 4′,6-diamidino-2-phenylindole and Cyanine 5 Tyramide were used during staining in order to visualize antibody target intensities in user-designated compartments within the tissue, such as tumor and stroma as previously described using the AQUA™ (Genoptix, Inc.) method of quantitative immunofluorescence. Immunofluorescence scores are a reflection of PD-L1 antibody signal in either tumor or stromal compartments, and are calculated by dividing the PD-L1 compartment pixel intensities by the area within the respective compartment (10). Scores were normalized to the exposure time and bit depth at which the images were captured, allowing scores collected at different exposure times to be comparable.
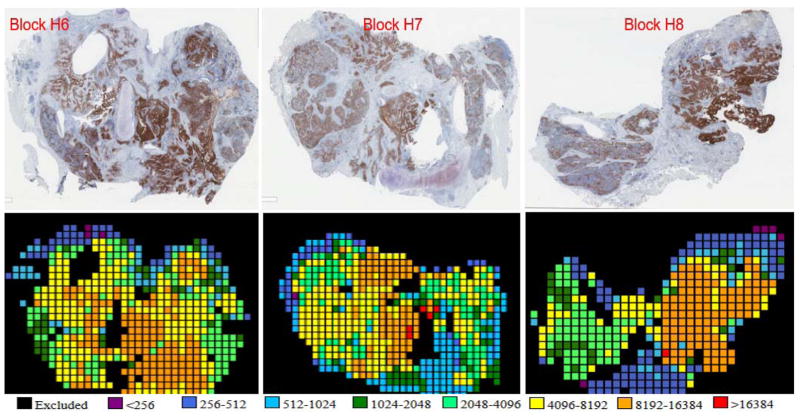
Whole slide tissue sections may represent 30–800 fields of view, where each field of view is about 0.5 mm2. Due to the time for reading each field of view on current devices, it is impractical to read them all. To determine the number of fields of view that need to be measured to represent the entire section, a pilot study was performed that included all fields of view on all 3 blocks of 6 cases representing 18 whole tissue sections. A model was constructed to define the number of fields of view required in order to achieve a 95% likelihood that the average and max scores in the collected sample represented the average and max scores on the whole slide. Calculations showed that 29–70 fields of view, selected randomly and depending on the total number of fields of view, would be sufficient for a 95% chance of concordance between the sampled fields of view and the whole slide. To be sure we did not miss hot spots, rather than random selection, we subjectively selected fields from a low-resolution scan from the brightest to least bright even if the signal was dim and likely to represent noise. Subsequently, 29–70 fields of view were selected as dictated by the model based on the total number of fields of view on each slide. Once all fields of view were captured using a high-resolution scan, those areas with <2% tumor, normal lung tissue, and technical artifacts (damaged tissue, bubbles, or trapped antibody signal) were excluded from the analysis. Of 35 cases in the cohort used for this experiment, the quantitative immunofluorescence data from 3 cases required exclusion due to non-specific trapping of antibody or other quality control issues preventing accurate scoring. Figure 3 shows an example of PD-L1 staining of whole tissue sections for 3 blocks from the same case. The serially-cut sections were stained using quantitative immunofluorescence and chromogenic immunohistochemistry (diaminobenzidine) and a heat map of the quantitative immunofluorescence scores is shown below the diaminobenzidine images.
Figure 3. Images and Heatmaps.
Whole tissue sections cut from 3 separate blocks from the same case. The top 3 panels indicate PD-L1 diaminobenzidine staining among all 3 blocks. The bottom 3 panels show PD-L1 quantitative immunofluorescence staining of serial sections of corresponding blocks. The heatmaps are based on quantitative immunofluorescence data, which generated a quantitative immunofluorescence score as an arbitrary unit of fluorescence for each field of view within the tumor. The quantitative immunofluorescence score scale is presented below the heatmaps.
Scoring of Chromogenic immunohistochemistry
Five pathologists (DEC, BEW, KAS, VP, and DLR) scored all whole-tissue sections by indicating the percentage of predominantly membranous PD-L1 staining of tumor cells and stromal or immune cells with perceptible PD-L1 signal at any intensity. The readers were not instructed to utilize certain percentage ranges or designations used in clinical trials or other studies (2–4, 8, 9, 11–13); rather, each pathologist recorded his/her reading based on a single, numerical, raw staining percentage of cells expressing PD-L1 at any intensity. All 35 cases were adequately stained and passed quality control testing.
Statistical Analysis
The intraclass correlation coefficient applied to chromogenic immunohistochemistry data to evaluate the correlation between pathologists and blocks. The concordance between pathologists was evaluated using their readings of PD-L1 staining percentage in tumor and stroma. The heterogeneity between blocks was evaluated for each pathologist separately and also pooled into a single score.
The intraclass correlation coefficient was also used to assess PD-L1 heterogeneity as measured using quantitative immunofluorescence. For each case, both mean and maximum immunofluorescence score values in tumor and stroma of all 3 blocks were assessed. A mixed-effects model implementing “analysis of variance” was used to quantify percentage of variance in the field of view values between and within blocks while adjusting random effects from the samples. The concordance between quantitative immunofluorescence data using immunofluorescence scores and chromogenic immunohistochemistry data using pathologists’ maximum readings of PD-L1 staining percentages was then assessed using the Lin’s concordance correlation coefficient and linear regression. P-values were determined for tumor and stroma as a means of evaluating significant differences between blocks. Ultimately, block heterogeneity in this analysis was excluded by taking only the highest mean block immunofluorescence score-, highest maximum block immunofluorescence score-, and highest percentage staining from each pathologist among all 3 blocks per case. Statistical analyses were performed using Statistical Analysis System software, or SAS, version 9.4 (SAS Inc.) and GraphPad Prism v6.0 (GraphPad Software, Inc.).
Results
Pathologist Concordance
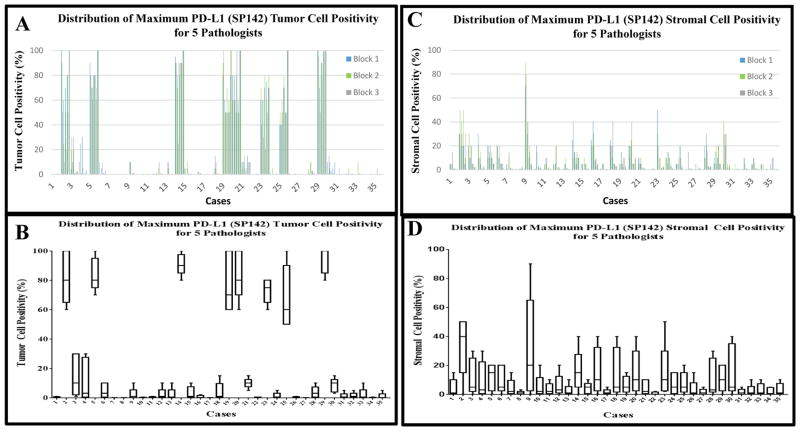
Five pathologists interpreted the diaminobenzidine staining of SP142 among 3 blocks of 35 cases. Staining percentages were recorded for tumor and stroma sections per block in raw whole number percentages from 0–100%. Tumor cells and immune cells exhibiting predominantly membranous staining were considered “positive.” Figure 4A shows the distribution of the scores from each pathologist on each of the 3 blocks from each case. Overall, good concordance is evident both between blocks from the same cases and between pathologists. Figure 4B shows the box and whisker plot distributions for the maximum score (of the 3 blocks) for all 5 pathologists illustrating the overall variance between pathologists for each case. Based on these semi-quantitative readings from pathologists, the intraclass correlation coefficient was calculated between pathologists and between blocks for each case. The intraclass correlation coefficient between pathologists for tumor PD-L1 expression showed excellent concordance at 94% using the single maximum percentage per pathologist in all 3 blocks per case (Table 2A). Figure 4B illustrates a generally bimodal distribution of PD-L1 expression where 8 of the cases are “high” PD-L1 expressers (all reads showing >50% staining) compared to the remainder of cases showing low or negative expression (all reads <25%).
Figure 4. Distribution of Maximum PD-L1 score among 5 Pathologists.
A) A histogram of all chromogenic immunohistochemistry data for tumor: the raw percentage of staining assigned by each of the 5 pathologists for each of the 3 blocks, per case (15 bars per case, color coded by block as shown in the inset). B) the distribution of the single maximum score provided by each of the 5 pathologists among all 3 blocks per case from tumor regions (5 data points per case). Each boxplot represents 25th%-, median-, and 75th% readings, with the whiskers denoting minimum and maximum percentages of these 5 data points. The y-axis labels the maximum reading among the 3 blocks. C) shows a histogram of all chromogenic immunohistochemistry data for stroma: the raw percentage of staining assigned by each of the 5 pathologists for each of the 3 blocks, per case (15 bars per case, color coded by block as shown in the inset). D) the distribution of the single maximum score provided by each of the 5 pathologists among all 3 blocks per case from stromal regions (5 data points per case). Each boxplot represents 25th%-, median-, and 75th% readings, with the whiskers denoting minimum and maximum percentages of these 5 data points. The y-axis labels the maximum reading among the 3 blocks.
Table 2a–d.
PD-L1 Heterogeneity summary
| Table 2a. Chromogenic Immunohistochemistry (diaminobenzidine): Programmed Death-Ligand 1 Heterogeneity among Pathologists and Blocks | ||
|---|---|---|
| Intraclass Correlation Coefficient among Pathologists | Intraclass Correlation Coefficient among Blocks | |
| Tumor | 94% | 94% |
| Stroma | 27% | 75% |
| Table 2b. Quantitative Immunofluorescence: Programmed Death-Ligand 1 Heterogeneity among Blocks | ||
|---|---|---|
| Intraclass Correlation Coefficient among blocks (Mean quantitative immunofluorescence score per block) | Intraclass Correlation Coefficient among blocks (Maximum quantitative immunofluorescence score per block) | |
| Tumor | 95% | 88% |
| Stroma | 88% | 79% |
| Table 2c. Quantitative Immunofluorescence: Variance of Fields of View among 3 blocks and within a block | ||
|---|---|---|
| Variance of fields of view among 3 blocks | Variance of fields of view within a block | |
| Tumor | 9% | 91% |
| Stroma | 4% | 96% |
| Table 2d. Chromogenic Immunohistochemistry (diaminobenzidine) vs. Quantitative Immunofluorescence: Concordance in Tumor and Stroma | ||
|---|---|---|
| 5 Pathologists vs. Highest Mean Quantitative Immunofluorescence score (among all 3 blocks) | 5 Pathologists vs. Single Maximum Quantitative Immunofluorescence score (among all 3 blocks) | |
| Tumor | 94% | 92% |
| Stroma | 68% | 70% |
The reading of the stromal scores were much less concordant. Figure 4C shows the distribution of the stromal scores illustrating the broad variation both between pathologists, and to a lesser extent between blocks. Figure 4D shows the high levels of variance and the absence of biomodality seen for the tumor cell scoring. The intraclass correlation coefficient among each pathologist’s single maximum percentage score for stromal immune cell staining was 27%, indicating substantial discordance (Table 2A).
Heterogeneity between tissue blocks
To estimate the heterogeneity of expression of PD-L1 in both the tumor cells and the stromal cells, the intraclass correlation coefficient was calculated between blocks for each pathologist. On average, pathologists scored tumor sections of all 3 blocks per case quite similarly (intraclass correlation coefficient = 94%), but their stromal sections shared a less substantial correlation (intraclass correlation coefficient = 75%) (Table 2A).
Quantitative measurement of tumor and stromal PD-L1 expression
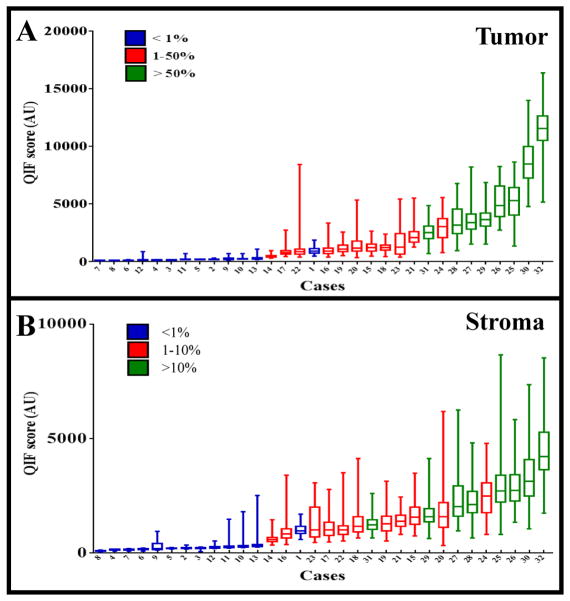
Unlike the pathologists’ estimate of percentage of cells positive at any intensity, the automated quantitative immunofluorescence method combines both the area of expression with the intensity of staining to generate a score that is more similar to a concentration than a percentage. Figure 5 shows the immunofluorescence score range for all fields of view from all three blocks for each case, plotted from low to high then color coded for the average of all pathologists’ scores for each case. The generally continuous nature of the distribution is illustrated as is the general agreement with pathologist scores. Calculation of the block to block heterogeneity for tumor cell expression of PD-L1 showed an intraclass correlation coefficient of 95% using an immunofluorescence score that represents the mean score from all fields of view from each block. The intraclass correlation coefficient between blocks for average stromal scores was 88%. Intraclass correlation coefficients for the maximum immunofluorescence score of all fields of view for tumor and stromal PD-L1was 88% and 79% respectively (Table 2B).
Figure 5. Quantitative Immunofluorescence vs. Chromogenic Immunohistochemistry.
The quantitative immunofluorescence score is shown as a box and whisker plot for representative fields of view from each case. Each box represents the 25th%-, median-, and 75th% quantitative immunofluorescence score of the respective case. Whiskers represent the minimum and maximum score. The X-axis indicates all cases organized by their median quantitative immunofluorescence score values. Cases are also color coded by their PD-L1 diaminobenzidine staining percentages: those in blue stained <1%, those in red stained 1–50%, and those in green stained >50%. A) the scores for the PD-L1 expression in the tumor. B) the scores for the PD-L1 expression in the stroma.
Quantification allows for assessment of heterogeneity of PD-L1expression using a linear mixed-effects regression model both between blocks for a given case and between fields of view on a given slide. Using measurements from all of the fields of view measured, we found that the variance between blocks is quite small (9% for tumor and 4% for stroma), compared to the variance between fields of view on a single slide (91% for tumor and 96% for stroma, Table 2C).
Finally, the quantitative information can be compared with the reads by the pathologist. The Lin’s concordance correlation coefficient and linear regression were used to assess the concordance between the scoring by pathologists and quantitative immunofluorescence data from serial sections. Pathologists’ single maximum percentage score among all 3 blocks was compared with the single maximum immunofluorescence score among all 3 blocks and the largest mean immunofluorescence score among all 3 blocks. After standardizing these variables and averaging all 5 pathologists’ concordance with the highest mean immunofluorescence score among all 3 blocks, there was a 94% concordance in tumor- and 68% concordance in stromal regions of the blocks. Calculating the same concordance using the maximum immunofluorescence score among all 3 blocks (rather than the mean immunofluorescence score) revealed a 92% concordance among pathologists’ scoring in tumor and a 70% concordance in stroma. Table 2D summarizes these findings.
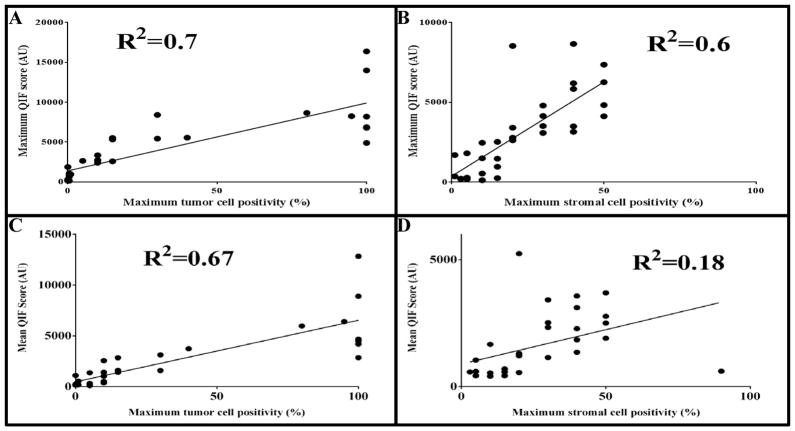
Regression analysis was also used to compare pathologist scores with quantitative measurements. Figures 6A and 6B are regression analyses between the single maximum immunofluorescence scores per case and the highest percentage of PD-L1 staining score by any pathologist, per case. Consistent with the interpretation of the Lin’s concordance correlation coefficient values, the r-squared was greater in tumor (r2 = 0.7) than in stroma (r2 = 0.6). Figures 6C and 6D are regression analyses between the highest mean immunofluorescence score of any block, with the highest percentage of PD-L1 staining score by any pathologist, per case. This data indicated that not only was the r-squared greater in tumor regions (r2 = 0.67) than in stroma (r2 = 0.18), but that the maximum immunofluorescence score among all 3 blocks is more correlated to pathologists’ maximum reading than is the highest mean immunofluorescence score among all 3 blocks.
Figure 6. Regressions of Maximum and Mean quantitative immunofluorescence score vs. Maximum Pathologists’ Score.
The maximum percentage PD-L1 staining among all pathologists was regressed with the maximum quantitative immunofluorescence score among all 3 blocks, in both A) tumor and B) stromal regions. Also, the maximum percentage PD-L1 staining among all pathologists was regressed with the highest average quantitative immunofluorescence score of a block among 3 blocks, in both C) tumor and D) stromal regions.
Discussion
Perhaps the most significant and promising finding in this work is that when pathologists score tumor cell percentages they are highly concordant. This may be important since the first few PD-1 axis drugs that have been, or are about to be approved, use different cut-points. Similarly, the high concordance between different blocks from the same case suggests that a single block may be representative of the larger tumor. However, more concerning is the lack of concordance in estimation of stromal or immune cell scores. This may be due to the relatively low levels of immune cell expression and the challenge of concordance when estimating low frequency events.
Although our cohort is small, the observations in this work are generally concordant with that previously described with respect to the distribution of expression in the total population. For example, Garon et al. (2) characterized the prevalence of PD-L1 expressers in their patient population showing that 23.2% of patients’ tumors stained >50%, 37.6% stained 1–50%, and 39.2% staining <1%. Our analysis of 35 patients revealed similar results showing that 25% of patients’ tumors stained >50%, 34% stained 1–50%, and 41% stained <1%.
Stromal measurements among pathologists resulted in an intraclass correlation coefficient of 27%, indicating prominent discordance (Table 2A). When comparing pathologists’ stromal score with quantitative immunofluorescence data, there was a 68% concordance with using the highest mean immunofluorescence score and 70% concordance with using the maximum immunofluorescence score among all 3 blocks per case. Thus, not only are pathologists relatively discordant in their abilities to score stromal immune cell PD-L1 expression, but they are less concordant with quantitative methods than their readings for tumor samples. These findings raise questions about the ability of pathologists to score stromal immune cells concordantly and accurately, in light of studies using Atezolizumab (MPDL3280A) with SP142 to explore the relationship between PD-L1 expression on immune cells and response to the drug (5, 11, 14, 15). This may be due to the lack of consensus on the exact method for reading stromal cells or it may be a function of the inherent challenge of scoring of scarce events.
A second key finding of this work is the quantitative assessment of heterogeneity of expression of PD-L1. The mixed effects model suggests that well over 90% of the heterogeneity that we see is presented in a single slide and that the variance between different regions of the tumor (different blocks) is not substantial. Specifically, variance of fields of view between each of 3 blocks was only 9% for tumor and 4% for stroma, in stark contrast to the variance between fields of view within a given block being 91% in tumor and 96% in stroma. Coupled with pathologists’ interpretation of diaminobenzidine staining, these results indicated that PD-L1 expression is heterogeneous within fields of view of the same whole-tissue section (at the millimeter level), rather than from block-to-block (at the centimeter level). This lack of inter-block heterogeneity indicates that a single block is representative of PD-L1 expression of the entire tumor. However, the minimal representative area on a block required to predict response to therapy remains to be determined.
Although the results of our data are encouraging, there are several limitations to our study. First, patient outcome data including their treatment and time to progression were not collected for this comparative study. This study would be much more valuable if we had the criterion standard of response to immune therapy for every case, but since the drugs are only recently released, this is not possible. The second major limitation is the relatively small sample size. However, future larger studies are in process and even with this sample size, some very compelling conclusions could be drawn. Third, no statistical method has been found to quantify the concordance between diaminobenzidine and quantitative immunofluorescence data using all field of view values. The use of current single maximum or highest of means in the 3 blocks of field of view values takes into account only part of the quantitative immunofluorescence information. Extensions of Lin’s concordance correlation coefficient to handle multivariate data will lead to improved interpretation of the concordance between pathologists’ percentage scores and immunofluorescence scores. Finally, this study only used one commercially-available antibody and the method was not that prescribed in the investigational use only studies. As such, this study provides no information related to the concordance of the Food and Drug Administration’s approved or submitted PD-L1 assays that do, or will populate the drug labels.
In summary, with the Food and Drug Administration’s approval of 3 monoclonal antibodies that target the PD-1 axis in lung cancer, high response rates and impressive duration in selected populations suggest that a companion diagnostic assay is inevitable for this class of therapy. Here we show some key characteristics related to the companion diagnostic test, including 1) pathologist are more concordant in scoring tumor than immune cells or stromal cells; 2) pathologists are concordant with quantitative measurement for tumor cells PD-L1 but less so for immune cell PD-L1, and 3) the heterogeneity seen in PD-L1 expression is represented within the block, rather than between blocks, as shown by assessment of variance. These data suggest that pathologists can characterize PD-L1 expression in tumor using the conventional immunohistochemistry test. Future studies may be done to compare tests or compare the efficacy of this test with other methods of prediction of response to PD-1 axis therapies.
Supplementary Material
Acknowledgments
This work was supported by the Yale SPORE in Lung Cancer P50CA196530, the Yale Cancer Center Support Grant, P30CA016359, the Breast Cancer Research Foundation and a Sponsored Research Agreement from Genoptix.
References
- 1.Teixido C, Karachaliou N, Gonzalez-Cao M, Morales-Espinosa D, Rosell R. Assays for predicting and monitoring responses to lung cancer immunotherapy. Cancer Biol Med. 2015;12:87–95. doi: 10.7497/j.issn.2095-3941.2015.0019. [DOI] [PMC free article] [PubMed] [Google Scholar]
- 2.Garon EB, Rizvi NA, Hui R, Leighl N, Balmanoukian AS, Eder JP, et al. Pembrolizumab for the treatment of non-small cell lung cancer. N Engl J Med. 2015;372:2018–28. doi: 10.1056/NEJMoa1501824. [DOI] [PubMed] [Google Scholar]
- 3.Borghaei H, Paz-Ares L, Horn L, Spigel DR, Steins M, Ready NE, et al. Nivolumab versus Docetaxel in Advanced Nonsquamous Non-Small-Cell Lung Cancer. N Engl J Med. 2015;373:1627–39. doi: 10.1056/NEJMoa1507643. [DOI] [PMC free article] [PubMed] [Google Scholar]
- 4.Rizvi NA, Mazieres J, Planchard D, Stinchcombe TE, Dy GK, Antonia SJ, et al. Activity and safety of nivolumab, an anti-programmed death-protein 1 immune checkpoint inhibitor, for patients with advanced, refractory squamous non-small-cell lung cancer (CheckMate 063): a phase 2, single-arm trial. Lancet Oncol. 2015;16:257–65. doi: 10.1016/S1470-2045(15)70054-9. [DOI] [PMC free article] [PubMed] [Google Scholar]
- 5.Kerr KM, Tsao MS, Nicholson AG, Yatabe Y, Wistuba II, Hirsch FR, et al. Programmed Death-Ligand 1 Immunohistochemistry in Lung Cancer: In what state is this art? J Thorac Oncol. 2015;10:985–9. doi: 10.1097/JTO.0000000000000526. [DOI] [PubMed] [Google Scholar]
- 6.Mansfield AS, Murphy SJ, Peikert T, Yi ES, Vasmatzis G, Wigle DA, et al. Heterogeneity of programmed cell death-ligand 1 expression in multifocal lung cancer. Clin Cancer Res. 2015 doi: 10.1158/1078-0432.CCR-15-2246. [DOI] [PMC free article] [PubMed] [Google Scholar]
- 7.Sheng J, Fang W, Yu J, Chen N, Zhan J, Ma Y, et al. Expression of programmed death ligand-1 on tumor cells varies pre and post chemotherapy in non-small cell lung cancer. Sci Rep. 2016;6:20090. doi: 10.1038/srep20090. [DOI] [PMC free article] [PubMed] [Google Scholar]
- 8.Brahmer J, Reckamp KL, Baas P, Crino L, Eberhardt WE, Poddubskaya E, et al. Nivolumab versus Docetaxel in Advanced Squamous-Cell Non-Small-Cell Lung Cancer. N Engl J Med. 2015;373:123–35. doi: 10.1056/NEJMoa1504627. [DOI] [PMC free article] [PubMed] [Google Scholar]
- 9.McLaughlin J, Han G, Schalper KA, Carvajal-Hausdorf D, Pelekanou V, Rehman J, et al. Quantitative Assessment of the Heterogeneity of programmed death-ligand 1 Expression in Non-Small-Cell Lung Cancer. JAMA Oncol. 2016;2:46–54. doi: 10.1001/jamaoncol.2015.3638. [DOI] [PMC free article] [PubMed] [Google Scholar]
- 10.Camp RL, Chung GG, Rimm DL. Automated subcellular localization and quantification of protein expression in tissue microarrays. Nat Med. 2002;8:1323–7. doi: 10.1038/nm791. [DOI] [PubMed] [Google Scholar]
- 11.Herbst RS, Soria JC, Kowanetz M, Fine GD, Hamid O, Gordon MS, et al. Predictive correlates of response to the anti-programmed death-ligand 1 antibody MPDL3280A in cancer patients. Nature. 2014;515:563–7. doi: 10.1038/nature14011. [DOI] [PMC free article] [PubMed] [Google Scholar]
- 12.Paz-Ares L, Horn L, Borghaei H, Spigel DR, Steins M, Ready N, et al. Phase III, randomized trial (CheckMate 057) of nivolumab (NIVO) versus docetaxel (DOC) in advanced non-squamous cell (non-SQ) non-small cell lung cancer (non-small cell lung cancer) American Society of Clinical Oncology (ASCO) Meeting Abstracts. 2015;33:LBA109. [Google Scholar]
- 13.Rizvi NA, Brahmer JR, Ou S-HI, Segal NH, Khleif S, Hwu W-J, et al. Safety and clinical activity of MEDI4736, an anti-programmed cell death-ligand 1 (programmed death-ligand 1) antibody, in patients with non-small cell lung cancer (non-small cell lung cancer) American Society of Clinical Oncology (ASCO) Meeting Abstracts. 2015;33:8032. [Google Scholar]
- 14.Galon J, Pages F, Marincola FM, Thurin M, Trinchieri G, Fox BA, et al. The immune score as a new possible approach for the classification of cancer. J Transl Med. 2012;10:1. doi: 10.1186/1479-5876-10-1. [DOI] [PMC free article] [PubMed] [Google Scholar]
- 15.Spira AIPK, Mazieres J, Vansteenkiste JF, Rittmeyer A, Ballinger M, Waterkamp D, Kowanetz M, Mokatrin A, Fehrenbacher L. Efficacy, safety and predictive biomarker results from a randomized phase II study comparing MPDL3280A vs docetaxel in 2L/3L non-small cell lung cancer (POPLAR). J Clin Oncol; American Society of Clinical Oncology (ASCO); Chicago, IL. 2015. [Google Scholar]
Associated Data
This section collects any data citations, data availability statements, or supplementary materials included in this article.


