Abstract
Purpose
It has been demonstrated that Doppler waveform of the hepatic vein (normally triphasic) is transformed into a biphasic or monophasic waveform in cirrhotic patients. The compressive mechanism of liver tissue has been considered up till now the cause of this change. Moreover, cirrhotics show, after USCA injection, a much earlier HVTT due to intrahepatic shunts. Our aim was to prospectively evaluate the correlation between Doppler pattern of hepatic vein and HVTT of a second-generation USCA; we also correlated HVTT with the most common indexes of portal hypertension.
Methods
We enrolled 38 participants: 33 cirrhotics and 5 healthy controls. Doppler shift signals were obtained from the right hepatic vein. To characterize the hepatic vein pattern, we used the hepatic vein waveform index (HVWI). This index becomes >1 with the appearance of the triphasic waveform. We recorded a clip from 20 s before to 2 min after a peripheral intravenous bolus injection of 2.4 ml of USCA (sulfur hexafluoride).The time employed by USCA to cross the liver from the hepatic artery and portal vein to the hepatic vein was defined as HA-HVTT and PV-HVTT, respectively.
Results
Cirrhotics with low HVWI showed an earlier transit time; participants with higher HVWI had a longer transit time (p < 0.001). HVTT was earlier as MELD, Child–Pugh score and spleen diameter increased. Patients with ascites and varices of large size had significantly shorter transit times.
Conclusions
Abnormal hepatic vein Doppler waveform in cirrhotic patients could be due to intrahepatic shunts. HVTT could be useful in the non-invasive evaluation of portal hypertension.
Keywords: Portal hypertension, Cirrhosis, Hepatic vein waveform, Hepatic vein transit times, Ultrasound contrast agent, Non-invasive procedure
Sommario
Obiettivo
E’ stato dimostrato che il pattern flussimetrico delle vene epatiche (normalmente trifasico) si trasforma in un pattern bifasico o monofasico nei pazienti cirrotici. La causa di questa alterazione è stata considerata fino ad ora la presenza di meccanismi di compressione generati dal tessuto epatico. Inoltre i pazienti cirrotici presentano dopo somministrazione di mezzo di contrasto un tempo di transito precoce per presenza di shunts intraepatici. Il nostro obiettivo è stato di valutare in maniera prospettica il pattern flussimetrico delle vene epatiche e il tempo di transito di un mezzo di contrasto ecografico di II generazione; abbiamo inoltre correlato il tempo di transito con i più comuni indici di ipertensione portale.
Metodo
Sono stati arruolati 38 pazienti: 33 cirrotici e 5 controlli sani. Il segnale Doppler è stato ottenuto dalla vena epatica di dx. Per meglio caratterizzare il pattern flussimetrico della vena epatica abbia utilizzato un indice dell’onda epatica chiamato HVWI. Tale indice diventa maggiore di 1 in presenza di un’onda trifasica. E’ stato registrato un clip 20 s prima e 2 min dopo la somministrazione di un bolo di 2.4 mL di mdc ecografico (esafluoruro di zolfo). Il tempo impiegato dal mdc per attraversare il fegato dall’arteria epatica e dalla vena porta alla vena epatica sono stati denominati HA-HVTT e PV-HVTT.
Risultati
I cirrotici con basso HVWI hanno mostrato un tempo di transito precoce; i partecipanti con elevato HVWI un tempo di transito più prolungato (p < 0.001). HVTT è risultato tanto piu’ precoce nei pazienti con aumentato MELD, Child–Pugh score e diametro splenico. I pazienti con ascite e varici di grandi dimensioni hanno mostrato tempi di transito brevi. Conclusioni l’alterazione del patternflussimetrico delle vene epatiche nei cirrotici potrebbe essere dovuto alla presenza di shunts intraepatici. HVTT potrebbe essere utile nella valutazione non invasiva dell’ipertensione portale.
Introduction
It has been demonstrated that the Doppler pattern of hepatic vein (HV) has a triphasic waveform in healthy subjects. It consists of two hepatofugal phases related to atrial and ventricular diastole and a short phase of retrograde (hepatopetal) flow caused by the pressure increase in the right atrium during atrial systole [1–3].
In cirrhotic patients, the presence of abnormal biphasic or monophasic waveform can be observed [4–9]. Moreover, a monophasic waveform has been shown to correlate with a high Child–Pugh score and a poor survival rate. A positive correlation has been found between the extent of abnormalities in hepatic vein waveforms and the increase in hepatic vein pressure gradient (HVPG) [10].
Up till now reduced compliance of liver tissue has been considered the main cause of this change [2].
During the last two decades, ultrasound contrast agents (USCAs) have been developed and increasingly used in clinical practice. Second-generation USCAs are now currently employed in liver disease for the characterization of benign liver tumors and primary malignant liver tumors and for detection of liver metastases [11–15]. Bolus injection of microbubble agents can also be used for kinetic studies of the microbubble first pass and thus to assess transit times [16]. In these studies, USCAs were used to demonstrate that the transit time to the liver was shorter in cirrhosis. Patients with cirrhosis showed a much earlier onset of enhancement in hepatic vein [16–19]. This earlier HV arrival time of contrast agent is due to intrahepatic rather than extrahepatic hemodynamic changes [18].
We postulated that the presence of intrahepatic shunts in cirrhosis would result not only in a decreased USCA transit time in the liver, but also in the characteristic transfiguration of HV Doppler waveform. Then, the primary aim of this study was to prospectively evaluate the correlation between Doppler pattern of HV and HV transit time (HVTT) of a second-generation USCA (SonoVue®, Bracco, Milan, Italy). The secondary aim was to assess whether quantitative analysis of HVTT after an intravenous bolus injection of USCA can be used in the assessment of the severity of portal hypertension.
Materials and methods
The ethics committee at the Catholic University of Rome approved all the components of our study; patients and control subjects provided written informed consent.
The inclusion criteria for patients in the study were biopsy-proven cirrhosis or evidence of one or more ultrasound (US) findings of liver cirrhosis (irregular edges, coarse or coarse-nodular liver US pattern, caudate to right lobe transverse diameter lower than 0.62) associated with endoscopic and/or ultrasound signs of portal hypertension (esophageal varices, gastric varices, severe hypertensive gastropathy, ascites, increased spleen size, detection of porto-systemic shunts), age >18 years and ability to express informed consent. Patients were excluded if they had hepatocellular carcinoma, liver metastasis, thrombosis of the inferior vena cava, hepatic or portal vein, contraindications to USCA (myocardial infarction, respiratory failure, pulmonary hypertension, heart failure, severe heart rhythm disorders, recent changes in electrocardiogram, right to left heart shunts), pregnancy and lactation. Thirty-eight participants were enrolled: 5 normal volunteers (3 men, 2 women, mean age 43 ± 12.71) with no history or clinical signs of liver disease; 33 cirrhotic patients (23 men, 10 women, mean age 56.69 ± 11.41, BMI 26.49 ± 2.99, 7 with biopsy proven cirrhosis) with different etiologies of liver disease (virus-related hepatitis C 16 cases, 12 alcoholic cases, 7 cases virus-related hepatitis B, 2 cases HIV-related hepatitis, 1 case primary biliary cirrhosis, 1 case Wilson disease, 1 case cryptogenic cirrhosis). Fourteen patients were classified as Child–Pugh [20] class A, 10 as class B and 9 as class C at the time of the study. The mean MELD score [21] in these patients was 12.79 ± 5.92. Eighteen patients had esophageal varices (classified as F1 in 10 cases and as F2 in 8 cases; classification according to Beppu [22]), 2 patients had gastric varices and 5 severe hypertensive gastropathy. Nine participants had ascites. Thirteen patients had recanalization of the paraumbilical vein. None of the participants was treated with vasoactive drugs until the completion of the study.
All participants underwent a preliminary conventional diagnostic US evaluation (B-mode and color Doppler) of the upper abdomen before the study using a 3.5–5.0 convex probe (US-equipment: Technos, Esaote, Genova, Italy).
The Doppler study of the hepatic vein was performed in the morning after an overnight fast. All hepatic vein waveform studies were performed by the same experienced sonographer (L.S.). Hepatic vein Doppler waveforms were classified as triphasic, biphasic and monophasic as previously described [9] after three consecutive measurements. The right hepatic vein was chosen for scanning wherever possible; in one patient we used the middle hepatic vein because the flow signal from the right hepatic vein was poor and trace non-diagnostic. Doppler shift signals were obtained in the right hepatic vein at a distance of 3–6 cm from the junction with the inferior vena cava, using an intercostal scan. Waveforms of the hepatic vein were recorded for at least 5 s with end-expiration breath holding.
After completion of the study, all tracings were blindly evaluated by an operator (G.V.) who was unaware of the patient’s clinical status and the HVWI (hepatic vein waveform index) was calculated as (maximum velocity − minimum velocity)/maximum velocity [23]. This index which is equal to 0 in case of a flat curve increases with increasing pulsatility of the waveform and will be >1 with the appearance of a retrograde flow phase.
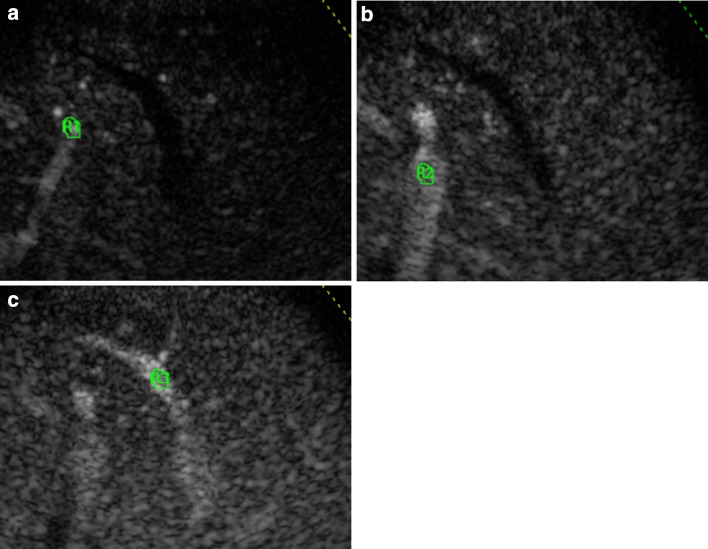
The microbubble contrast agent used was SonoVue® (Bracco, Milan, Italy), which consists of tiny bubbles of sulfur hexafluoride (SF6). A 2.4 mL of contrast agent (concentration 8 µL/mL) was injected manually at 2 mL/s via a 21 G or larger cannula in an antecubital fossa vein. The injection was followed immediately by a 20 mL normal saline flush at 2 mL/s. We recorded a clip from 20 s before to 2 min after the peripheral intravenous bolus injection. Transit time analysis was performed and analysed by a quantification software package. We traced the region of interest (ROI) on a branch of hepatic artery, portal and hepatic vein, simultaneously scanned using an intercostal section. Intensity curve analysis was performed with a previously described method [24] that we modified. A region alignment to the three vessels was obtained for all frames of the recorded clip: frame by frame, ROI were positioned perfectly inside the vessels, to minimize the effect due to parenchymal intensity (Fig. 1).
Fig. 1.
Regions of interest (ROI) are traced on a branch of the hepatic artery (a), portal (b) and hepatic vein (c), simultaneously scanned using an intercostal section. A region alignment to the three vessels was obtained for all frames of the recorded clip: frame by frame, ROIs were positioned perfectly inside the vessels, to minimize the effect due to parenchymal intensity
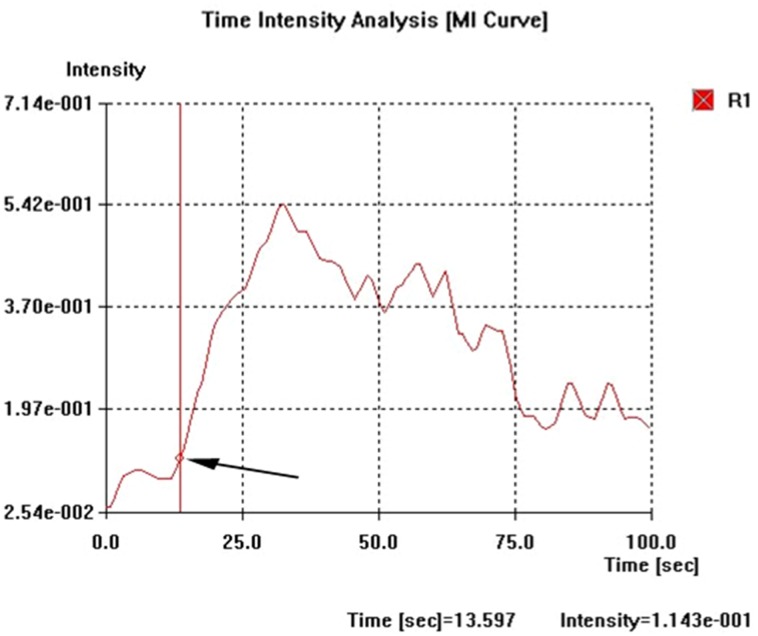
The time intensity curves (filtered from the raw data) were analysed for four indices. First, the arrival time (AT) in the three vessels was defined as the interval from the time of injection and the point of the curve with a signal intensity that exceeds the baseline intensity by 10% and followed by a clear further rise (Fig. 2). Second, the time to peak (TP) in HV was defined as the time interval from the beginning of the injection to the peak of the filtered curve. Third, the intensity to the peak (IP) was measured as the difference in intensity from the peak to the baseline in HV. Fourth, the slope of the curve in HV was defined as (TP − AT)/(IP − baseline intensity).
Fig. 2.
The time intensity curves (filtered from the raw data) were constructed on a branch of the hepatic artery, and portal and hepatic vein. Arrival time (AT, arrow) in the three vessels was defined as the interval from the time of injection to the point of the curve with a signal intensity that exceeded the baseline intensity by 10%
The time employed by USCA to cross the liver from the hepatic artery and portal vein to the hepatic vein was defined as HA-HVTT and PV-HVTT.
We compared the results of the six indices for three groups of participants (normal volunteers, cirrhotic with HVWI >1 and cirrhotic with HVWI <1) using the non-parametric test ANOVA. A conventional p value <0.05 was considered statistically significant. The degree of association between the hepatic transit times and the most common indexes of portal hypertension was assessed by a regression model. Calculation was performed with the Med Calc statistical software (© 1993-2011Meld Calc software bvba, version 11.5.1, Belgium).
Results
In the cirrhotic group, ultrasonography showed typical features of cirrhosis. The evaluation of three repeated hepatic vein waveform measurements demonstrated concordance in classifying the subtype as triphasic, biphasic or monophasic in 100% of the cases. Diagnostic time intensity curves with a clearly detectable start and peak were obtained for 33 (86.84%) of the 38 participants. Mean values and standard deviation for the arrival time in the three vessels (arterial, portal and hepatic veins) and their relative transit times were calculated (Table 1).
Table 1.
Mean (SD)
| Normal controls [5] | Cirrhotics with HVWI > 1 [7] | Cirrhotics with HVWI <1 [14] | p* | p † | |
|---|---|---|---|---|---|
| HV waveforms (tri/bi/monophasic) | 5/-/- | 7/-/- | 0/12/2 | ||
| HA arrival time | 16.78 (±4.22) | 16.03 (±4.81) | 15.51 (±6.00) | 0.844 | 0.669 |
| PV arrival time | 20.73 (±5.80) | 19.36 (±5.71) | 18.68 (±7.23) | 0.831 | 0.578 |
| HV arrival time | 26.14 (±4.00) | 25.03 (±6.79) | 19.89 (±7.53) | 0.145 | 0.098 |
| HA-HVTT | 9.36 (±0.72) | 8.43 (±2.54) | 4.38 (±2.33) | 0.002 | <0.001 |
| PV-HVTT | 5.42 (±2.43) | 5.66 (±2.01) | 1.22 (±0.97) | <0.001 | <0.001 |
* Comparison between cirrhotics with HVWI >1 and cirrhotics with HVWI <1. † Comparison between cirrhotics with HVWI <1 and normal controls. No significant differences were found between normal controls and cirrhotics with HVWI >1 for any variable (p > 0.1)
All cirrhotics with HVWI >1 and normal volunteers showed a triphasic waveform in HV; 18 patients with cirrhosis and HVWI <1 showed a biphasic waveform and the remaining 3 a flat waveform.
Normal volunteers and cirrhotics with HVWI >1 showed very similar transit times (p > 0.1).
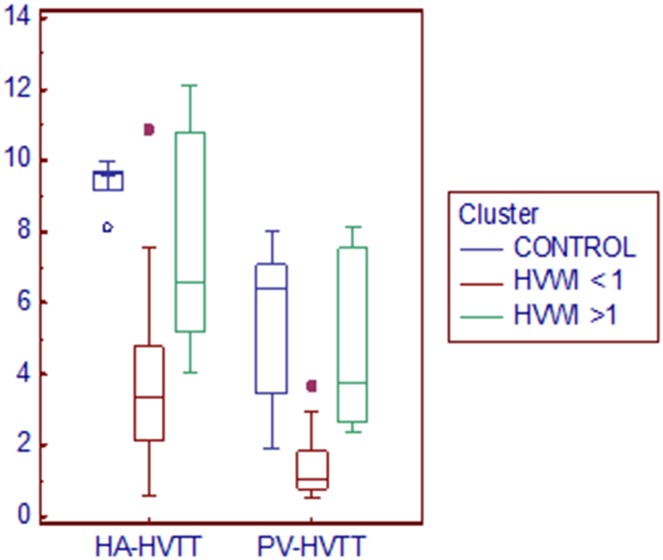
Conversely, cirrhotics with HVWI <1 showed a much earlier transit time with an average of 3.69 ± 2.57 s (for HA-HVTT) and 1.42 ± 0.90 s (for PV-HVTT) and these times were significantly different from those of both the other groups (p < 0.01).
ANOVA (one-way analysis of variance) showed significant differences between the three groups for HA-HVTT and PV-HVTT variables (p < 0.001, Levene’s test for equality of variances, p = 0.044 for HA-HVTT and p < 0.001 for PV-HVTT), as expected (Fig. 3). Substantial overlap for the arrival times in hepatic artery and portal vein between the three groups of participants was found.
Fig. 3.
Clustered multiple variables (HA-HVTT and PVHVTT) graph. Box-and-Whisker plots of the two variables for three clusters. The middle line represents the median. A line extends from the minimum to the maximum value, excluding “outside” and “far out” values which are displayed as separate points. Normal volunteers and cirrhotics with HVWI >1 showed very similar transit times
As shown in Fig. 3, two of the ‘far out’ participants belonged to the group of cirrhotics with HVWI <1. In these patients, the transit times were longer than the average, and ultrasonography demonstrated patent umbilical vein with high mean velocity to Doppler evaluation.
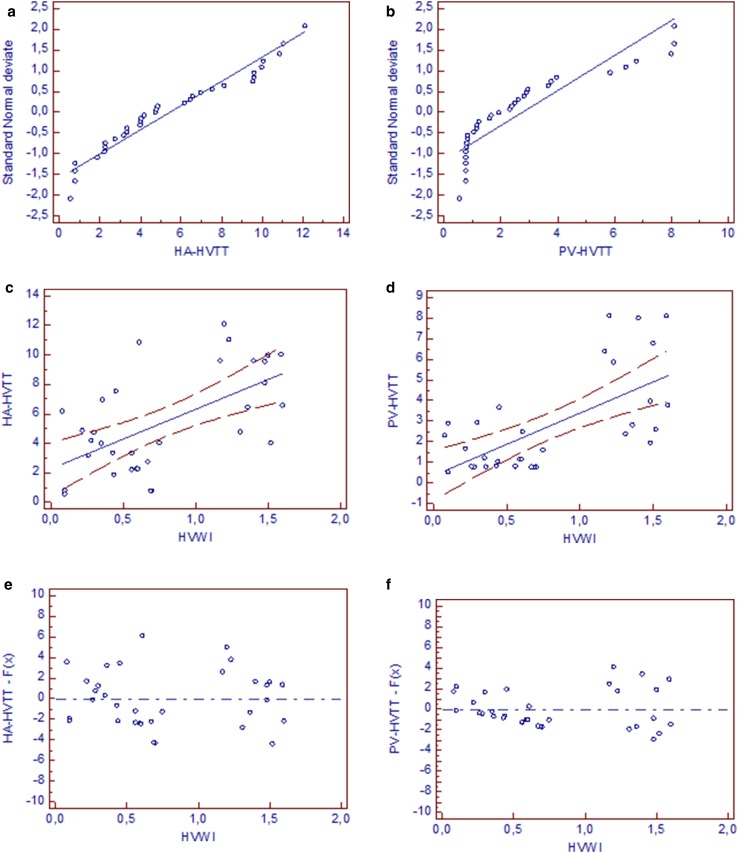
A polarization of the distribution for HVWI variable was noted (Fig. 4c, d). The cutoff value of 1 for HVWI significantly (p < 0.001) divided transit times into two clusters.
Fig. 4.
a, b Distribution plot for transit times. A straight reference line represents the normal distribution. HA-HVTT and PV-HVTT data points were near this straight line. Kolmogorov–Smirnov test for normal distribution accepted normality (HA-HVTT p = 0.4874, PV-HVTT p = 0.1536). c, d Scatter diagram and regression line for HVTT and HVWI. A positive correlation was found between HVTT measured and HVWI (for HA-HVTT r 2 = 0.3597, p < 0.001, regression equation y = 2.2572 + 4.0403x; for PV-HVTT r 2 = 0.4207, p < 0.001, regression equation y = 0.3676 + 3.0253x): 95% confidence interval is visualized by two curves drawn parallel to the regression line (0.4153–4.0990 for HA-HVTT, -0.8452–1.5805 for PV-HVTT); e, f Residual standard deviation: residual plot allows the visual evaluation of the goodness of fit of the regression model applied to the transit times (for HA-HVTT r.s.d. 2.7922; for PV-HVTT r.s.d. 1.8386). Residuals are the differences between the predicted values and the observed values
A positive correlation was found between the HVTT measured and HVWI (Fig. 4).
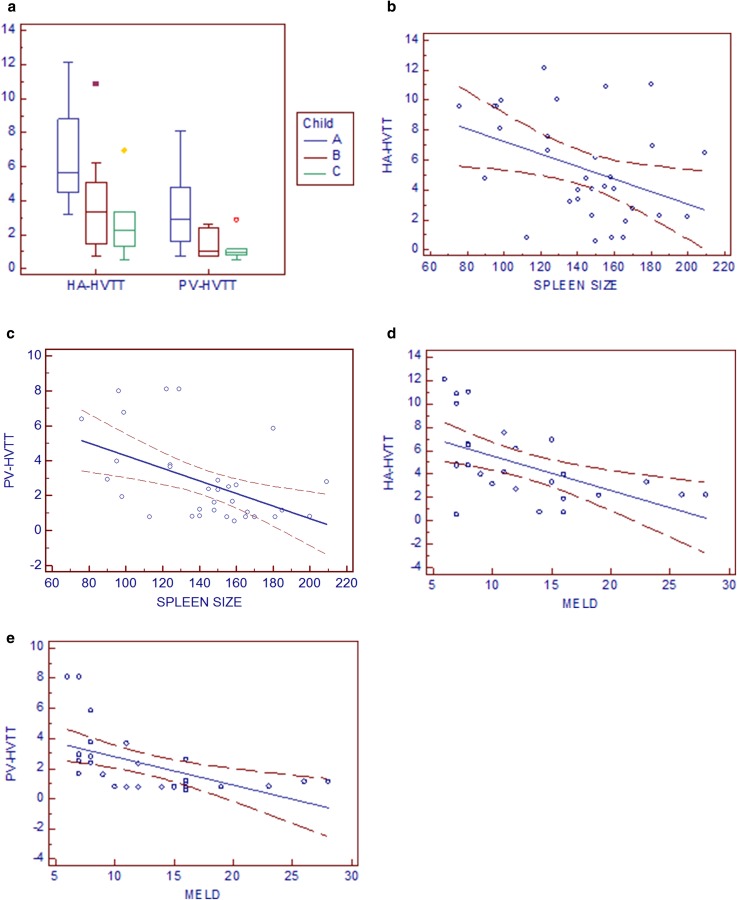
HVTT was earlier when MELD, Child–Pugh score and spleen diameter increased.
The mean HA-HVTT and PV-HVTT of patients with cirrhosis were significantly related to their Child–Pugh class (Fig. 5a).
Fig. 5.
a The mean transit times of patients with cirrhosis were related to their Child–Pugh class. HA-HVTT and PV-HVTT values that are significantly different (p = 0.014 and p = 0.012) are indicated. b, c A negative correlation was found between the measured HVTT and spleen size (for HA-HVTT r 2 = 0.155, p = 0.023, regression equation y = 11.4137 – 0.04193x; for PV-HVTT r 2 = 0.2412, p = 0.004, regression equation y = 7.9112 – 0.03622x). d, e A negative correlation was found between transit times and MELD score (for HA-HVTT r 2 = 0.2891, p = 0.003, regression equation y = 8.4987 − 0.2947x; for PV-HVTT r 2 = 0.2929, p = 0.003, regression equation y = 4.6823 – 0.1888x)
Furthermore, a negative correlation was found between HVTT measured and spleen size and between transit times and MELD score (Fig. 5b–e).
We also chose the cutoff value of 15 points for MELD scores which have been demonstrated to have the best sensitivity and specificity to distinguish survivors from non-survivors [25].
The mean HVTT of cirrhotics with MELD score >15 (19.56 ± 4.85) were significantly shorter (mean HA-HVTT: 2.39 ± 1.21 s; mean PV-HVTT 1.13 ± 0.60 s) than patients with an MELD score <15 (9.58 ± 2.89; mean HA-HVTT 5.84 ± 3.33 s; mean PV-HVTT 2.81 ± 2.30 s) (p < 0.1).
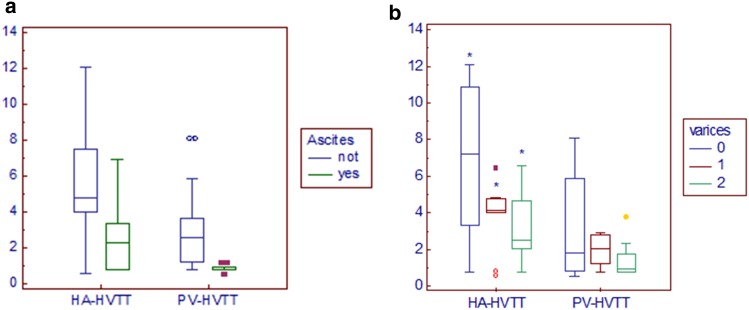
Patients with ascites had earlier transit times (mean HA-HVTT 2.52 ± 1.95 s; mean PV-HVTT 0.85 ± 0.20 s) than participants without ascites (mean HA-HVTT 5.87 ± 3.31 s; mean PV-HVTT 3.01 ± 2.25 s) (p < 0.01 for HA-HVTT and PV-HVTT) (Fig. 6a).
Fig. 6.
a Patients with ascites had earlier transit times than participants without ascites (p = 0.01 for HA-HVTT; p = 0.009 for PV-HVTT). b The mean transit times of patients with varices were related to their grade of severity. HA-HVTT values that are significantly different (p = 0.029*) are indicated. Patients without varices (0) showed longer transit times than those with varices F1 (1) and F2 (2)
The mean transit times of patients with varices was related to their grade of severity: patients with varices F1 showed longer transit times (mean HA-HVTT 3.84 ± 1.82 s, mean PV-HVTT 1.969 ± 0.8665 s) than those with varices F2 (mean HA-HVTT 3.227 ± 2.067 s, mean PV-HVTT 1.429 ± 1.0798 s), achieving a significant difference for HA-HVTT (p < 0.05) but not for PV-HVTT (Fig. 6b).
The intensity peak, the time to peak and the slope of the intensity–time curve obtained from HV were not significantly different in the cirrhosis group with HVWI <1 compared with controls and cirrhotics with HVWI >1.
Discussion
Hepatic vein transit time (HVTT) is a novel tool which provides clinically useful information about hemodynamic changes occurring in cirrhosis and portal hypertension.
The rational basis of the study we have conducted is found in the definition of portal hypertension itself. We postulated that the time employed by a blood pool agent like a second-generation USCA to cross the liver could be a non-invasive measurement of the pressure gradient between extrahepatic vessels and hepatic vein; the blood flow column moves toward the liver from a vessel with a higher pressure (hepatic artery and portal vein) to a vessel where pressure is lower (hepatic vein). We hypothesized that the transit time of the contrast agent across the liver is inversely related to the pressure gradient between the hepatic artery and/or portal vein and the hepatic vein: the higher the gradient, the shorter will be the transit time of the contrast agent.
This pilot study of 38 cirrhotic patients is based on a new method of conceiving hepatic transit times of contrast agents: contrast agents move inside intrahepatic shunts (as documented by Sugimoto et al., [18]) with a velocity that is determined directly by the pressure gradient found.
For the first time, our data show a clear separation of cirrhotics with HVWI >1 and those with HVWI <1, while an overlap of data was found when comparing normal controls and cirrhotics with HVWI >1. This demonstrates that hepatic transit time could be similar in healthy liver and that with cirrhosis when portal hypertension is low. Although our patients did not undergo a quantitative evaluation of the porto-systemic pressure gradient using the technique of hepatic vein transjugular catheterization, we can argue that portal hypertension was mild in cirrhotics with HVWI >1, since all these patients had a triphasic hepatic waveform (that has been demonstrated to correlate with a low level of HVPG by Baik et al.), had no ascites and did not show a patent paraumbilical vein or other porto-systemic shunts detectable on US–Doppler.
Patients with ascites, splenomegaly, varices of large size and worse MELD score had shorter transit times: these data seem to confirm that hepatic transit time of US contrast agents should be considered as a potential tool for the non-invasive assessment of portal hypertension and could explain why in a recent meta-analysis conducted by Feier et al. HVTT seems to have high sensitivity but lower specificity in predicting liver cirrhosis [26]. In addiction, a special role of transit times must be recognized in determining survival of cirrothics.
In Feier’s meta-analysis and in the pivotal study by Albrecht’s (in which the decreased hepatic vein transit time of a first-generation US contrast agent was found to be suggestive of liver cirrhosis), the early arrival time in the hepatic vein was independent of the patient’s Child–Pugh score which is known to be a bad index of survival in cirrhotics; several difficulties and inaccuracies in applying the Child’s classification have been detailed in literature [21, 27, 28]. It only divides patients into poor, intermediate and low risk without quantifying an expected period of survival [21]. Accordingly with this limit, we found that the transit times were related to Child–Pugh class (comparison between three classes of Child), but a significant difference was not achieved (p = 0.371 for HA-HVTT and p = 0.437 for PV-HVTT) when we compared patients with Chid–Pugh class B and C; conversely, a significant difference was found using the cutoff value of 15 points for the MELD score, which has been demonstrated to have the best sensitivity and specificity to distinguish survivors from non-survivors [25].
We can also confirm that there was no difference in the arrival times in the hepatic artery and portal vein of USCA between the three groups of participants. This unexpected finding is not in conflict with the results in other reports [16–19]. The lack of significant difference confirms the idea that transit times are specific indicators of intrahepatic circulation and (unlike what happens for arrival times) are not influenced by other hemodynamic extrahepatic factors which characterize the development of hyperdynamic syndrome (increased cardiac output [29], reduced systemic vascular resistance [30], pulmonary arteriovenous shunts [31]). For this reason, we strongly discourage the use of HVAT in trials for the evaluation of hemodynamic changes in cirrhosis and portal hypertension.
The regression equation found for the HVWI variable demonstrated that the flattening of waveform found in cirrhotics could be due to the presence of intrahepatic shunting rather than to a fixed structural abnormality, reflecting the histopathological changes and derangements observed in liver cirrhosis.
However, cirrhosis is a tumultuous and dynamic disease [32] and HVTT has several potential limitations. First, the time intensity curves were technically inadequate in 13% of the participants. HV could not be properly depicted due to the low compliance of the patients, intestinal bloating and the level of ascites. However, this can evoke limits concerning the ultrasound itself, which probably cannot be exceeded.
Second, the technique reflects right lobe derangement due to cirrhosis and is influenced by the presence of macro-shunts (umbilical vein, collaterals). As shown in Fig. 1, for two of the ‘far out’ participants, the transit times were longer than the average and ultrasonography demonstrated (for the first time in the history of patient) a patent umbilical vein with high mean velocity to Doppler evaluation: blood column preferred shunts with minority resistance (one of the umbilical vein) than lowering the portal pressure level. We speculate that in this acute phase of shunting, blood flowed more slowly in the lobes and transit times were ‘temporarily’ longer. However these cases must be considered as exceptions and even including this transit a significant difference was achieved.
Third, intrahepatic shunting may occur in liver pathology on a transient basis. Activated hepatic stellate cells are involved in the regulation of the microcirculation in the liver. They have the capacity of contraction and relaxation and are involved in the pathogenesis of fibrosis and portal hypertension [32–34]. Although this ‘transient phenomenon’, transit times demonstrate to have great sensibility in assessing vascular modifications since significant levels were found for any variable.
In conclusion, abnormal hepatic vein Doppler waveform in cirrhotic patients could be due to intrahepatic shunts rather than the lack of liver compliance. The separation of cirrhotics with HVWI <1 from the other two groups by measurement of transit times suggests that, despite potential limitation, the technique of HVTT of a second-generation ultrasound contrast agent could be used to understand the pathophysiological mechanisms of portal hypertension in clinical trials and as a simple non-invasive test in clinical practice.
Although hepatic vein transjugular catheterization will remain the gold standard for the diagnosis of portal hypertension, our test may provide useful information, particularly when catheterization is contraindicated or not accessible.
Acknowledgements
The authors dedicate the manuscript to Rosario and Pier Donato Siciliani.
Abbreviations
- US
Ultrasound
- HV
Hepatic vein
- HVPG
Hepatic vein pressure gradient
- USCA
Ultrasound contrast agent
- HVTT
Hepatic vein transit time
- BMI
Body mass index
- MELD
Model for end stage liver disease
- HVWI
Hepatic vein waveform index
- ROI
Region of interest
- AT
Arrival time
- TP
Time to peak
- IP
Intensity to peak
- HVAT
Hepatic vein arrival time
Compliance with ethical standards
Conflict of interest
The authors declare that they have no conflict of interest.
Ethical approval
All procedures performed in studies involving human participants were in accordance with the ethical standards of the institutional and/or national research committee and with the 1964 Helsinki Declaration and its later amendments or comparable ethical standards.
Informed consent
Informed consent was obtained from all individual participants included in the study.
References
- 1.Burns PN. Hemodynamics. In: Taylor KJW, Burns PN, Wells PNT, editors. Clinical applications of Doppler ultrasound. New York: Raven; 1988. pp. 46–75. [Google Scholar]
- 2.Bolondi L, Bassi SL, Gaiani S, Zironi G, Benzi G, Santi V, Barbara L. Liver cirrhosis. Changes of Doppler waveform of hepatic veins. Radiology. 1991;178:513–516. doi: 10.1148/radiology.178.2.1987617. [DOI] [PubMed] [Google Scholar]
- 3.Pennestrí F, Loperfido F, Salvatori MP, Mongiardo R, Ferrazza A, Guccione P, Manzoli U. Assessment of tricuspid regurgitation by pulsed Doppler ultrasonography of the hepatic veins. Am J Cardiol. 1984;54(3):363–368. doi: 10.1016/0002-9149(84)90198-X. [DOI] [PubMed] [Google Scholar]
- 4.Farrant P, Meire HB. Hepatic vein pulsatility assessment on spectral Doppler ultrasound. Br J Radiol. 1997;70:829–832. doi: 10.1259/bjr.70.836.9486048. [DOI] [PubMed] [Google Scholar]
- 5.Von Herbay A, Frieling T, Haussinger D. Association between duplex Doppler sonographic flow pattern in right hepatic vein and various liver diseases. J Clin Ultrasound. 2001;29:25–30. doi: 10.1002/1097-0096(200101)29:1<25::AID-JCU4>3.0.CO;2-A. [DOI] [PubMed] [Google Scholar]
- 6.Kok T, van der Jagt EJ, Haagsma EB, Bijleveld CM, Jansen PL, Boeve WJ. The value of Doppler ultrasound in cirrhosis and portal hypertension. Scand J Gastroenterol Suppl. 1999;230:82–88. doi: 10.1080/003655299750025598. [DOI] [PubMed] [Google Scholar]
- 7.Dietrich CF, Lee JH, Gottschalk R, et al. Hepatic and portal vein flow pattern in correlation with intrahepatic fat deposition and liver histology in patients with chronic hepatitis C. AJR Am J Roentgenol. 1998;171:437–443. doi: 10.2214/ajr.171.2.9694471. [DOI] [PubMed] [Google Scholar]
- 8.Ohta M, Hashizume M, Tomikawa M, Ueno K, Tanoue K, Sugimachi K. Analysis of hepatic vein waveform by Doppler ultrasonography in 100 patients with portal hypertension. Am J Gastroenterol. 1994;89:170–175. [PubMed] [Google Scholar]
- 9.Colli A, Cocciolo M, Riva C, et al. Abnormalities of Doppler waveform of the hepatic veins in patients with chronic liver disease: correlation with histologic findings. AJR Am J Roentgenol. 1994;162:833–837. doi: 10.2214/ajr.162.4.8141001. [DOI] [PubMed] [Google Scholar]
- 10.Baik SK, Kim JW, Kim HS, Kwon SO, Kim YJ, Park JW, Kim SH, Chang SJ, Lee DK, Han KH, Um SH, Lee SS. Recent variceal bleeding: Doppler US hepatic vein waveform in assessment of severity of portal hypertension and vasoactive drug response. Radiology. 2006;240(2):574–580. doi: 10.1148/radiol.2402051142. [DOI] [PubMed] [Google Scholar]
- 11.Claudon M, Cosgrove D, Albrecht T, Bolondi L, Bosio M, Calliada F, Correas JM, Darge K, Dietrich C, D’Onofrio M, Evans DH, Filice C, Greiner L, Jäger K, Jong N, Leen E, Lencioni R, Lindsell D, Martegani A, Meairs S, Nolsøe C, Piscaglia F, Ricci P, Seidel G, Skjoldbye B, Solbiati L, Thorelius L, Tranquart F, Weskott HP, Whittingham T. Guidelines and good clinical practice recommendations for contrast enhanced ultrasound (CEUS)—update 2008. Ultraschall Med. 2008;29(1):28–44. doi: 10.1055/s-2007-963785. [DOI] [PubMed] [Google Scholar]
- 12.D’Onofrio M, Romanini L, Serra C, et al. Contrast enhancement ultrasound application in focal liver lesions characterization: a retrospective study about guidelines application (SOCEUS-CEUS survey) J Ultrasound. 2015;19(2):99–106. doi: 10.1007/s40477-015-0185-y. [DOI] [PMC free article] [PubMed] [Google Scholar]
- 13.D’Onofrio M, Vecchiato F, Cantisani V, Barbi E, Passamonti M, Ricci P, Malagò R, Faccioli N, Zamboni G, Pozzi Mucelli R. Intrahepatic peripheral cholangiocarcinoma (IPCC): comparison between perfusion ultrasound and CT imaging. Radiol Med. 2008;113(1):76–86. doi: 10.1007/s11547-008-0225-1. [DOI] [PubMed] [Google Scholar]
- 14.Cantisani V, Ricci P, Erturk M, et al. Detection of hepatic metastases from colorectal cancer: prospective evaluation of gray scale US versus SonoVue® low mechanical index real time-enhanced US as compared with multidetector-CT or Gd-BOPTA-MRI. Ultraschall Med. 2010;31(5):500–505. doi: 10.1055/s-0028-1109751. [DOI] [PubMed] [Google Scholar]
- 15.Ricci P, Cantisani V, Biancari F, Drud FM, Coniglio M, Di Filippo A, Fasoli F, Passariello R. Could You add a sentence about the proved use of CEUS for the portal thrombosis evaluation as proved by contrast-enhanced color Doppler US in malignant portal vein thrombosis. Acta Radiol. 2000;41(5):470–473. doi: 10.1034/j.1600-0455.2000.041005470.x. [DOI] [PubMed] [Google Scholar]
- 16.Albrecht T, Blomley MSN, Cosgrove DO, Taylor-Robinson SD, Jayram V, Eckersley R, et al. Non invasive diagnosis of hepatic cirrhosis by transi-time analysis of an ultrasound contrast agent. Lancet. 1999;353:1579–1583. doi: 10.1016/S0140-6736(98)06373-9. [DOI] [PubMed] [Google Scholar]
- 17.Lim AKP, Taylor-Robinson SD, Patel N, Eckersley RJ, Goldin RD, Hamilton G, Foster CR, Thomas HC, Cosgrove DO, Blomley MJK. Hepatic vein transit-times using a microbubble agent can predict disease severity non-invasively in patients with hepatitis C. Gut. 2005;54(1):128–133. doi: 10.1136/gut.2003.030965. [DOI] [PMC free article] [PubMed] [Google Scholar]
- 18.Sugimoto H, Kaneko T, Hirota M, Tezel E, Nasao A. Earlier hepatic vein transit-time measured by contrast ultrasonography reflects intrahepatic hemodynamic changes accompanying cirrhosis. J Hepatology. 2002;37:578–583. doi: 10.1016/S0168-8278(02)00264-7. [DOI] [PubMed] [Google Scholar]
- 19.Lim AKP, Patel N, Eckersley RJ, Goldin RD, Thomas HC, Cosgrove DO, Taylor-Robinson SD, Blomley MJK. Hepatic vein transit-time of Sonovue: a comparative study with Levovist. Radiology. 2006;240(1):130–135. doi: 10.1148/radiol.2401041517. [DOI] [PubMed] [Google Scholar]
- 20.Pugh R, Murray-lyon I, Dawson J. Transection of the oesophagus for bleeding oesophageal varices. Br J Surg. 1973;60:646–649. doi: 10.1002/bjs.1800600817. [DOI] [PubMed] [Google Scholar]
- 21.Malinchoc M, Kamath PS, Gordon FD, Peine CJ, Rank J, terBorg PC. A model to predict poor survival in patients undergoing transjugular intrahepatic portosystemic shunts. Hepatology. 2000;31:864–871. doi: 10.1053/he.2000.5852. [DOI] [PubMed] [Google Scholar]
- 22.Beppu K, Inokuchi K, Koyangi N, Nakayama S, Skata H, Kitano S, et al. Prediction of variceal hemorrhage by esophageal endoscopy. Gastrointest Endosc. 1981;27:213–218. doi: 10.1016/S0016-5107(81)73224-3. [DOI] [PubMed] [Google Scholar]
- 23.Pedersen JF, Madsen LG, Larsen VA, Hamberg O, Horn T, Federspiel B, Bytzer P. A Doppler waveform index to characterize hepatic vein velocity pattern and evaluate hepatic fibrosis. J Clin Ultrasound. 2008;36(4):208–211. doi: 10.1002/jcu.20446. [DOI] [PubMed] [Google Scholar]
- 24.Ridolfi F, Abbattista T, Marini F, Vedovelli A, Quagliarini P, Busilacchi P, Brunelli E. Contrast-enhanced ultrasound to evaluate the severity of chronic hepatitis C. Dig Liver Dis. 2007;39(10):929–935. doi: 10.1016/j.dld.2007.06.006. [DOI] [PubMed] [Google Scholar]
- 25.Amitrano L, Guardascione MA, Bennato R, Manguso F, Balzano A. MELD score and hepatocellular carcinoma identify patients at different risk of short-term mortality among cirrhotics bleeding from esophageal varices. J Hepatol. 2005;42:820–825. doi: 10.1016/j.jhep.2005.01.021. [DOI] [PubMed] [Google Scholar]
- 26.Feier DS, Badea R, Lupsor M, Stefanescu H, Crisan D, Radu C, Maniu A (2011) Ultrasound contrast—enhanced hepatic vein transit time in the diagnosis of liver cirrhosis. A meta-analysis. EASL monothematic Conference, EVALUATION of disease severity and prognosis in chronic liver disease, Nice January 28-29/2011
- 27.Kamath PS, Wiesner RH, Malinchoc M, et al. A model to predict survival in patients with end-stage liver disease. Hepatology. 2001;33:464–470. doi: 10.1053/jhep.2001.22172. [DOI] [PubMed] [Google Scholar]
- 28.Conn HO. A peek at the Child–Turcotte classification. Hepatology. 1981;1(6):673–676. doi: 10.1002/hep.1840010617. [DOI] [PubMed] [Google Scholar]
- 29.Murray JF, Dawson AM, Sherlock S. Circulatory changes in chronic liver disease. Am J Med. 1958;24:358–367. doi: 10.1016/0002-9343(58)90322-X. [DOI] [PubMed] [Google Scholar]
- 30.Kontos HA, Shapiro W, Mauck HP, Patterson JL. General and regional circulatory alterations in cirrhosis of he liver. Am J Med. 1964;37:526–535. doi: 10.1016/0002-9343(64)90066-X. [DOI] [PubMed] [Google Scholar]
- 31.Augusti AGN, Roca J, Bosch J, Rodriguez-Roisin R. The lung in patients with cirrhosis. J Hepatol. 1990;10:251–257. doi: 10.1016/0168-8278(90)90061-U. [DOI] [PubMed] [Google Scholar]
- 32.Kim MY, Baik SK, Lee SS. Haemodynamic alteration in cirrhosis and portal hypertension. Korean J Hepatol. 2010;16(4):347–352. doi: 10.3350/kjhep.2010.16.4.347. [DOI] [PMC free article] [PubMed] [Google Scholar]
- 33.Pedersen JF, Larsen VA, Bytzer P, Madsen LG, Hamberg O. Hepatic transit time of ultrasound contrast in biopsy characterized liver disease. Acta Radiol. 2005;46(6):557–560. doi: 10.1080/02841850510021689. [DOI] [PubMed] [Google Scholar]
- 34.Reynaert H, Thompson MG, Thomas T, Geerts A. Hepatic stellate cells: role in microcirculation and pathophysiology of portal hypertension. Gut. 2002;50:571–581. doi: 10.1136/gut.50.4.571. [DOI] [PMC free article] [PubMed] [Google Scholar]


