

Abstract
Aims/Introduction
To investigate the effect of telomere shortening and other predictive factors of non‐alcoholic fatty liver disease (NAFLD) in type 2 diabetes mellitus patients in a 6‐year prospective cohort study.
Materials and Methods
A total of 70 type 2 diabetes mellitus (mean age 57.8 ± 6.7 years) patients without NAFLD were included in the study, and 64 of them were successfully followed up 6 years later, excluding four cases with significant alcohol consumption. NAFLD was diagnosed by the hepatorenal ratio obtained by a quantitative ultrasound method using NIH image analysis software. The 39 individuals that developed NAFLD were allocated to group A, and the 21 individuals that did not develop NAFLD were allocated to group B. Fluorescent real‐time quantitative polymerase chain reaction was used to measure telomere length.
Results
There was no significant difference between the two groups in baseline telomere length; however, at the end of the 6th year, telomere length had become shorter in group A compared with group B. There were significant differences between these two groups in baseline body mass index, waistline, systolic blood pressure, glycated hemoglobin and fasting C‐peptide level. In addition, the estimated indices of baseline insulin resistance increased in group A. Fasting insulin level, body mass index, systolic blood pressure at baseline and the shortening of telomere length were independent risk factors of NAFLD in type 2 diabetes mellitus patients.
Conclusions
Telomere length became shorter in type 2 diabetes mellitus patients who developed NAFLD over the course of 6 years. Type 2 diabetes mellitus patients who developed NAFLD had more serious insulin resistance compared with those who did not develop NAFLD a long time ago.
Keywords: Non‐alcoholic fatty liver disease, Telomere shortening, Type 2 diabetes mellitus
Introduction
Non‐alcoholic fatty liver disease (NAFLD) is a very common disease, with a prevalence reported to be as high as 35.1~58.3% in Western countries1, that has a profound relationship with insulin resistance. A recent study that calculated a fatty liver index based on the indices of age, race‐ethnicity, waist circumference, serum glutamic pyruvate transaminase activity, fasting insulin and fasting blood glucose showed that NAFLD prevalence increased substantially over two decades in the USA2. Unfortunately, Asian people are particularly susceptible to NAFLD, its increasing epidemiology in Asia during the past three decades is well‐documented and the prevalence in China is currently approximately 20%3.
Deoxyribonucleic acid (DNA) telomere length is a natural biological clock in the human body, and it is indicative of cell aging. Studies have shown that type 2 diabetes mellitus and metabolic syndrome are both related to shortened telomere length4, 5. It was also reported that hepatocyte telomeres were shorter in NAFLD patients than controls6. Triggering factors, such as obesity and insulin resistance, can induce telomere shortening in genetically susceptible patients and further exacerbate the progression of NAFLD7. NAFLD and type 2 diabetes mellitus frequently coexist8, so telomere shortening might be either the synergies of these two diseases or the results of their respective roles. So far, there is no prospective study that has reported on the relationship between the shortening of DNA telomere length and the incidence of NAFLD in type 2 diabetes mellitus patients. Therefore, in the present study, by determining DNA telomere length, the incidence of NAFLD, the change of blood glucose, lipids, insulin or C‐peptide level in type 2 diabetes mellitus patients during the 6‐year follow‐up period, and analyzing the relationship between various factors including shortening of DNA telomere length, blood pressure, body mass index (BMI) and so on, and the incidence of NAFLD in type 2 diabetes mellitus patients, the potential predictive factors of NAFLD were explored, so as to provide a theoretical basis for prevention and early prediction of NAFLD in type 2 diabetes mellitus patients.
Methods
Participants
Participants in the present study were type 2 diabetes mellitus patients without NAFLD who visited the clinic of endocrinology at Peking Union Medical College Hospital, Beijing, China, from April 2005 to April 2006. Approval of the protocols and informed consent forms was obtained from the institutional ethics committee of the Peking Union Medical College Hospital of Chinese Academy of Medical Sciences. In order to control the confounding factors, the patients with diabetic complications, any liver diseases or insulin treatment at baseline were excluded. Also, the smoking and drinking habits, diet, physical activity, blood pressure and medication for diabetes, hypertension or hyperlipidemia were recorded. Inclusion and exclusion criteria are shown in Table 1.
Table 1.
Inclusion and exclusion criteria
| Inclusion criteria | Exclusion criteria |
|---|---|
|
|
HBsAg, hepatitis B surface antigens; HCV‐Ab, hepatitis C virus antibodies; HIV‐Ab, human immunodeficiency virus antibodies; SGPT, serum glutamic pyruvate transaminase; TBIL, total bilirubin ULN, upper limits of normal.
The number of type 2 diabetes mellitus patients without NAFLD screened from April 2005 to April 2006 in the Endocrinology Clinic of Peking Union Medical College Hospital was 103, and 23 cases that met at least one of the exclusion criteria were excluded. From April 2011 to March 2012, this cohort was paid a regular return visit. A total of 64 patients were successfully followed up, and four cases of significant alcohol consumption were excluded. The same parameters were collected as at baseline, except for insulin level, because 30% (18/60 patients) accepted insulin therapy. This cohort study interval was 6 years, and only C‐peptide concentrations that reflected endogenous insulin were measured at the end‐point. According to whether the diagnosis of NAFLD could be made, the participants were divided into two groups. Group A included 39 patients with NAFLD, group B included 21 patients without NAFLD. The protocol was approved by the ethics review board of Peking Union Medical College Hospital, and the flow chart is shown in Figure 1.
Figure 1.
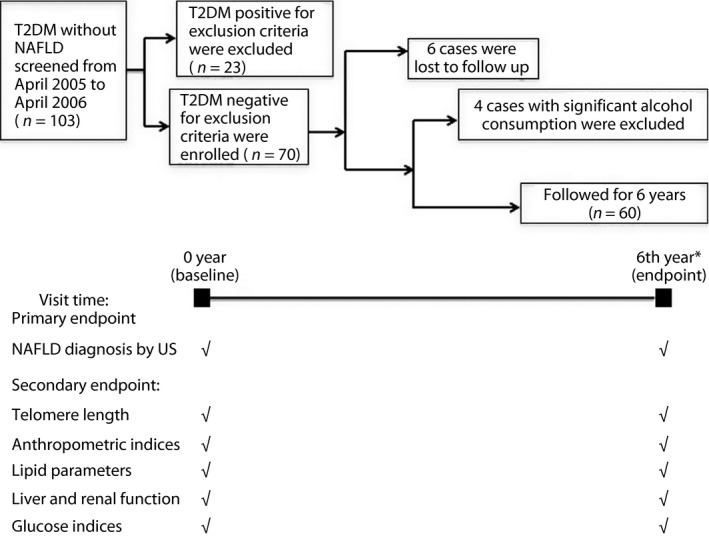
Study flowchart. The number of type 2 diabetes (T2DM) patients without non‐alcoholic fatty liver disease (NAFLD) screened from April 2005 to April 2006 in the Endocrinology Clinic of Peking Union Medical College Hospital was 103, and 23 cases met at least one of the exclusion criteria. The total follow‐up duration was 6 years. Telomere lengths were measured at baseline and endpoint. NAFLD was diagnosed by quantification ultrasound (US). *The same parameters including lipid, liver, renal function and glucose metabolism were collected as baseline except for insulin level, because 30% (18/60 patients) accepted insulin therapy at the end‐point.
The primary end‐point was the diagnosis of NAFLD determined by sonographic quantification. The secondary end‐points were: (i) the change of leukocytes DNA telomere length during 6 years in patients who developed NAFLD vs those who did not develop NAFLD in this type 2 diabetes mellitus cohort; (ii) lipid parameters, including cholesterol, low‐density lipoprotein cholesterol, high‐density lipoprotein cholesterol (HDL‐C) and triglyceride (TG); (iii) liver and renal function, including serum glutamic pyruvate transaminase, TBIL and serum creatinine; and (iv) the parameters of glucose metabolism, including glycated hemoglobin (HbA1c) and fasting blood glucose.
Anthropometric, biochemical indices and medical history
The patients' anthropometric indices, including systolic blood pressure (SBP), diastolic blood pressure, weight, height and BMI calculated by dividing weight in kilograms by height in meters squared, were collected at baseline and at end‐point. Meanwhile, the medical history including the duration of type 2 diabetes mellitus, smoking and drinking habits, diet, physical activity, and medication for diabetes and hyperlipidemia were recorded. In addition to the biochemical indices previously mentioned in the secondary end‐points, plasma glucose (mmol/L) and insulin (uU/mL), as well as C‐peptide (ng/mL) concentrations at 0 h, 1 h, 2 h and 3 h during the 75‐g oral glucose tolerance test (OGTT) were measured. During 6‐year intervals, regular visits were made every 3–6 months to these patients, and treatments for diabetes, hypertension or hyperlipidemia were adjusted if necessary.
Estimated insulin sensitivity and β‐cell function indices
Insulin sensitivity and β‐cell function indices were evaluated as previously described9, 10. Briefly, the following formulas were calculated during 3‐h OGTT (GLU0 h denotes plasma glucose level at 0 h during OGTT; INS0 h denotes plasma insulin level at serum insulin level; ISI denotes insulin sensitivity index during OGTT; CIR1 h denotes corrected incremental insulin response at 1 h during OGTT; DI1 h denotes disposition index at 1 h during OGTT): (i) for insulin sensitivity: homeostatic model assessment of insulin resistance (HOMA‐IR) = GLU0 h × INS0 h/22.5; ISI‐OGTT = 10,000/square root (GLU0 h × INS0 h × GLUmean × INSmean), (GLUmean or INSmean denote the average glucose or insulin level during 3‐h OGTT); (ii) for β‐cell function: HOMA‐β = 20 × INS0 h/(GLU0 h – 3.5); CIR1 h = (100 × INS1 h)/([GLU1 h × GLU1 h – 3.89]); DI1 h = CIR1 h × ISI‐OGTT.
Diagnosis of NAFLD
The diagnosis of NAFLD determined by a quantitative ultrasound method was the primary end‐point event in the present study. In this study, an ultrasound histogram method was used to measure and calculate the liver/renal echo ratio, so as to quantify fat content in the liver. The same LOGIQ E9 ultrasound device (GE, Milwaukee, WI, USA) was used to obtain the mean hepatic and renal echo brightness index by the same ultrasound physician. The ultrasound hepatorenal sonographic indices were calculated by NIH image analysis software (https://imagej.nih.gov). The diagnosis of NAFLD was made when the hepatic‐renal echo‐intensity ratio was ≥1.5, and the other causes of hepatic steatosis and the possibility of significant alcohol consumption could be excluded.
Measurement of DNA telomere length
In fluorescent real‐time quantitative polymerase chain reaction, the ratio between repeated copy number of telomeres and single copy genes was constant. The telomere to single copy gene ratio was positively correlated with DNA telomere length, and was a monochrome multiplex method highly correlated with terminal restriction fragment lengths measured by Southern blot. Primer template and polymerase chain reaction conditions were described in the telomere length studies of Cawthon et al.11 β‐Globin was used as the internal reference gene. Primers were synthesized by Sangon Biotech (Shanghai, China).
Statistical analysis
Statistical analyses were carried out using spss v17.0 (SPSS Inc., Chicago, IL, USA). A two‐tailed P‐value ≤0.05 was considered statistically significant. For variables with normal distribution, such as BMI, waistline, SBP, diastolic blood pressure, serum creatinine, TC, low‐density lipoprotein cholesterol, HDL‐C, fasting blood glucose, HbA1c and DNA telomere length, Student's t‐test was used to evaluate the difference from baseline to end‐point or between two groups. Variables with skewed distribution, such as C‐peptide, TG, HOMA‐IR and so on, which were determined by one‐sample Kolmogorov–Smirnov test, were examined by Kruskal–Wallis test or appropriately transformed before analyses. Binary logistic regression analysis was carried out to detect possible independent risk factors for occurrence of NAFLD in type 2 diabetes mellitus.
Results
Anthropometric and biochemical features of the cohort
The blood glucose control of this cohort was satisfied during 6‐year follow up, although 30% (18/60 patients) accepted insulin therapy at the end‐point. There were no statistical differences between the end‐point vs baseline in the total cohort or in each group (HbA1c 7.04 ± 1.29% at end‐point in total vs 7.21 ± 1.19% at baseline in total). However, HbA1c in group A was higher than group B, whether at baseline (7.17 ± 1.35% in group A vs 6.37 ± 0.7% in group B) or at the end‐point (7.34 ± 1.24% in group A vs 6.8 ± 1.05% in group B). There were significant differences between the two groups in baseline BMI (25.20 ± 2.98 kg/m2 in group A vs 22.60 ± 1.59 kg/m2 in group B), SBP (123.94 ± 17.31 mmHg in group A vs 110.67 ± 7.60 mmHg in group B), fasting C‐peptide level (2.2 ng/mL, 95% confidence interval [CI] 1.9–2.51 ng/mL in group A vs 1.46 ng/mL, 95% CI: 0.99–1.92 ng/mL in group B). Although, no statistically significant difference was observed in other general data between the two groups, including age, diabetes duration, waistline, diastolic blood pressure, serum glutamic pyruvate transaminase, total bilirubin, serum creatinine, blood urea nitrogen and so on (Table 1).
Comparison of serum lipid levels at baseline and end‐point
Although there were no significant differences in baseline blood lipid levels between the two groups, after 6 years, the TG level of group A was significantly higher than that of group B (1.55 mmol/L, 95% CI: 1.29–1.81 mmol/L vs 0.95 mmol/L, 95% CI: 0.52–1.38 mmol/L, P = 0.010), whereas HDL‐C in group A was significantly lower than group B (1.28 ± 0.29 mmol/L vs 1.60 ± 0.38 mmol/L, P = 0.002; Table 2). There was no difference between two groups in low‐density lipoprotein cholesterol or TC.
Table 2.
Anthropometric and biochemical characteristics of participants by subgroups
| Baseline (6 years earlier) | Endpoint (6 years later) | |||||
|---|---|---|---|---|---|---|
| Factor | Group A n = 39 | Group B n = 21 | Total† n = 70 | Group A n = 39 | Group B n = 21 | Total n = 60 |
| Age (years) | 57.1 ± 6.9 | 59.5 ± 6.0 | 57.8 ± 6.7 | 63.1 ± 6.9 | 65.5 ± 6.0 | 63.8 ± 6.7¶ |
| Diabetes duration (years) | 5.2 (3.5–6.9)‡ | 11.4 (7.1–15.7) | 7.0 (5.2–8.8) | 11.2§ (9.5–12.9) | 17.4 (13.1–21.7) | 13.0 (11.1–14.8)¶ |
| BMI (kg/m2) | 25.20 ± 2.98‡ | 22.60 ± 1.59 | 24.64 ± 2.93 | 25.88 ± 3.38§ | 22.53 ± 2.70 | 24.87 ± 3.47 |
| Waistline (cm) | 91.2 ± 9.15 | 85.9 ± 8.33 | 90.0 ± 9.2 | 95.1 ± 11.6 | 84.0 ± 7.7 | 91.9 ± 11.7 |
| SBP (mmHg) | 123.94 ± 17.31‡ | 110.67 ± 7.60 | 121.09 ± 16.60 | 143.40 ± 18.87§ | 128.33 ± 14.04 | 139.24 ± 18.48¶ |
| DBP (mmHg) | 73.79 ± 8.75 | 70.00 ± 7.50 | 72.98 ± 8.56 | 73.84 ± 9.31§ | 67.93 ± 8.39 | 72.98 ± 70.31 |
| SGPT (U/L) | 21.28 (18.72–23.84) | 17.56 (13.65–21.46) | 20.46 (18.31–22.62) | 23.72 (18.74–28.69) | 29.11 (17.32–40.90) | 24.90 (20.44–29.36) |
| TBIL (μmol/L) | 11.73 (9.84–13.62) | 13.64 (10.92–16.37) | 12.15 (10.59–13.71) | 11.46 (9.41–13.51) | 12.31 (9.91–14.72) | 11.65 (10.00–13.29) |
| SCr (μmol/L) | 78.12 ± 11.11 | 83.67 ± 8.05 | 79.24 ± 10.81 | 57.19 ± 12.77 | 59.53 ± 9.88 | 56.63 ± 11.68 |
| TC (mmol/L) | 4.98 ± 0.93 | 5.07 ± 0.57 | 5.00 ± 0.86 | 4.99 ± 0.93 | 5.07 ± 0.57 | 5.18 ± 0.98 |
| TG (mmol/L) | 1.52 (1.21–1.82) | 1.30 (0.53–2.07) | 1.47 (1.19–1.74) | 1.55 (1.29–1.81)§ | 0.95 (0.52–1.38) | 1.42 (1.19–1.65) |
| LDL‐C (mmol/L) | 3.14 ± 0.85 | 3.20 ± 0.64 | 3.16 ± 0.80 | 3.28 ± 0.83 | 3.13 ± 0.91 | 3.20 ± 0.86 |
| HDL‐C (mmol/L) | 1.43 ± 0.36 | 1.64 ± 0.41 | 1.48 ± 0.38 | 1.28 ± 0.29‡, § | 1.60 ± 0.38 | 1.35 ± 0.36¶ |
| HbA1c (%) | 7.17 ± 1.35‡ | 6.37 ± 0.70 | 7.21 ± 1.19 | 7.34 ± 1.24§ | 6.80 ± 1.05 | 7.04 ± 1.29 |
| FBG | 7.83 ± 2.61 | 7.23 ± 2.28 | 7.70 ± 2.53 | 7.72 ± 2.15 | 7.38 ± 1.88 | 7.64 ± 2.07 |
| Fasting C‐peptide | 2.20 (1.90–2.51)‡ | 1.46 (0.99–1.92) | 2.04 (1.77–2.31) | 1.44 (1.22–1.66)§ | 1.04 (0.81–1.27) | 1.35 (1.17–1.54) |
Data presented as arithmetic means ± standard deviation for normal variables and geometric means (95% confidence interval) for skewed variables. †Total at baseline including the patients were failed to follow‐up and patients developed alcoholic fatty liver disease. ‡ P < 0.05 vs group B at baseline. § P < 0.05 vs group B at end‐point. ¶ P < 0.05 vs total at baseline. group A, patients that developed non‐alcoholic fatty liver disease (NAFLD) at end‐point; Group B, patients with non‐NAFLD at end‐point. BMI, body mass index; DBP, diastolic blood pressure; FBG, fasting blood glucose; HbA1c, glycated hemoglobin; HDL‐C, high‐density lipoprotein cholesterol; LDL‐C, low‐density lipoprotein cholesterol; SBP, systolic blood pressure; SCr, serum creatinine; SGPT, serum glutamic pyruvate transaminase; TBIL, total bilirubin; TC, total cholesterol; TG, triglycerides.
Estimated insulin sensitivity and β‐cell function indices at baseline
HOMA‐IR, the estimated index of baseline insulin resistance increased in group A (2.98, 95% CI: 2.44–3.51) compared with group B (1.31, 95% CI: 0.72–1.90). Meanwhile, ISI‐OGTT, the insulin sensitivity index decreased in group A (102.87, 95% CI: 80.42–125.32) compared with group B (221.75, 95% CI: 138.83–304.68) at baseline; however, the estimated indices of β‐cell function at baseline, such as HOMA‐β, CIR1 h and DI1 h, had no difference between the two groups (Table 3).
Table 3.
Estimated insulin sensitivity and pancreatic β‐cell function indices at baseline
| Group B | Group A | P‐value | |
|---|---|---|---|
| HOMA‐IR | 1.31 (0.72–1.90) | 2.98 (2.44–3.51) | 0.001 |
| HOMA‐β | 28.13 (14.31–41.95) | 55.53 (38.93–72.12) | 0.052 |
| ISI‐OGTT | 221.75 (138.83–304.68) | 102.87 (80.42–125.32) | 0.001 |
| CIR1 h | 44.07 (13.52–74.62) | 89.43 (45.84–133.03) | 0.507 |
| DI1 h | 8,847.06 (2,429.26–15,264.85) | 7,439.59 (3,680.86~11,198.31) | 0.318 |
Data presented as median (95% confidence interval). Group A, patients that developed non‐alcoholic fatty liver disease (NAFLD) at end‐point; Group B, patients with non‐NAFLD at end‐point. CIR1 h, corrected incremental insulin response at 1 h during oral glucose tolerance test; DI1 h, disposition index at 1 h during oral glucose tolerance test; HOMA‐β, homeostatic model assessment of insulin resistance; HOMA‐IR, homeostatic model assessment of β‐cell function; ISI‐OGTT, insulin sensitivity index during oral glucose tolerance test.
DNA telomere length change during 6 years in two groups
There was no significant difference between the two groups in baseline DNA telomere (group A 1.086 ± 0.144 vs group B 1.041 ± 0.081, P = 0.254). The telomere length at the end‐point over the 6 years in group A was shorter than group B(0.946 ± 0.013 in group A, and 1.020 ± 0.064 in group B, P = 0.003). The length of DNA telomere in group A became significantly shorter at the end‐point than the baseline (0.944 ± 0.082 vs 1.088 ± 0.146, P < 0.001); however, there was no difference after 6 years of follow up in group B (1.020 ± 0.064 vs 1.041 ± 0.081, P = 0.132; Figure 2).
Figure 2.
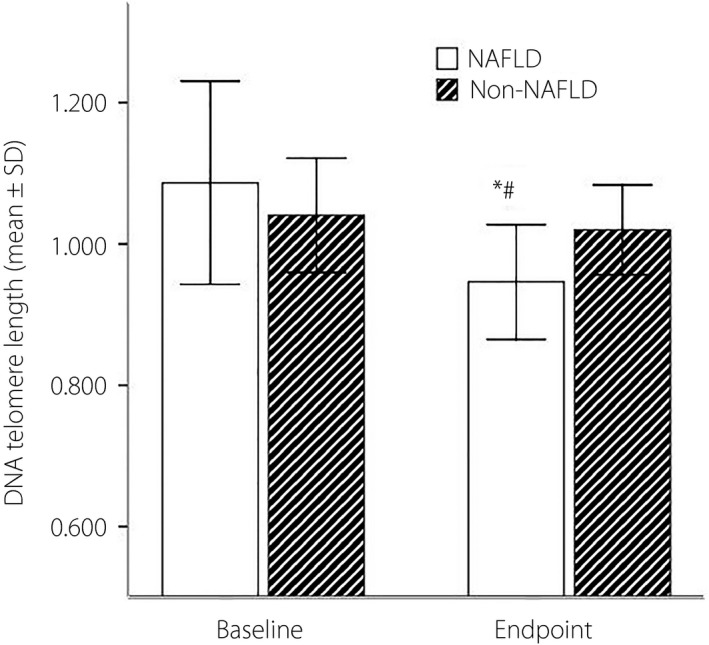
The length of deoxyribonucleic acid (DNA) telomere at baseline and at end‐point between the two groups *The length of DNA telomere in the non‐alcoholic fatty liver disease (NAFLD) group had become significantly shorter at the end‐point than at baseline (0.944 ± 0.082 vs 1.088 ± 0.146, P < 0.001); however, there was no difference after 6 years of follow up in non‐NAFLD group (1.020 ± 0.064 vs 1.041 ± 0.081, P = 0.132). There was no difference in telomere length between the NAFLD group and non‐NAFLD group at baseline (1.086 ± 0.144 vs 1.041 ± 0.081, P = 0.254). #However, the length of DNA telomere in the NAFLD group at the end‐point had become significantly shorter than the non‐NAFLD group (0.946 ± 0.013 vs 1.020 ± 0.064, P = 0.003). SD, standard deviation.
Analysis of risk factors of incidence of NAFLD in type 2 diabetes
Binary logistic regression showed that when adjusted for smoking habits, HbA1c, blood pressure and lipid level, fasting insulin level (OR: 1.821, 95% CI: 1.143–2.901; P = 0.012), BMI (OR: 1.686, 95% CI: 1.067–2.665; P = 0.025), SBP (OR: 1.055, 95% CI: 1.011–1.100; P = 0.014) at baseline and the percentile change of telomere length (OR: 1.501, 1.193–1.888; P = 0.001), but not any of the lipid composition, were the independent risk factors for the incidence of NAFLD in type 2 diabetes mellitus patients (Table 4).
Table 4.
Binary logistic regression analysis to identify the risk factors of non‐alcoholic fatty liver disease
| Factors | P | OR | 95% CI | |
|---|---|---|---|---|
| Lower limit | Upper limit | |||
| BMI (kg/m2) | 0.025 | 1.686 | 1.067 | 2.665 |
| SBP (mmHg) | 0.014 | 1.055 | 1.011 | 1.100 |
| Fasting insulin (uIU/mL) | 0.012 | 1.821 | 1.143 | 2.901 |
| Changes in telomere length (%)† | 0.001 | 1.501 | 1.193 | 1.888 |
†The percentile change of deoxyribonucleic acid telomere length during 6 years. CI, confidence interval.
Discussion
Recently, the DNA telomere length has become one of the hot spots in the study of cell apoptosis and type 2 diabetes mellitus. Data have shown that shortening of telomere length is associated with type 2 diabetes and atherosclerosis12, 13. The mechanism of shortening of telomere length is related to various factors causing cell biological aging and DNA sequence replication damage, such as oxidative stress, obesity and insulin resistance14, 15. The present study showed that DNA telomere length became shorter in the NAFLD group compared with the non‐NAFLD group at the end‐point, although there was no significant difference in the two groups at baseline. It was necessary to consider whether HbA1c level was a confounding factor of telomere shortening, because blood glucose control in the non‐NAFLD group was better than the NAFLD group, both at baseline and end‐point. First, it was also found that DNA telomere length became shorter compared with that 6 years earlier in type 2 diabetes mellitus patients who developed NAFLD with glucose levels unchanged. Second, logistic regression showed percentile change of telomere length was an independent risk factor for the incidence of NAFLD when adjusted for HbA1c, BMI and blood pressure. The data showed that the mechanism linking telomere shortening to NAFLD development was independent of adiposity, insulin resistance and neurovegetative activation. Instead, increased susceptibility to cell senescence might be involved, which leads to the progression of NAFLD in these patients after telomere attrition. These findings are consistent with hepatocyte senescence and permanent cell cycle arrest in NAFLD in a previous study6. In that study, hepatocytes in NAFLD showed a lack of cell cycle progression beyond the G1/S phase and high‐level expression of p21, the universal cell cycle inhibitor. Telomere DNA has a low DNA damage repair ability in the process of replication. Shortening of telomere length is also related to oxidative stress level in the cell. In high oxidative stress states, such as metabolic syndrome and obesity, shortening of telomere length occurs more rapidly14. The results of the present study also found that type 2 diabetes mellitus patients who developed NAFLD at the end‐point had more serious insulin resistance compared with those who did not develop NAFLD at baseline, which was a long time before the diagnosis of NAFLD could be made. It was suggested that the interaction between the shortening of DNA telomere length and increased risk of NAFLD might be induced by insulin resistance, thus increasing the intracellular oxidative stress mechanism.
Obesity and hypertension are the common risk factors for type 2 diabetes and NAFLD16. The results of the present study showed that the baseline BMI and SBP levels in the NAFLD group were significantly higher than that in the group without NAFLD. Logistic regression analysis of the present study also showed that increased BMI and SBP at baseline also raised the incidence of NAFLD in type 2 diabetes patients in the future.
The results of the present study showed that baseline C‐peptide levels in group A were significantly higher than those in group B, and baseline fasting insulin level was the independent risk factor. In contrast, the estimated insulin sensitivity indices, such as ISI‐OGTT and HOMA‐IR, became worse in group A compared with group B, which showed that insulin resistance plays an important role in the occurrence of NAFLD in type 2 diabetes mellitus patients. Insulin resistance might cause enhanced lipolysis in peripheral adipose tissues, increase of free fatty acid (FFA), thus resulting in lipid deposition in the liver and hepatic steatosis17. In contrast, in the effect of oxidative stress, insulin resistance can increase FFA, leading to intracellular oxidant and anti‐oxidant imbalance. Insulin resistance promotes increased expression of CYP4A and CYP2E1, increases oxidation of FFAβ, activates the JNK1 pathway18 and initiates a cascade reaction of inflammatory factors including tumor necrosis factor and interleukin‐6, thus forming a vicious circle between insulin resistance and NAFLD, and aggravating hepatic steatosis19.
Previously, it was found in the same cohort that the change in DNA telomere length over 6 years was not significantly correlated with baseline blood lipid20. There was no significant difference in baseline blood lipid profile between the two groups, but after 6 years of follow up, the TG level of group A was significantly higher than that of group B, whereas the HDL‐C was significantly lower. Also, in the present study, baseline lipid levels were not found to be independent risk factors of the incidence of NAFLD in type 2 diabetes patients. These results suggested that dyslipidemia was more like a consequence rather than the pathogenesis of NAFLD.
There were some limitations to the present study. The diagnosis of NAFLD was based on ultrasonography, which was generally considered not accurate enough. It is known that the sensitivity of liver ultrasonography (parenchymal echo alone) is not optimal for hepatic fat content <12.5%21, However, using a combination of hepatic/renal ratio and hepatic attenuation index, liver ultrasonography showed significant improvements in diagnostic performance in both sensitivity and specificity22, 23. Another limitation of the present study was that the telomere length was determined in peripheral blood leukocytes, but not in the liver. However, recent study by Zierer et al.24 suggested that certain metabolites associated with aging and liver function, such as gamma glutamyl amino acids, are correlated with leukocyte telomere length. Our sample size was relatively small. In addition, all of the patients in the present cohort were from the Chinese Han population, and these results might not be generalizable to other populations. However, the present study provides some interesting suggestions for future studies with more samples to further confirm the relationship between NAFLD and telomere length change.
Disclosure
The authors declare no conflict of interest.
Acknowledgments
We sincerely appreciate all participants in this study, and all medical staff for their invaluable assistance in providing and collecting specimen. This project was supported by the National Natural Science Foundation of China (grant no. 81270878) and National Key Program of Clinical Science of China.
J Diabetes Investig 2017; 8: 174–180
Fan Ping and Zeng‐yi Li contributed equally to this work.
References
- 1. Williams CD, Stengel J, Asike MI, et al Prevalence of nonalcoholic fatty liver disease and nonalcoholic steatohepatitis among a largely middle‐aged population utilizing ultrasound and liver biopsy: a prospective study. Gastroenterology 2011; 140: 124–131. [DOI] [PubMed] [Google Scholar]
- 2. Ruhl CE, Everhart JE. Fatty liver indices in the multiethnic United States National Health and Nutrition Examination Survey. Aliment Pharmacol Ther 2015; 41: 65–76. [DOI] [PubMed] [Google Scholar]
- 3. Farrell GC, Wong VW, Chitturi S. NAFLD in Asia–as common and important as in the West. Nat Rev Gastroenterol Hepatol 2013; 10: 307–318. [DOI] [PubMed] [Google Scholar]
- 4. Revesz D, Milaneschi Y, Verhoeven JE, et al Telomere length as a marker of cellular aging is associated with prevalence and progression of metabolic syndrome. J Clin Endocrinol Metab 2014; 99: 4607–4615. [DOI] [PubMed] [Google Scholar]
- 5. Willeit P, Raschenberger J, Heydon EE, et al Leucocyte telomere length and risk of type 2 diabetes mellitus: new prospective cohort study and literature‐based meta‐analysis. PLoS One 2014; 9: e112483. [DOI] [PMC free article] [PubMed] [Google Scholar]
- 6. Aravinthan A, Scarpini C, Tachtatzis P, et al Hepatocyte senescence predicts progression in non‐alcohol‐related fatty liver disease. J Hepatol 2013; 58: 549–556. [DOI] [PubMed] [Google Scholar]
- 7. Donati B, Valenti L. Telomeres, NAFLD and Chronic Liver Disease. Int J Mol Sci 2016; 17: 383. [DOI] [PMC free article] [PubMed] [Google Scholar]
- 8. Smith BW, Adams LA. Nonalcoholic fatty liver disease and diabetes mellitus: pathogenesis and treatment. Nat Rev Endocrinol 2011; 7: 456–465. [DOI] [PubMed] [Google Scholar]
- 9. Hanson RL, Pratley RE, Bogardus C, et al Evaluation of simple indices of insulin sensitivity and insulin secretion for use in epidemiologic studies. Am J Epidemiol 2000; 151: 190–198. [DOI] [PubMed] [Google Scholar]
- 10. Kirwan JP, Huston‐Presley L, Kalhan SC, et al Clinically useful estimates of insulin sensitivity during pregnancy: validation studies in women with normal glucose tolerance and gestational diabetes mellitus. Diabetes Care 2001; 24: 1602–1607. [DOI] [PubMed] [Google Scholar]
- 11. Cawthon RM. Telomere length measurement by a novel monochrome multiplex quantitative PCR method. Nucleic Acids Res 2009; 37: e21. [DOI] [PMC free article] [PubMed] [Google Scholar]
- 12. Adaikalakoteswari A, Balasubramanyam M, Ravikumar R, et al Association of telomere shortening with impaired glucose tolerance and diabetic macroangiopathy. Atherosclerosis 2007; 195: 83–89. [DOI] [PubMed] [Google Scholar]
- 13. Zee RY, Castonguay AJ, Barton NS, et al Mean leukocyte telomere length shortening and type 2 diabetes mellitus: a case‐control study. Transl Res 2010; 155: 166–169. [DOI] [PubMed] [Google Scholar]
- 14. Su Y, Liu XM, Sun YM, et al The relationship between endothelial dysfunction and oxidative stress in diabetes and prediabetes. Int J Clin Pract 2008; 62: 877–882. [DOI] [PubMed] [Google Scholar]
- 15. Kassab A, Piwowar A. Cell oxidant stress delivery and cell dysfunction onset in type 2 diabetes. Biochimie 2012; 94: 1837–1848. [DOI] [PubMed] [Google Scholar]
- 16. Marchesini G, Bugianesi E, Forlani G, et al Nonalcoholic fatty liver, steatohepatitis, and the metabolic syndrome. Hepatology 2003; 37: 917–923. [DOI] [PubMed] [Google Scholar]
- 17. Hanley AJ, Williams K, Festa A, et al Liver markers and development of the metabolic syndrome: the insulin resistance atherosclerosis study. Diabetes 2005; 54: 3140–3147. [DOI] [PubMed] [Google Scholar]
- 18. Weston CR, Davis RJ. The JNK signal transduction pathway. Curr Opin Cell Biol 2007; 19: 142–149. [DOI] [PubMed] [Google Scholar]
- 19. Wieckowska A, Papouchado BG, Li Z, et al Increased hepatic and circulating interleukin‐6 levels in human nonalcoholic steatohepatitis. Am J Gastroenterol 2008; 103: 1372–1379. [DOI] [PubMed] [Google Scholar]
- 20. Zhou M, Li Z, Min R, et al Log (TG)/HDL‐C ratio as a predictor of decreased islet beta cell function in patients with type 2 diabetes: 6‐year cohort study. J Diabetes 2015; 7: 689–698 [DOI] [PubMed] [Google Scholar]
- 21. Bril F, Ortiz‐Lopez C, Lomonaco R, et al Clinical value of liver ultrasound for the diagnosis of nonalcoholic fatty liver disease in overweight and obese patients. Liver Int 2015; 35: 2139–2146. [DOI] [PubMed] [Google Scholar]
- 22. Mancini M, Prinster A, Annuzzi G, et al Sonographic hepatic‐renal ratio as indicator of hepatic steatosis: comparison with (1)H magnetic resonance spectroscopy. Metabolism 2009; 58: 1724–1730. [DOI] [PubMed] [Google Scholar]
- 23. Webb M, Yeshua H, Zelber‐Sagi S, et al Diagnostic value of a computerized hepatorenal index for sonographic quantification of liver steatosis. AJR Am J Roentgenol 2009; 192: 909–914. [DOI] [PubMed] [Google Scholar]
- 24. Zierer J, Kastenmuller G, Suhre K, et al Metabolomics profiling reveals novel markers for leukocyte telomere length. Aging (Albany NY) 2016; 8: 77–94. [DOI] [PMC free article] [PubMed] [Google Scholar]