

Abstract
We examined whether brachial‐ankle pulse wave velocity (baPWV) and ankle‐brachial pressure index (ABI) are predictors for mortality in diabetic patients after lower extremity amputation. This was an observational historical cohort study of 102 Japanese diabetic patients after first non‐traumatic lower extremity amputation, with a mean age of 63 years (standard deviation 12 years). The end‐point was all‐cause mortality. During the mean follow‐up period of 3.3 years, 44 patients reached the end‐point. In both univariate and multivariate analyses, baPWV (m/s) (hazard ratio [HR] 1.05 and 1.04, both P < 0.01, respectively), but not ABI (HR 0.38 and 0.89, P = 0.08 and 0.86, respectively), was a significant predictor for the end‐point. When baPWV (above or below the median [21.8 m/s]) and ABI (normal [0.9–1.4] or not) were analyzed as categorical variables, the results were similar. In conclusion, baPWV, but not ABI, might be a predictor for all‐cause mortality in diabetic patients after lower extremity amputation.
Keywords: Brachial‐ankle pulse wave velocity, Lower extremity amputation, Mortality
Introduction
Mortality among patients with diabetes after lower‐extremity amputation (LEA) remains extremely high1, 2; therefore, the identification of the prognostic factors is urgently required. Several studies have shown that brachial‐ankle pulse wave velocity (baPWV), a non‐invasive marker of arterial stiffness, as well as ankle‐brachial pressure index (ABI), a marker of stenosis or obstruction of peripheral arteries, predict mortality in patients with diabetes3, 4. However, there is no report of patients with diabetes after LEA regarding the association of the two aforementioned markers with the prognosis. Here, we aimed to examine whether baPWV and ABI are predictors of mortality in patients with diabetes after LEA.
Materials and Methods
Study design and participants
This was a single‐center, observational, historical cohort study of Japanese ambulatory patients with diabetes after first non‐traumatic LEA. The present study adhered to the Declaration of Helsinki, and was approved by the ethics committee of Tokyo Women's Medical University Hospital. This study used data from a clinical information system (electronic medical records). Amputation was defined as a complete loss in the transverse plane of any part of the lower limb. We identified 117 consecutive patients with diabetes after first LEA as a result of foot ulcers at the foot care unit in the Diabetes Center of Tokyo Women's Medical University Hospital in Tokyo, Japan, between January 2004 and June 2014. Patients with missing values for baseline profiles (n = 15) were excluded. Therefore, 102 patients were enrolled in this study. When each patient underwent lower limb amputation, baPWV, ABI and blood sample data were determined as the baseline data. Follow‐up data were collected until September 2014.
Measurements and study end‐point
baPWV and ABI were simultaneously measured using an automated device (form PWV/ABI; Omron Colin Co. Ltd, Komaki, Japan). These measurements were carried out with the patient in the supine position after at least 5 min rest. baPWV on each side was automatically calculated as the transmission distance between the brachium and ankle divided by the transit time of the pulse wave. ABI on each side was automatically calculated as the ratio of systolic blood pressure in the leg to that in the higher arm. The higher values of baPWV and the lower values of ABI for each individual were used for the analysis in the present study. Hemoglobin A1c values obtained as the Japan Diabetes Society values were converted to the National Glycohemoglobin Standardization Program values5. Glomerular filtration rate was estimated using the modified three‐variable equation, as proposed by the Japanese Society for Nephrology6. The end‐point in the present study was all‐cause mortality.
Statistical analysis
Hazard ratios were estimated using Cox proportional hazard model analysis. In the multivariate Cox proportional hazard model analysis, a stepwise variable‐selecting procedure was carried out, specifying the significant levels for entering another explanatory variable into the model as 0.05, and that for removing an explanatory variable from the model as 0.05, respectively. baPWV and ABI were incorporated into the model irrespective of P‐values. The covariates were the following: age, sex, systolic blood pressure, diastolic blood pressure, hemoglobin A1c, logarithmically transformed triglycerides, high‐density lipoprotein cholesterol, low‐density lipoprotein cholesterol, presence of kidney dysfunction defined as estimated glomerular filtration rate <60 mL/min/1.73 m2 or dialysis, history of cardiovascular disease, history of leg revascularization, use of 3‐hydroxy‐3‐methylglutaryl coenzyme A reductase inhibitors (statins), use of angiotensin‐converting enzyme inhibitors or angiotensin II receptor blockers and amputation levels (above the ankle or not). P‐values <0.05 were considered significant. All statistical analyses were carried out using sas version 9.4 (SAS Institute, Cary, NC, USA).
Results
Baseline demographic and clinical characteristics
Among the 102 patients, 53 had amputations below the ankle and 49 had amputations above the ankle. Baseline demographic and laboratory data of 102 participants are presented in Table 1. The median (range) values of baPWV (m/s) and ABI were 21.8 (6.3–57.5) and 0.88 (0.31–1.55), respectively. A total of 55 patients had an ABI of <0.9, and only one patient had ABI of >1.4.
Table 1.
Baseline demographic and laboratory data of 102 participants
| Age | 63 ± 12 years |
| Males | 80 (78.4) |
| Type 2 diabetes | 96 (94.1) |
| Duration of diabetes | 21 ± 11 years |
| BMI | 23.5 ± 4.2 kg/m2 |
| Systolic blood pressure | 138 ± 25 mmHg |
| Diastolic blood pressure | 74 ± 13 mmHg |
| Smoking (current or ever) | 62 (60.8) |
| History of cardiovascular disease | 60 (58.8) |
| History of leg revascularization | 37 (36.3) |
| Dialysis | 50 (49.0) |
| Use of HMG‐CoA reductase inhibitors (statins) | 34 (33.3) |
| Use of ACEIs or ARBs | 63 (61.8) |
| Laboratory data | |
| HbA1c | 7.8 ± 2.2 (%) |
| HbA1c | 61.3 ± 23.5 mmol/mol |
| Triglycerides | 1.1 mmol/L (1.0–1.2 mmol/L) |
| HDL cholesterol | 0.9 ± 0.3 mmol/L |
| LDL cholesterol | 2.2 ± 0.8 mmol/L |
| Creatinine (non‐dialysis patients) | 121.2 ± 104.2 μmol/L |
| eGFR (non‐dialysis patients) | 60.0 ± 37.2 mL/min/1.73 m2 |
Data are expressed as number (%), mean ± standard deviation, or geometric mean (95% confidence interval). ACEIs, angiotensin‐converting enzyme inhibitors; ARBs, angiotensin II receptor blockers; BMI, body mass index; eGFR, estimated glomerular filtration rate; HbA1c, hemoglobin A1c; HDL, high‐density lipoprotein; HMG‐CoA, 3‐hydroxy‐3‐methylglutaryl coenzyme A; LDL, low‐density lipoprotein; SD, standard deviation.
Association of BaPWV and ABI with the incidence of all‐cause mortality
During a mean follow‐up period of 3.3 years (standard deviation 2.8 years), 44 patients reached the end‐point. The cause of 44 deaths were as follows: myocardial infarction (n = 9), ischemic stroke (n = 3), sudden death (n = 9), infection (n = 15), cancer (n = 1), gastrointestinal bleeding (n = 1) and unknown etiology (n = 6). The survival rate for 1, 2 and 5 years was 84.9, 73.5 and 51.0%, respectively. A total of 11 patients were lost to follow up.
In both the uni‐ and multivariate analyses, baPWV values were a significant predictor for the end‐point; meanwhile, ABI was not associated with the end‐point (Table 2). Next, we carried out an analysis where baPWV (above or below the median [21.8 m/s]) and ABI (normal [0.9–1.4] or not) were treated as categorical variables, and similar results were obtained (Table 2). When baPWV and ABI, which were measured on the amputated or non‐amputated side for each individual, were used for analysis, the results did not change. Finally, we compared the incidence of the end‐point among four groups classified into baPWV (above or below the median) and ABI (normal or not). The analysis also showed that high baPWV, regardless of ABI, was a significant risk factor for the end‐point (Figure 1).
Table 2.
Univariate and multivariate Cox proportional hazard model to determine the association of brachial‐ankle pulse wave velocity and ankle‐brachial pressure index with all‐cause mortality
| Model 1 | Model 2 | Model 3 | ||||
|---|---|---|---|---|---|---|
| HR (95% CI) | P‐values | HR (95% CI) | P‐values | HR (95% CI) | P‐values | |
| (baPWV and ABI treated as continuous variables) | ||||||
| baPWV (m/s) | 1.05 (1.03–1.08) | <0.001 | 1.04 (1.01–1.07) | 0.005 | 1.04 (1.01–1.07) | 0.004 |
| ABI | 0.38 (0.13–1.13) | 0.081 | 0.67 (0.19–2.36) | 0.529 | 0.89 (0.25–3.15) | 0.855 |
| (baPWV and ABI treated as categorical variables) | ||||||
| High baPWV (vs low baPWV) | 5.88 (2.81–12.30) | <0.001 | 4.54 (2.13–9.67) | <0.001 | 4.55 (2.13–9.70) | <0.001 |
| Abnormal ABI (vs normal ABI) | 1.51 (0.82–2.79) | 0.184 | 0.92 (0.49–1.73) | 0.789 | 0.94 (0.50–1.77) | 0.847 |
The definition of brachial‐ankle pulse wave velocity (baPWV) and ankle‐brachial pressure index (ABI) as categorical variables were the following: baPWV: above or below the median (21.8 m/s), and ABI: normal (0.9–1.4) or not, respectively. Model 1: univariate model. Model 2: multivariate model. Model 3: multivariate model in which baPWV and ABI were simultaneously incorporated. In the multivariate model, a stepwise variable‐selecting procedure was carried out. baPWV and ABI were incorporated into the model irrespective of P‐values. The following variables were used as covariates: age, sex, systolic blood pressure, diastolic blood pressure, hemoglobin A1c, logarithmically transformed triglycerides levels, high‐density lipoprotein cholesterol, low‐density lipoprotein cholesterol, presence of kidney dysfunction defined as estimated glomerular filtration rate <60 mL/min/1.73 m2 or dialysis, history of cardiovascular disease, history of leg revascularization, use of 3‐hydroxy‐3‐methylglutaryl coenzyme A reductase inhibitors (statins), use of angiotensin‐converting enzyme inhibitors or angiotensin II receptor blockers, and amputation levels (above the ankle or not).
Figure 1.
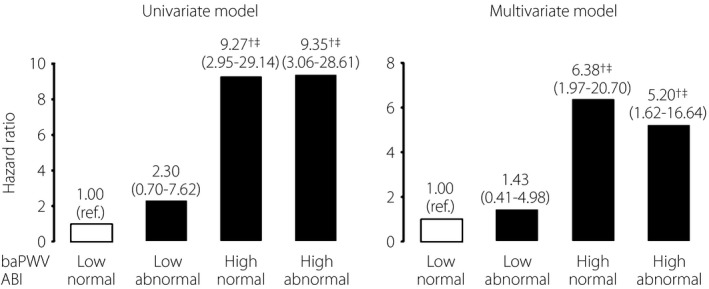
Comparison of all‐cause mortality among four groups classified into brachial‐ankle pulse wave velocity (baPWV; above or below the median [21.8 m/s]) and ankle‐brachial pressure index (ABI; normal [0.9−1.4] or not). † P < 0.01 versus patients with low baPWV and normal ABI, ‡ P < 0.01 versus patients with low baPWV and abnormal ABI. In the multivariate model, a stepwise variable‐selecting procedure was performed. baPWV and ABI were incorporated into the model irrespective of P‐values. The following variables were used as covariates: age, sex, systolic blood pressure, diastolic blood pressure, hemoglobin A1c, logarithmically transformed triglycerides levels, high‐density lipoprotein cholesterol, low‐density lipoprotein cholesterol, presence of kidney dysfunction defined as estimated glomerular filtration rate <60 mL/min/1.73 m2 or dialysis, history of cardiovascular disease, history of leg revascularization, use of 3‐hydroxy‐3‐methylglutaryl coenzyme A reductase inhibitors (statins), use of angiotensin‐converting enzyme inhibitors or angiotensin II receptor blockers, and amputation levels (above the ankle or not).
Discussion
In the present study of patients with diabetes after first non‐traumatic LEA, we found that baPWV, but not ABI, was independently associated with the incidence of all‐cause mortality. To our knowledge, this is the first report to examine the association of baPWV and ABI with mortality in patients with diabetes after LEA.
ABI is known to be a powerful prognostic predictor in various clinical settings7, 8, 9. However, in patients with diabetes, especially in those who had longer durations of diabetes and kidney complications, ABI values are likely to be unreliable because of false elevations or falsely normal values, caused by medial arterial calcification10, 11, 12. Participants in this cohort had long durations of diabetes (mean 21 years), and many cases had kidney dysfunction (Table 1); therefore, the unreliability of ABI values might explain these present results. Meanwhile, because of interference with circulation through lower extremities, baPWV, unlike aortic PWV such as carotid‐femoral PWV, tends to be underestimated in patients with peripheral artery disease13. A previous study of hemodialysis patients showed that baPWV was not associated with all‐cause mortality in the entire cohort; however, baPWV was the significant predictor in those with ABI of 0.9 or more14. In the present study, higher baPWV values were a significant risk factor for mortality, irrespective of ABI values (Figure 1, Table 2). As aforementioned, ABI values in the present cohort were considered to be highly questionable; therefore, the limitation of baPWV might be weakened. In any case, the present study suggests that baPWV is a better predictor for mortality than ABI in patients with diabetes after LEA.
The present study had several limitations. First, this study had a small sample size. Second, 11 patients were lost to follow up, which might add some bias to the analyses15. Finally, the present study was carried out in a single urban university hospital, which might not be representative of the entire Japanese population with diabetes.
In conclusion, the present study might provide evidence that baPWV is a useful clinical predictor for all‐cause mortality in patients with diabetes after first non‐traumatic LEA. This finding should be confirmed in prospective studies with a larger sample size and a multicenter design.
Disclosure
The authors declare no conflict of interest.
Acknowledgment
The authors received no financial support for this study.
J Diabetes Investig 2017; 8: 250–253
References
- 1. Faglia E, Favales F, Morabito A. New ulceration, new major amputation, and survival rates in diabetic subjects hospitalized for foot ulceration from 1990 to 1993: a 6.5‐year follow‐up. Diabetes Care 2001; 24: 78–83. [DOI] [PubMed] [Google Scholar]
- 2. Icks A, Scheer M, Morbach S, et al Time‐dependent impact of diabetes on mortality in patients after major lower extremity amputation: survival in a population‐based 5‐year cohort in Germany. Diabetes Care 2011; 34: 1350–1354. [DOI] [PMC free article] [PubMed] [Google Scholar]
- 3. Maeda Y, Inoguchi T, Etoh E, et al Brachial‐ankle pulse wave velocity predicts all‐cause mortality and cardiovascular events in patients with diabetes: the kyushu prevention study of atherosclerosis. Diabetes Care 2014; 37: 2383–2390. [DOI] [PubMed] [Google Scholar]
- 4. Natsuaki C, Inoguchi T, Maeda Y, et al Association of borderline ankle‐brachial index with mortality and the incidence of peripheral artery disease in diabetic patients. Atherosclerosis 2014; 234: 360–365. [DOI] [PubMed] [Google Scholar]
- 5. Kashiwagi A, Kasuga M, Araki E, et al International clinical harmonization of glycated hemoglobin in Japan: from Japan Diabetes Society to National Glycohemoglobin Standardization program values. J Diabetes Investig 2012; 3: 39–40. [DOI] [PMC free article] [PubMed] [Google Scholar]
- 6. Matsuo S, Imai E, Horio M, et al Revised equations for estimated GFR from serum creatinine in Japan. Am J Kid Dis 2009; 53: 982–992. [DOI] [PubMed] [Google Scholar]
- 7. Fowkes FG, Murray GD, Butcher I, et al Ankle brachial index combined with Framingham Risk Score to predict cardiovascular events and mortality: a meta‐analysis. JAMA 2008; 300: 197–208. [DOI] [PMC free article] [PubMed] [Google Scholar]
- 8. Ono K, Tsuchida A, Kawai H, et al Ankle‐Brachial blood pressure index predicts all‐cause and cardiovascular mortality in hemodialysis patients. J Am Soc Nephrol 2003; 14: 1591–1598. [DOI] [PubMed] [Google Scholar]
- 9. Newman AB, Sutton‐Tyrrell K, Vogt MT, et al Morbidity and mortality in hypertensive adults with a low ankle/arm blood pressure index. JAMA 1993; 270: 487–489. [PubMed] [Google Scholar]
- 10. Yoshimura T, Suzuki E, Ito I, et al Impaired peripheral circulation in lower‐leg arteries caused by higher arterial stiffness and greater vascular resistance associates with nephropathy in type 2 diabetic patients with normal ankle–brachial indices. Diabetes Res Clin Pract 2008; 80: 416–423. [DOI] [PubMed] [Google Scholar]
- 11. Takahara M, Fujiwara Y, Katakami N, et al Shared and additional risk factors for decrease of toe‐brachial index compared to ankle‐brachial index in Japanese patients with diabetes mellitus. Atherosclerosis 2014; 235: 76–80. [DOI] [PubMed] [Google Scholar]
- 12. Fukui M, Tanaka M, Hamaguchi M, et al Toe‐brachial index is associated more strongly with albuminuria or glomerular filtration rate than ankle‐brachial index in patients with type 2 diabetes. Hypertens Res 2012; 35: 745–749. [DOI] [PubMed] [Google Scholar]
- 13. Yokoyama H, Shoji T, Kimoto E, et al Pulse wave velocity in lower‐limb arteries among diabetic patients with peripheral arterial disease. J Atheroscler Thromb 2003; 10: 253–258. [DOI] [PubMed] [Google Scholar]
- 14. Kitahara T, Ono K, Tsuchida A, et al Impact of brachial‐ankle pulse wave velocity and ankle‐brachial blood pressure index on mortality in hemodialysis patients. Am J Kidney Dis 2005; 46: 688–696. [DOI] [PubMed] [Google Scholar]
- 15. Tripepi G, Jager KJ, Dekker FW, et al Selection bias and information bias in clinical research. Nephron Clin Pract 2010; 115: c94–c99. [DOI] [PubMed] [Google Scholar]