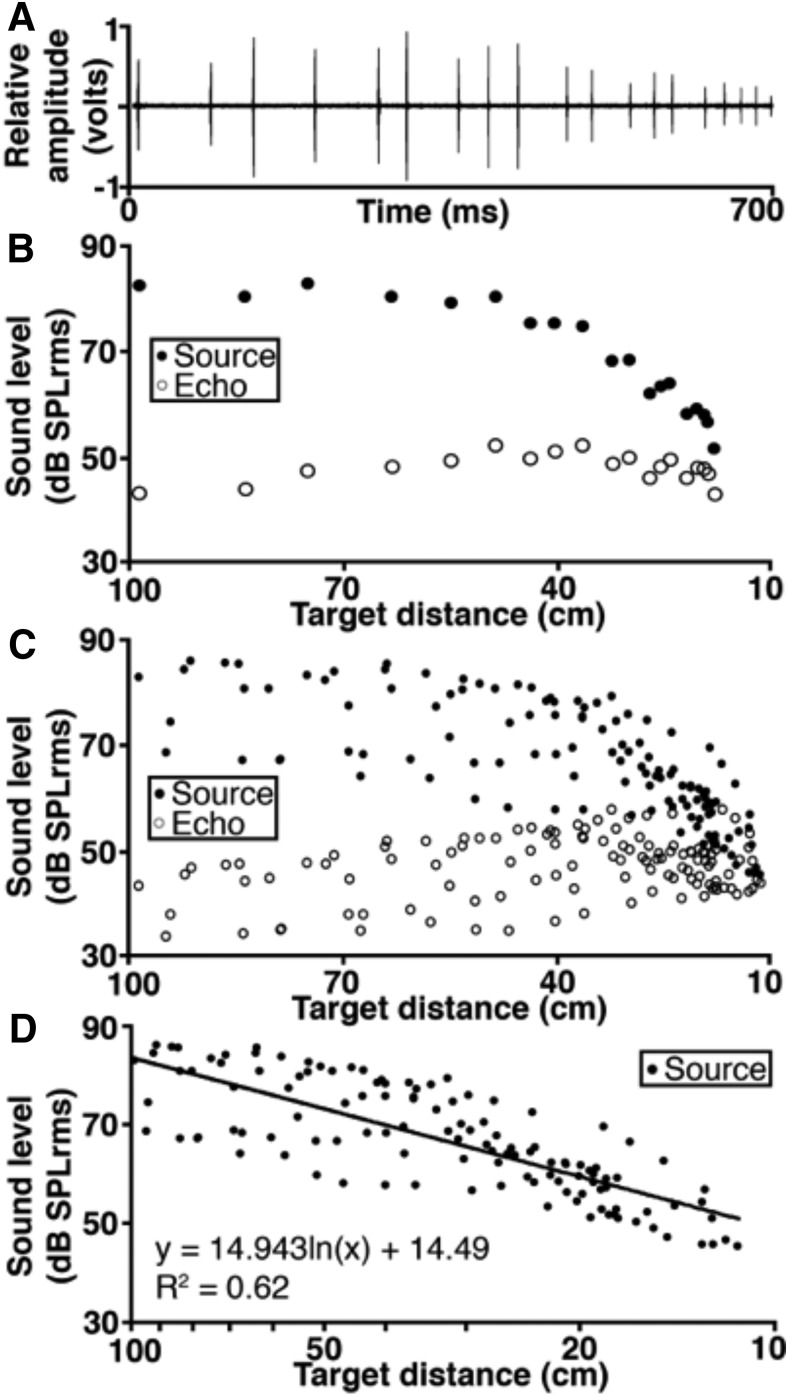
Figure 1.
The change in echolocation call levels over time during target approach. A, An oscillogram of call levels produced during a single approach by a pallid bat and recorded by the target microphone beginning at a distance of 100 cm. B, The change in source and echo levels during the same approach as panel A. C, The change in source and echo intensity during trials for three bats (seven total approaches). D, The change in source intensity over time for three bats (seven total approaches). The line represents the logarithmic regression. Source levels decreased on average by 10.4 dB SPLrms per halving of distance.

