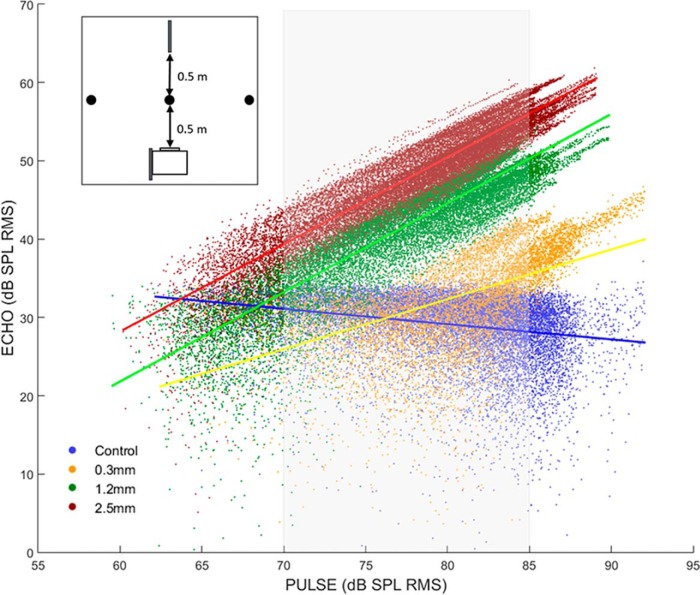
Figure 2.
Relationship between pulse and echo levels from ensonification of wires with pallid bat calls. The inset shows a schematic (top-down view) of the ensonification paradigm. A speaker (white rectangle) was used to produce pallid bat calls at various sound levels. The call (pulse) levels were measured with a microphone (thick black line) located 1 m away. Echoes produced by the wire (black circle) were measured with a second microphone (thick black line) located next to the speaker. The main graph shows the echo levels recorded from wires of three different diameters for a corresponding call (pulse) level. The gray shaded rectangle indicates the range of echolocation call levels measured from the bat in the landing task (Table 1).

