

Summary
The dry (nonneovascular) form of age‐related macular degeneration (AMD), a leading cause of blindness in the elderly, has few, if any, treatment options at present. It is characterized by early accumulation of cellular waste products in the retinal pigmented epithelium (RPE); rejuvenating impaired lysosome function in RPE is a well‐justified target for treatment. It is now clear that amino acids and vacuolar‐type H+‐ATPase (V‐ATPase) regulate the mechanistic target of rapamycin, complex 1 (mTORC1) signaling in lysosomes. Here, we provide evidence for the first time that the amino acid transporter SLC36A4/proton‐dependent amino acid transporter (PAT4) regulates the amino acid pool in the lysosomes of RPE. In Cryba1 (gene encoding βA3/A1‐crystallin) KO (knockout) mice, where PAT4 and amino acid levels are increased in the RPE, the transcription factors EB (TFEB) and E3 (TFE3) are retained in the cytoplasm, even after 24 h of fasting. Consequently, genes in the coordinated lysosomal expression and regulation (CLEAR) network are not activated, and lysosomal function remains low. As these mice age, expression of RPE65 and lecithin retinol acyltransferase (LRAT), two vital visual cycle proteins, decreases in the RPE. A defective visual cycle would possibly slow down the regeneration of new photoreceptor outer segments (POS). Further, photoreceptor degeneration also becomes obvious during aging, reminiscent of human dry AMD disease. Electron microscopy shows basal laminar deposits in Bruch's membrane, a hallmark of development of AMD. For dry AMD patients, targeting PAT4/V‐ATPase in the lysosomes of RPE cells may be an effective means of preventing or delaying disease progression.
Keywords: amino acid transporter (PAT4/SLC36A4), age‐related macular degeneration, coordinated lysosomal expression and regulation (CLEAR) network, lysosomes; mechanistic target of rapamycin, complex 1 (mTORC1), mouse model, retinal pigmented epithelium (RPE), photoreceptor degeneration, signal transduction, transcription factors EB (TFEB) and E3 (TFE3), visual cycle proteins
Introduction
Crystallins are highly abundant proteins of the lens, essential for maintaining its transparency and refractivity. In addition to their roles as structural elements in the lens, crystallins may also have diverse functions in other parts of the eye (Horwitz, 2003; Piatigorsky, 2008; Zigler & Sinha, 2015). βA3/A1‐crystallin, a member of the β‐crystallin subfamily encoded by the Cryba1 gene, is also expressed in retinal pigmented epithelial (RPE) cells and astrocytes (Parthasarathy et al., 2011).
We have demonstrated that βA3/A1‐crystallin in the RPE is localized to the lysosomal lumen, where it regulates endolysosomal acidification by modulating V‐ATPase, thereby affecting lysosomal clearance by both phagocytosis and autophagy (Zigler et al., 2011; Valapala et al., 2014a,b). We have shown that βA3/A1‐crystallin binds to ATP6V0A1/V0‐ATPase and is involved in the mechanistic target of rapamycin, complex 1 (mTORC1) signaling pathway in RPE cells. Loss of βA3/A1‐crystallin results in decreased V‐ATPase activity, elevated lysosomal pH, activation of mTORC1, and inhibition of autophagy (Valapala et al., 2014a).
It is now recognized that an interplay between V‐ATPase and amino acids is essential in regulation of mTORC1 signaling (Zoncu et al., 2011). The proton‐assisted amino acid transporter (PAT)/solute‐linked carrier 36 (SLC36) family members regulate intracellular amino acid concentrations and mTORC1 signaling in lysosomes (Taylor, 2014). Recently, SLC38A9 (solute carrier family 38, member 9) was identified as an amino acid sensor that activates mTORC1 activity by interacting with the Ragulator‐Rag GTPase scaffolding complex in lysosomes (Rebsamen et al., 2015; Wang et al., 2015). Here, we show for the first time that PAT4/SLC36A4, a member of the PAT/SLC36 family, is expressed in RPE cells and is involved in the lysosomal dysfunction caused by loss of βA3/A1‐crystallin. PAT4 can mediate the amino acid‐sensing mechanism that regulates mTORC1 activation inside the cell (Heublein et al., 2010). It has been shown that Rab12 promotes constitutive degradation of PAT4 (Matsui & Fukuda, 2013). The accumulation of PAT4 in Rab12 knockdown cells increased mTORC1 activity and decreased autophagy.
mTORC1 signaling modulates lysosomal homeostasis (Laplante & Sabatini, 2013). As the RPE maintains the health of photoreceptors, preserving its normal clearance functions is essential to insure functional integrity of the neural retina (Strauss, 2005). Impaired lysosome‐mediated clearance results in toxic accumulation of undegraded waste products within the RPE, severely stressing these cells (Sinha et al., 2016). Further, the accumulated toxic material may be released by the RPE, thereby generating subretinal drusenoid deposits and drusen (deposits in Bruch's membrane), two signs indicative of development of dry age‐related macular degeneration (AMD), a major cause of vision loss in the elderly (Sivaprasad et al., 2016). With the human lifespan increasing, the management of aging‐related diseases becomes more important. There currently is no definitive treatment or prevention for dry AMD (Buschini et al., 2015). A new treatment that targets early dry AMD before significant vision loss would have great benefit for these patients.
We have now generated a global knockout mouse for Cryba1. These mice have pathological changes in the retina, mimicking some characteristics of dry AMD. Using this model, we provide novel evidence that the βA3/A1‐crystallin/PAT4/V‐ATPase complex is a potential therapeutic target for preventing or delaying the progression of dry AMD.
Results
βA3/A1‐crystallin interacts with PAT4, and loss of βA3/A1‐crystallin elevates cellular amino acid concentration in RPE cells and induces the mTORC1 pathway
We recently performed a human proteome high‐throughput array (CDI Laboratories, Inc.) and found that βA3/A1‐crystallin interacts with PAT4/SLC36A4, an amino acid transporter (Supplementary Table 1). The PAT4/SLC36A4 family of amino acid transporters is known to regulate intracellular amino acid concentrations and mTORC1 activity in lysosomes. Here, we show that in a pull‐down assay, βA3/A1‐crystallin binds to PAT4 in RPE cells from two‐month‐old Cryba1 fl/fl mice. Such binding did not occur in cells from Cryba1 KO mice (Fig. 1A). Further, PAT4 RNA (from primary RPE cells in culture) and protein (RPE from tissue) levels were determined by quantitative PCR (QPCR) and western blot, respectively, in RPE of Cryba1 fl/fl and Cryba1 KO mice after fasting. In Cryba1 fl/fl (control) mice, PAT4 RNA, as well as protein levels, were downregulated in RPE following 24‐h fasting (Fig. 1B–D). However, in Cryba1 KO mice, both PAT4 RNA and protein expression increased in the RPE after 24‐h fasting (Fig. 1B–D). Cryba1 KO mice appear to have a lower basal level of PAT4 expression compared with control mice. PAT4 has previously been shown to regulate amino acid sensing inside cells (Matsui & Fukuda, 2013). Interestingly, our data indicate that the concentration of free L‐amino acids after 24 h of fasting is significantly elevated in RPE cells of Cryba1 KO mice relative to fed controls. This increase is not seen in cells from Cryba1 fl/fl following fasting (Fig. 1E).
Figure 1.
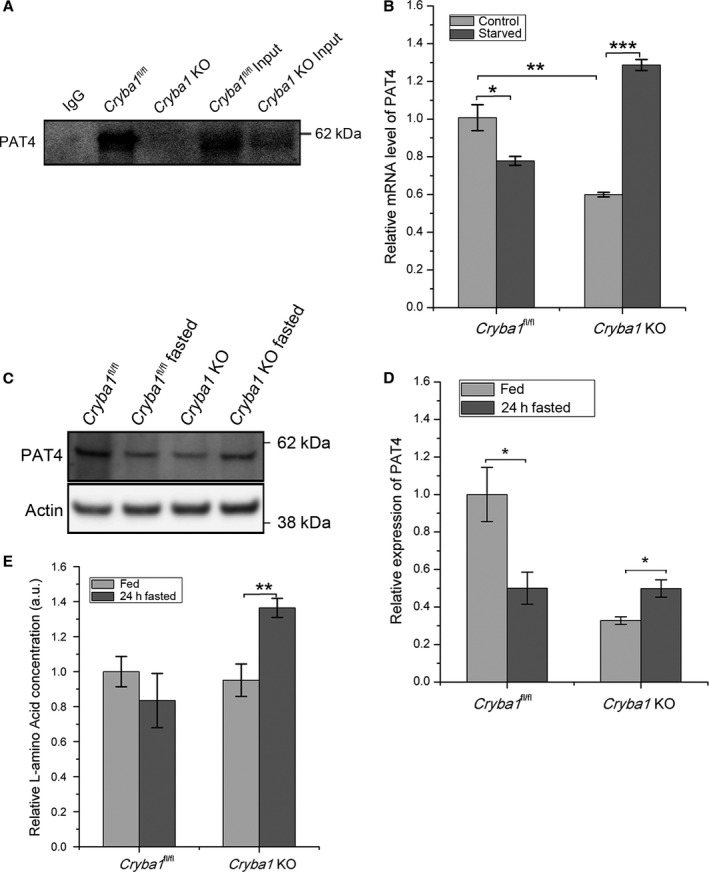
PAT4, interacting with βA3/A1‐crystallin, may modulate the mTORC1 signaling pathway by elevating cellular amino acid concentration. (A) Pull‐down assay using antibody to βA3/A1‐crystallin demonstrates that PAT4 and βA3/A1‐crystallin interact in RPE lysates from two‐month‐old Cryba1 fl/fl mice, but not in lysates from Cryba1 KO mice. (B) qPCR analysis of PAT4 transcript showing lower basal levels in Cryba1 KO primary RPE cells relative to floxed control samples. Upon serum starvation, the level decreases in RPE cells from floxed mice, but markedly increases in KO cells. (n = 4) (C) Western blot showing corresponding protein levels for PAT4 in RPE (n = 3). Quantification of data in C is shown in D. (E) Total L‐amino acids increase in RPE of Cryba1 KO mice after 24‐h fasting in vivo. No such increase is found in Cryba1 fl/fl mice following fasting (n = 8). Actin was used as internal control in all blots. All data expressed as mean ± SEM. *P < 0.05, **P < 0.01, ***P < 0.01.
It is known that when the cellular environment is amino acid rich, mTORC1 is activated. When Cryba1 fl/fl mice were fasted for 24 h, we found that phosphorylated mTORC1 (Ser2448) and phosphorylated p70S6K (T421/S424) levels decreased in RPE cells, as compared to fed mice. However, phosphorylated mTORC1 (Ser2448) and phosphorylated p70S6K (T421/S424) were observed at consistently higher levels in cells from Cryba1 KO mice, even after fasting, suggesting activation of mTORC1 (Fig. 2A–C).
Figure 2.
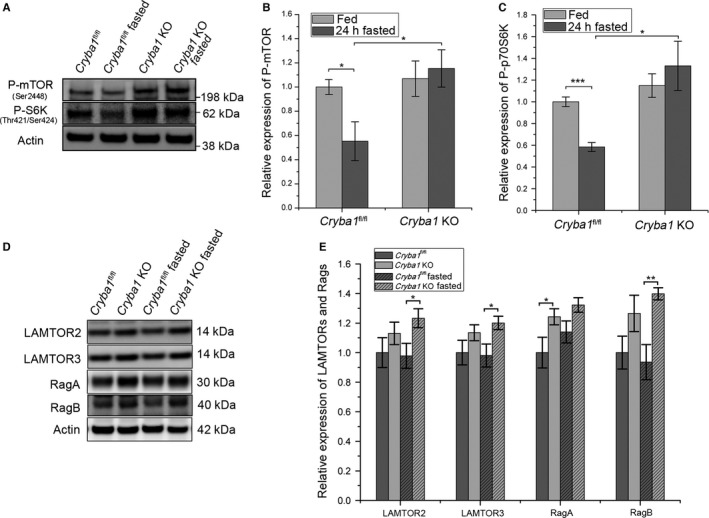
Increased mTORC1 signaling intermediates and persistent activation of mTORC1 signaling pathway in RPE of Cryba1 KO mice even after fasting. (A) Representative western blot of p‐mTOR (Ser2448) and p70S6K (Thr421/Ser424) in RPE lysates from fed and 24‐h‐fasted Cryba1 fl/fl or Cryba1 KO mice (n = 4). (B) and (C) show densitometric quantification for p‐mTOR and p‐70S6K, respectively. (D) Representative western blots for LAMTOR2, LAMTOR3, RagA, and RagB expression and (E) densitometric quantification of the western blot data for RPE lysates from fed and 24‐h‐fasted Cryba1 fl/fl or Cryba1 KO mice (n = 5). Actin was used as internal control in all blots. Values were normalized to that of fed Cryba1 fl/fl samples which relative expression was as 1. All data are expressed as mean ± SEM. *P < 0.05, **P < 0.01.
It is also true that amino acid‐sensing interactions are required for proper nucleotide loading of the Rag GTPases, recruitment of mTORC1 to the lysosome, and the subsequent activation of mTORC1 (Zoncu et al., 2011). The Rag GTPases reside on the lysosome and modulate amino acid import. They exist as obligate heterodimers (RagA or RagB with RagC or RagD) and interact with Ragulator (LAMTOR1‐5). The Ragulator‐Rag multiprotein complex is a critical component in the shuttling of mTORC1 to late endosomes/lysosomes. The protein levels of Ragulator and Rag GTPases, as indicated by western analysis of the mTORC1 signaling intermediates (LAMTOR2, LAMTOR3, RagA, and RagB), were higher in Cryba1 KO mice than in floxed control mice, but only RagA was statistically significantly higher (Fig. 2D,E). After 24 h of fasting, the levels of LAMTOR2, LAMTOR3, and RagB were statistically significantly higher in cells from KO mice relative to floxed controls.
Loss of βA3/A1‐crystallin in RPE cells affects TFEB/TFE3 phosphorylation as well as expression of CLEAR network genes
mTORC1 modulates the stress‐induced transcription factor EB (TFEB) to regulate a group of genes known as the coordinated lysosomal expression and regulation (CLEAR) network, which maintain normal lysosomal function. Amino acids can regulate TFEB through mTORC1. TFEB, when phosphorylated by mTORC1, is retained in the cytoplasm; when not phosphorylated, it translocates to the nucleus and activates CLEAR genes, thereby stimulating lysosomal biogenesis and function (Settembre et al., 2012; Martina et al., 2012; Roczniak‐Ferguson et al., 2012). Our data suggest that even when autophagy is induced in the RPE by fasting in vivo, the absence of βA3/A1‐crystallin causes TFEB to remain in the cytosol, thereby preventing activation of CLEAR genes (Fig. 3A,B). Under normal physiological conditions, western analyses detected TFEB in both the cytoplasm and nucleus of RPE cells of Cryba1 fl/fl mice, with an increased proportion in the nucleus after fasting (Fig. 3A). In Cryba1 KO mouse RPE, TFEB was predominantly cytoplasmic, with no indication of movement into the nucleus after fasting (Fig. 3A). Quantitative real‐time PCR showed that expression levels of lysosomal genes in the CLEAR network were significantly lower in RPE of Cryba1 KO mice than in controls (Fig. 3B). TFE3, similar to TFEB, is also involved in nutrient sensing and maintenance of cellular homeostasis. TFE3 accumulates in the nucleus upon nutrient deprivation, but is retained in the cytosol when phosphorylated by mTORC1 (Martina et al., 2014). In Cryba1 fl/fl control mice, phosphorylated TFE3 decreased in RPE after 24‐h fasting, indicating the accumulation of TFE3 in the nucleus. In contrast, the level of phosphorylated TFE3 was not reduced in the RPE of fasted Cryba1 KO mice like Cryba1 fl/fl control mice, even though the phosphorylated TFE3 level in RPE of KO mice is much lower than that in RPE of control mice (Fig. 3C,D).
Figure 3.
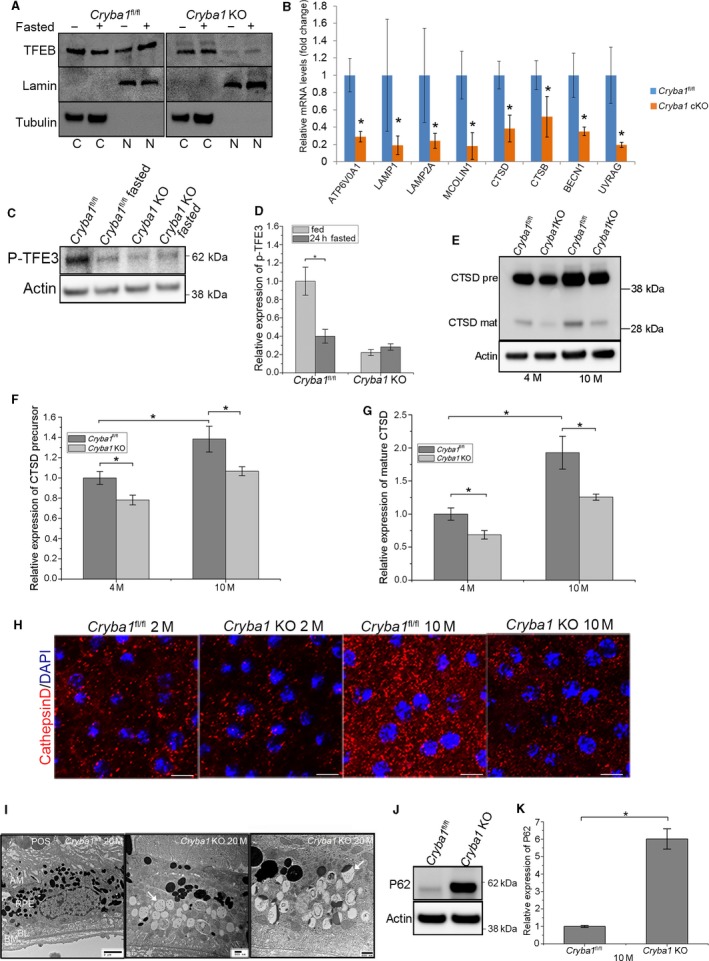
Predominantly cytosolic TFEB and abnormal levels of phosphorylated TFE3 in RPE cells from fasted and fed Cryba1 KO mice. (A) Western blot showing increased levels of TFEB in Cryba1 fl/fl nuclear extracts following fasting. TFEB is predominantly localized in the cytosol (C) in cells from normally fed Cryba1 fl/fl (control) mice, but after fasting the nuclear (N) proportion increases. In cells from Cryba1 KO mice, significantly lower nuclear levels of TFEB were observed in both fasted and fed conditions. (B) Cryba1 fl/fl and Cryba1 KO cells were subjected to qPCR analysis using Taqman probes for some CLEAR (coordinated lysosomal expression and regulation) genes after fasting. Cryba1 KO cells showed a reduction in the transcript levels for lysosomal hydrolases: CTSD (55%), CTSB (75%); lysosomal acidification: ATP6V0A1 (56%); lysosomal membrane proteins: LAMP1 (15%), LAMP2 (40%), and MCOLIN1 (35%); and gene related to autophagy: BECN1 (51%), UVRAG (35%). The graph shows mean ± SD from triplicate experiments, representative of at least three independent experiments. (two‐tailed t‐test) (C) Western blot for p‐TFE3 in RPE isolated from Cryba1 fl/fl and Cryba1 KO mice. The data indicate decreased p‐TFE3 in controls, but increased p‐TFE3 in KO RPE after fasting. (n = 4) Quantification of C is shown in D. (E) Western blot showing cathepsin D (both precursor and immature forms) expression in the RPE from four‐month‐old (n = 6) and 10‐month‐old (n = 3) Cryba1 KO mice vs. floxed controls. F and G show densitometric quantification for data in E. (H) CTSD immunostaining (red) and DAPI staining (blue) on RPE flat mounts from Cryba1 fl/fl and Cryba1 KO mice at 2 and 10 months of age (n = 3). There are fewer fluorescent puncta in Cryba1 KO RPE cells, than in Cryba1 fl/fl RPE at both ages. Scale bars=10 μm. (I) TEM of RPE in 20‐month‐old Cryba1 fl/fl mouse showing photoreceptor outer segments (POS) and RPE (left panel). Unlike Cryba1 KO mouse, TEM (center panel) showed numerous vacuoles with possible accumulation of lipid‐like droplets (arrow). TEM also showed many autolysosomes, some with incomplete degradation (arrow) retained in 20‐month‐old Cryba1 KO mouse (right panel). (J) Western blot and quantification (K) of protein level of SQSTM1 (p62) in RPE of 10‐month‐old Cryba1 KO mice relative to control mice. (n = 3) *P < 0.05, **P < 0.01.
We further investigated the expression of cathepsin D (CTSD), a CLEAR network gene with significantly decreased expression in Cryba1 KO RPE relative to control. Interestingly, while CTSD expression increased significantly with age in RPE cells from Cryba1 fl/fl mice (Fig. 3E,F,G), in Cryba1 KO cells, the overall CTSD expression level was lower at both ages relative to controls (Fig. 3E,F,G). Further, CTSD immunolabeling suggests that the capacity of intracellular degradation in the RPE of Cryba1 KO mice is considerably less than in control mice (Fig. 3H). Our transmission electron microscopy (TEM) data from 20‐month‐old KO mice show accumulation of undegraded material in the RPE (Fig. 3I) as compared to control. Numerous lipidated vacuoles (Fig. 3I, middle and right panels) and, most importantly, greater accumulation of autolysosomes (Fig. 3I, right panel) result from impaired lysosome‐mediated degradation and recycling. We also found that levels of p62, a receptor for cargo destined to be degraded by autophagy, were higher in 10‐month‐old Cryba1 KO RPE cells than in controls (Fig. 3J,K).
Cryba1 deprivation leads to age‐dependent defects in architecture of RPE cells
We next asked whether molecular dysregulation of normal lysosomal function in Cryba1 KO RPE cells has an effect on RPE structure and, most importantly, whether waste products accumulate in the Cryba1 KO RPE cells. We observed abnormalities in the cellular architecture of Cryba1 KO RPE by TEM (Fig. 4). Large vacuoles, not seen in Cryba1 fl/fl cells (Fig. 4C), and increased numbers of melanosomes (Fig. 4B) were observed in RPE cells from two‐month‐old Cryba1 knockout mice, as compared to controls (Fig. 4A). These abnormalities became more severe as the animals aged. Cellular debris enclosed in vacuoles was not efficiently digested (Fig. 4E). In some areas, the Cryba1 KO RPE cells began to lose basal infoldings and showed intracytoplasmic disruption (Fig. 4F). Such abnormalities were not seen in floxed controls (Fig. 4D). In Cryba1 KO animals, melanosomes were sometimes found to move from RPE cells into the photoreceptor out segments (POS). Large basal laminar deposits could be seen in Cryba1 KO RPE (Fig. 4G–I) and were also found above Bruch's membrane (Fig. 4F).
Figure 4.
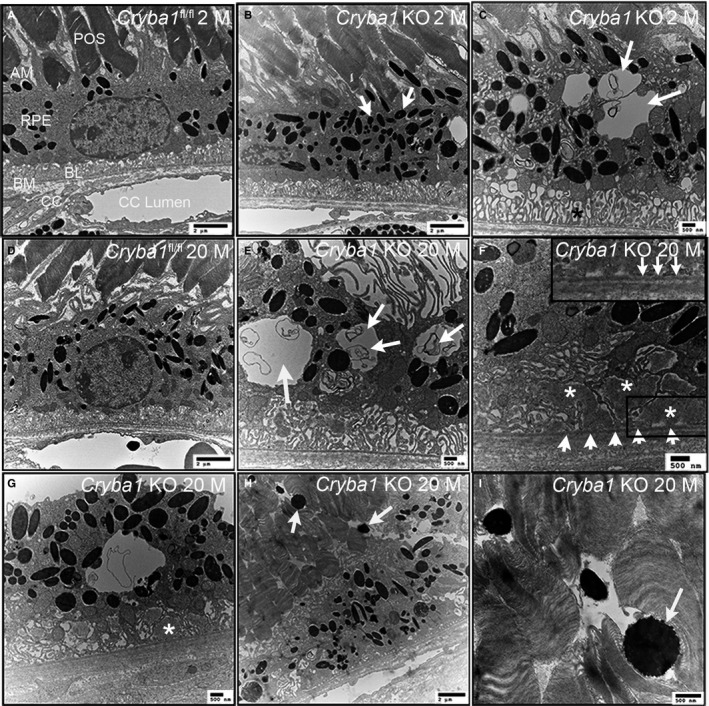
Ultrastructure of RPE in two‐month‐old and 20‐month‐old Cryba1 knockout mice and age‐matched Cryba1 fl/fl mice by transmission electron microscopy. POS (photoreceptor outer segment), AM (apical microvilli), BL (basal lamina), BM (Bruch's membrane), CC (choriocapillaris). (A) RPE of a two‐month‐old Cryba1 fl/fl mouse showing normal phenotype. (B) RPE of a two‐month‐old Cryba1 KO mouse showing increased melanosomes (arrows). (C) Vacuoles appear in RPE of two‐month‐old KO mice (arrows). (D) RPE of a 20‐month‐old Cryba1 fl/fl mouse. (E) RPE of a 20‐month‐old Cryba1 KO mice with much bigger vacuoles containing undigested cellular debris (arrows) and highly disrupted basal infoldings. (F, G) Asterisks indicate basal laminar deposits in KO RPE cells. Arrow heads in F indicate a layer of possible basal laminar deposit between Bruch's membrane and RPE. Inset in F is magnified area in the lower right frame of F, showing a thin part of Bruch's membrane. (H, I) Melanosomes (arrows) from 20‐month‐old KO RPE move into the POS layer.
The visual cycle is impaired in aging Cryba1 knockout mice
One of the critical functions of RPE cells is the recycling of retinoids that are essential for the visual cycle. RPE65 and lecithin retinol acyltransferase (LRAT) are key enzymes in converting all‐trans‐retinal to 11‐cis‐retinal (Redmond et al., 1998; Jin et al., 2007). RPE flat mounts from Cryba1 fl/fl and Cryba1 KO mice were stained with the high‐affinity filamentous actin probe, phalloidin, and with RPE65 antibody. Phalloidin staining demonstrated differences in both the size and shape of RPE cells in Cryba1 KO mice (Fig. 5A). A large number of RPE cells in Cryba1 KO mice gradually lose their regular hexagonal shape (arrow heads) and exhibit reduced staining for RPE65 (arrows) as they age (Fig. 5A). Both RPE flat mounts and western blots showed a gradual loss of RPE65 in Cryba1 KO mice as a function of aging. LRAT was also reduced in the Cryba1 KO mice by 9 months of age compared with age‐matched Cryba1 fl/fl mice (Fig. 5B,C).
Figure 5.
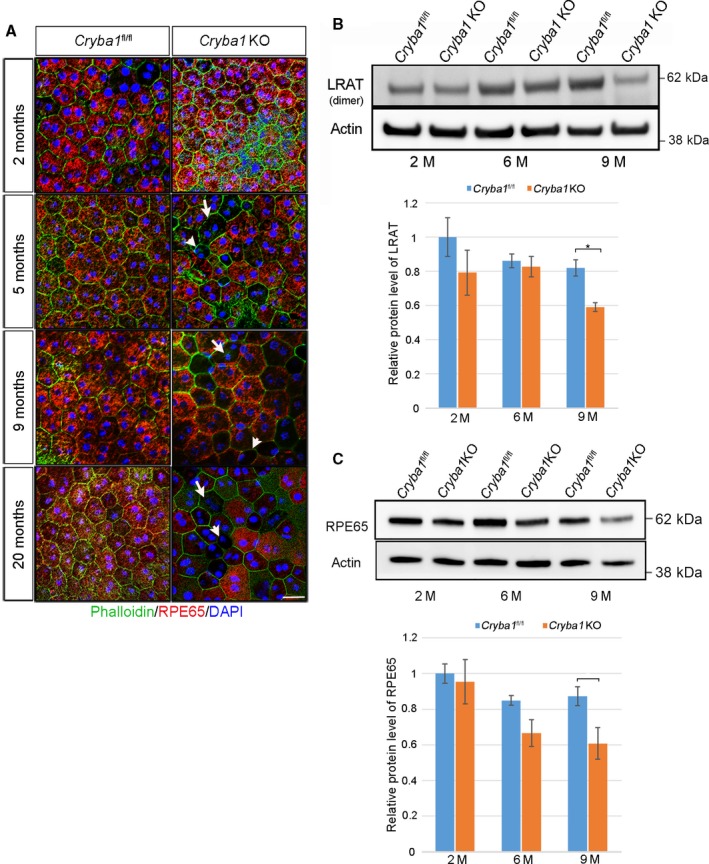
Impaired visual cycle in Cryba1 KO mice. (A) RPE65 (retinal pigment epithelium‐specific 65 kDa protein, red) and phalloidin (green) immunofluorescent staining of Cryba1 fl/fl and Cryba1 KO mice RPE flat mounts. With increasing age, RPE cells in Cryba1 KO mice gradually lose their regular hexagonal shape (arrow heads and have less RPE65 (arrows). Scale bar = 20 μm. (B, C) Western blots and densitometric quantification show that as Cryba1 KO mice age, there is significant loss of RPE65 and LRAT (Lecithin retinol acetyltransferase) in Cryba1 KO mice by 9 months.
Photoreceptor OS dysfunction due to abnormal lysosomal‐mediated clearance of RPE cells from Cryba1 KO mice
Several elegant studies have suggested that a symbiotic relationship between photoreceptors and RPE cells is necessary for maintaining the proper health of the neural retina (Sparrow et al., 2010). As the normal functioning of the RPE is compromised in Cryba1 KO mice, we evaluated their POS. Immunofluorescence studies for rhodopsin show stronger staining in Cryba1 KO retinas in cryosections from 20‐month‐old mice compared with those of Cryba1 fl/fl, but the staining was more diffuse (first panel in Fig. 6A). These data are consistent with staining caused by shed photoreceptor OS, which were not engulfed by RPE cells, but accumulated between the photoreceptors and the RPE. This was confirmed by TEM and 1D4 (POS marker) staining (Fig. 6B). M‐opsin and peanut agglutinin lectin (PNAL), cone photoreceptor markers, were almost undetectable in some regions of the Cryba1 KO retina (middle two panels in Fig. 6A). Furthermore, the thickness of the outer nuclear layer was significantly reduced in the regions with loss of M‐opsin and PNAL (bottom panel in Fig. 6A), indicating degeneration of photoreceptors in 20‐month‐old Cryba1 KO mice. TEM also showed degenerating POS in Cryba1 KO compared with floxed controls.
Figure 6.
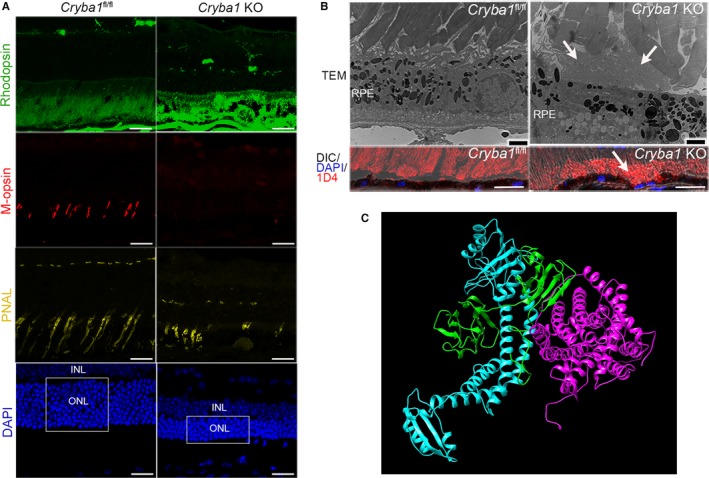
Photoreceptor outer segment dysfunction due to abnormal lysosomal‐mediated clearance of RPE cells from Cryba1 KO mice. (A) antibodies to rhodopsin (labels rod photoreceptors—green), M‐opsin (labels cones—red), and DAPI (labels nuclei—blue) were used to stain retinal cross sections. Representative data of immunofluorescent staining of photoreceptors: rhodopsin, M‐opsin, peanut agglutinin lectin (PNAL) in 20‐month‐old Cryba1 KO and age‐matched Cryba1 fl/fl retina. DAPI staining showed the number of nuclei and the thickness of outer nuclear layer. ONL (outer nuclear layer), INL (inner nuclear layer), scale bar = 20 μm. (n = 2) (B) Transmission electron microscopy (scale bar = 2 μm) and 1D4 (a marker for shed outer segments) immunostaining (scale bar = 20 μm) showing accumulation of photoreceptor outer segment tips in the subretinal layer in 20‐month‐old Cryba1 KO mice (arrows), but not in the age‐matched Cryba1 fl/fl mice. (C) Three‐dimensional modeling is shown, depicting structures of PAT‐4 (magenta), βA3‐crystallin (green), and V‐ATPase (Cyan) forming a complex, obtained by Hex Protein Docking.
Discussion
Many age‐related diseases, including dry AMD, severely impair quality of life in the elderly. We and others have postulated that abnormal lysosome function in RPE cells could ultimately contribute to dry AMD (Guha et al., 2014; Sinha et al., 2016). In fact, the efficiency of lysosomes in degrading cellular components declines over time, an effect linked both to aging and the development of age‐related diseases (Cuervo & Dice, 2000). Therefore, we have generated unique mouse models to evaluate defective lysosomal degradative function in the RPE and its possible role in AMD.
RPE cells are postmitotic, have high metabolic activity, and are among the most active phagocytic cells in the body (Strauss, 2005). For efficient cellular clearance in the RPE, normal lysosome function through both phagocytosis and autophagy is key (Boya & Codogno, 2013). Lysosomes are no longer regarded as simply a heterogeneous collection of degradative organelles, but also as a platform for signaling pathways (Puertollano, 2014). Our previous work confirmed that βA3/A1‐crystallin regulates mTORC1 signaling, possibly by modulating the assembly/disassembly of the proton pump, V‐ATPase (Valapala et al., 2014a). mTORC1 is a platform for a major signaling axis within lysosomes that supports normal lysosomal function and thus cellular homeostasis (Settembre et al., 2013).
It is now clear that amino acids and V‐ATPase are absolutely essential for mTORC1 signaling. Two ubiquitously expressed members of the PAT family, PAT1/SLC36A1 and PAT4/SLC36A4, have been shown to affect mTORC1 activity (Heublein et al., 2010; Matsui & Fukuda, 2013; Fan et al., 2016; Goberdhan et al., 2016). We made the unexpected observation that βA3/A1‐crystallin binds to PAT4. This is the first report showing PAT4 expression in the eye. It is known that when the cellular environment is amino acid rich, mTORC1 is active and inhibits autophagy. Our data provide evidence that when βA3/A1‐crystallin is lacking, fasting upregulates PAT4, cellular amino acid levels increase and mTORC1 is activated. Moreover, Rag GTPases, supported by the Ragulator complex (Bar‐Peled et al., 2012), modulate amino acid import by lysosomes. Our data clearly show abnormal regulation of Rag GTPases and mTORC1 activity after fasting in Cryba1 KO RPE cells.
Alternatively, amino acid sensing might occur by an ‘inside‐out’ mechanism with direct coupling between intralysosomal amino acids and activation of mTORC1 leading to subsequent conformational change in the lysosomal V‐ATPase (Zoncu et al., 2011). A direct interaction between V‐ATPase and the Rag GEF (guanine nucleotide‐exchange factor) complex was observed. Interestingly, amino acids weaken the interaction between Ragulator and the V‐ATPase V1 domain, but have no effect on the interaction with the V0 domain. These amino acid‐sensitive interactions were shown to be essential for proper nucleotide loading of the Rag GTPases, recruitment of mTORC1 to the lysosome, and subsequent activation of mTORC1 (Zoncu et al., 2011). However, we have previously shown (Valapala et al., 2014a) that βA3/A1‐crystallin binds only to the V‐ATPase V0 domain, which is responsible for carrying out proton translocation to the endolysosomal compartments and is critical for pH‐dependent processes (Forgac, 2007; Breton & Brown, 2013). It is highly likely that βA3/A1‐crystallin is an upstream regulator of both V‐ATPase and PAT4 and is essential for mTORC1 signaling in RPE cells.
The cellular demand for amino acids is cell and tissue specific. In fact, a direct role for amino acids in mTOR signaling is supported by the well‐documented observation that treatment of cells with protein translation inhibitors (such as cycloheximide), which contribute to increased intracellular concentration of amino acids, can activate mTORC1 and inhibit autophagy even under nutrient deprivation (Beugnet et al., 2003; Watanabe‐Asano et al., 2014). This is reminiscent of the situation in our Cryba1 KO mice, suggesting that for normal mTORC1 signaling and thereby maintenance of lysosomal homeostasis in RPE cells, it is important to have a functional βA3/A1‐crystallin‐PAT4‐V‐ATPase complex.
Amino acids also control lysosomal homeostasis through the regulation of TFEB. TFEB localization and inactivation in lysosomes are dependent upon the activation of Rag GTPases and mTORC1 (Martina et al., 2012; Settembre et al., 2012; Martina & Puertollano, 2013). TFEB binds to the cytosolic chaperone protein 14‐3‐3 when phosphorylated and is retained in the cytoplasm; when not phosphorylated, it translocates to the nucleus and activates CLEAR genes (Settembre et al., 2011; Martina et al., 2012; Roczniak‐Ferguson et al., 2012). Cells adapt to diminished amino acid levels by increasing the lysosomal and autophagic compartments in order to maintain a critical level of metabolites. In Cryba1 KO RPE cells, the amino acid levels are high, and TFEB is retained in the cytoplasm, even after fasting. In contrast, in RPE cells from control Cryba1 fl/fl mice, TFEB translocates to the nucleus and activates CLEAR genes after fasting.
Cathepsin D (CTSD), a CLEAR network gene product involved in phagocytic and autophagic degradation in the RPE (Rakoczy et al., 1997; Valapala et al., 2014a), is significantly decreased in Cryba1 KO RPE, relative to control. Previously, we found that the absence of βA3/A1‐crystallin decreased CTSD activity in both astrocytes and RPE cells; however, overexpression of βA3/A1‐crystallin in the KO cells restored normal activity (Valapala et al., 2013, 2014a). We also found that p62, a receptor for cargo destined to be degraded by autophagy, was higher in 10‐month‐old Cryba1 KO RPE cells than in controls; this difference was not found in younger mice. p62 contributes to both amino acid sensing and the regulation of autophagy. It has been shown that p62 is required for maximal mTORC1 activity in response to amino acids. p62 is postulated to promote recruitment of mTORC1 to lysosomes via its interaction with raptor (Duran et al., 2011). Taken together, our data indicate that normal lysosomal function is significantly perturbed in Cryba1 KO RPE cells.
Interestingly, Spatacsin KO mice, which progressively lose cortical motor neurons and Purkinje cells, also have defective lysosomal function (Varga et al., 2015). Spatacsin is essential for the reformation of lysosomes from autolysosomes in vivo. The loss of lysosomes in these mice preceded neuronal degeneration, a situation analogous to the AMD‐like phenotype in the Cryba1 KO mouse. In Cryba1 KO mice, the RPE also loses expression of two vital visual cycle proteins, RPE65 and LRAT. A defective visual cycle would slow down the regeneration of new POS. As these mice age, photoreceptor degeneration also becomes obvious, reminiscent of human dry AMD disease.
Here, we provide a direct link between amino acid availability and mTORC1 signaling during aging in our mouse model. If lysosome‐mediated clearance is perturbed during aging, it could have important implications for age‐related disorders, such as AMD. The ability to sense and appropriately respond to cellular stresses, such as amino acid depletion, is commonly diminished during aging. This could have direct consequences for the onset and progression of aging‐related diseases. For AMD patients, targeting the βA3/A1‐crystallin/PAT4/V‐ATPase complex (Fig. 6C) in the RPE may be an effective means of preventing or delaying the progression of the disease.
Experimental procedures
Cryba1 global knockout mice
βA3/A1‐crystallin conditional knockout (Cryba1 cKO) mice were generated as previously described (Valapala et al., 2014a,b). The controls used in this study are Cryba1 fl/fl mice. It is known that germline deletion of floxed alleles may occur when floxed mice are maintained for multiple generations with the Best1‐Cre allele, creating a global knockout of the floxed gene. We used this as a strategy to generate Cryba1 complete knockout (KO) mice. All animal studies were conducted in accordance with the Guide for the Care and Use of Animals (National Academy Press) and were approved by the Animal Care and Use Committee of Johns Hopkins University.
Isolation and culture of mouse primary RPE cells
Mouse RPE cells were isolated and cultured as previously described (Valapala et al., 2014a).
Autophagy induction
Autophagy was induced in Cryba1 fl/fl and KO mice by withholding food for 24 h, but with no restriction on water availability. For in vitro starvation, primary cultures of RPE cells from Cryba1 fl/fl and KO mice were maintained in growth medium lacking serum and glutamine for 24 h.
Antibodies
The following antibodies were used in this study: βA3/A1‐crystallin antibody (described previously Zigler et al., 2011), Slc36a4 antibody–N‐terminal (Aviva System Biology, San Diego, CA, ARP44114‐P050), Actin (Sigma, St. Louis, MO, A2066), PhosphoPlus‐p70 S6 Kinase (Thr389, Thr421/Ser424) Antibody Kit (Cell Signaling, Danver, MA, #9430), Phospho‐mTOR (Ser2448) (Cell Signaling, #5536), Rag and LAMTOR Antibody Sampler Kit (Cell Signaling, #8665), TFEB (Bethyl Laboratories, Montgomery, MA, A303‐673A), Lamin A/B (Santa Cruz, sc‐6215), Tubulin (MBL, PM054‐7Y), Phospho‐TFE3 (as described in Martina et al., 2016), CTSD (Gift from Dr. Ralph Nixon, NYU School of Medicine), SQSTM1/P62 (Abcam, Cambridge, MA, ab91526), Rhodopsin, M‐opsin, and PNAL (three gifts from Dr. Donald Zack, Wilmer Eye Institute, The Johns Hopkins University School of Medicine), 1D4 (gift from Dr. Krzysztof Palczewski, Case Western University), RPE65 (gift from Dr. T. Michael Redmond, NEI, NIH), and LRAT (Santa Cruz, Dallas, TX, sc‐99015).
Co‐immunoprecipitation
Pierce Co‐Immunoprecipitation Kit (Thermo Scientific, Waltham, MA, #26149) was used to carry out the immunoprecipitation studies. Briefly, RPE‐choroid preparations from seven mice of each genotype were sonicated in IP Lysis/Wash Buffer (provided in the kit) plus 1% protease inhibitors (Sigma). The total lysates were processed with the kit according to the instructions. Seventy micrograms of lysates of each genotype were immunoprecipitated with 10ug immobilized βA3/A1‐crystallin antibody at 4°C overnight. Normal rabbit IgG (Santa Cruz, sc‐2027) was the negative control. Samples from elution were loaded for SDS‐PAGE analysis. Fifteen micrograms of RPE‐choroid lysates of each genotype were loaded as the input for the SDS‐PAGE analysis.
Protein extraction and western blot analysis
RPE‐choroid preparations from freshly dissected mice were sonicated in RIPA lysis buffer (Millipore, Billerica, MA, 20‐188) plus 1% protease and phosphatase inhibitors (Sigma). Samples were incubated on ice for 20 min and centrifuged at 13 000 g for 20 min. The supernatants were mixed with 4X protein sample buffer (Invitrogen, Carlsbad, CA) plus 5% 2‐mercaptoethanol (Sigma) and heated at 100°C for 10 min to denature. Samples were loaded into a 4–12% Bis‐Tris Nu‐PAGE gel (Invitrogen) and run with MES buffer (Novex, Waltham, MA). Proteins were transferred to nitrocellulose membranes which were then blocked in 5% skim milk (Invitrogen) or 5% BSA (Sigma, for phosphorylated proteins). The membranes were incubated with primary antibody overnight followed by horseradish peroxidase‐conjugated secondary antibodies for 1 h at room temperature. Blots were developed by chemiluminescence (ECL) methodology. Densitometric analysis was carried out using quantity one software (Bio‐Rad Laboratories, Hercules, CA).
Human proteome high‐throughput array
The human proteome microarray 2.0 analysis was performed as a paid service from CDI NextGen Proteomics, MD, USA. For hit identification, we first obtained the ratio of median value of the foreground to the median of the surrounding background for each protein probe on the microarray, followed by the normalization by the median value of all neighboring probes within a 9 × 9 window size. Then, we compared normalized value of each probe to the distribution of noise signals to obtain a Z‐score representing the significance of the probe binding signal different from random noises we chose. The cutoff of Z‐score was 6 in this study. The protein was determined as a hit only if its Z‐score was above the cutoff for all triplicates.
Nuclei and cytoplasmic fraction
Nuclear and cytoplasmic fractions were isolated from extract of RPE‐choroid preparations from six‐month‐old Cryba1 fl/fl or Cryba1 KO mice using the NE‐PER Nuclear and Cytoplasmic Extraction Reagent Kit (Thermo Fisher Scientific, Waltham, MA, #78833) according to the manufacturer's protocol.
Quantification of the intracellular L‐amino‐acid concentration
RPE‐choroid complexes were homogenized in L‐amino acid assay buffer from the L‐Amino Acid Quantification Kit (Sigma, MAK002). Lysates were prepared as described above and then analyzed according to the manufacturer's instructions to determine their intracellular L‐amino‐acid concentration. The value for each sample was normalized by total protein concentration.
Immunofluorescence of RPE flat mount and cryosections
Fresh eyes were enucleated and fixed in 2% paraformaldehyde (PFA) for 10 min and then the anterior parts including cornea, lens, and attached iris pigmented epithelium were removed. The resulting posterior eyecups were fixed in 2% PFA for 1 h at room temperature either for cryosections or RPE flat mount. For cryosections, the eyecups were dehydrated through gradient sucrose solutions and embedded in OCT. For RPE flat mounts, retinas were then removed after the eyecup was quartered like a petaloid structure. The resulting eyecup was further cut radially into eight pieces from the optic nerve head to the periphery. Immunostaining on flat mount and cryosections was performed as described previously (Zigler et al., 2011). Stained RPE‐choroid sheets with sclera were mounted on a microscope slide with RPE layer up. Images were acquired by Zeiss LSM 710 confocal workstation.
Transmission electron microscopy
Samples were prepared and transmission electron microscopy was performed as previously described (Zigler et al., 2011).
RNA isolation, cDNA synthesis, and qRT–PCR
RNA isolation, cDNA synthesis, and qRT–PCR were performed as described previously (Valapala et al., 2014a). PCR amplification was performed using the 7500 PCR Fast Real‐Time System (Applied Biosystems, Carlsbad, CA, USA) and custom‐made TaqMan probes for LAMP1 (Mm00495262_m1), LAMP2A (Mm00495274_m1), cathepsin B (Mm01310506_m1), cathepsin D (Mm00515586_m1), V‐ATPase (Mm00724370_m1), UVRAG (Mm00724370_m1), Beclin‐1 (Mm01265461_m1), and Mucolipin‐1 (Mm00522549_m1). Actin B (Mm00607939_s1) was used as a loading control. All data were analyzed with the ABI 7500 Real Time PCR system using the data assist Software (Applied Biosystems), and the graphs were plotted using microsoft excel, Redmond, WA.
Molecular modeling
The possible interaction between PAT‐4, βA3‐crystallin, and V‐ATPase was tested using an interactive protein docking and molecular superposition program hex protein docking, version 6.3 (http://hex.loria.fr/manual63/hex_manual.pdf).
Statistical analysis
Statistical analysis was performed using microsoft excel. Graphs were plotted using origin8 software or microsoft excel. The P‐values were determined by two‐tailed Student's t‐test in at least three biological replicate experiments. Significance was defined as *P < 0.05. Results are presented as mean ± SEM.
Funding
This study was funded by an unrestricted grant to the Wilmer Eye Institute from the Research to Prevent Blindness, National Eye Institute: EY019037‐S (DS), EY019044 (JTH), EY14005 (JTH), EY01765 (Wilmer Imaging Core), and the National High Technology Research and Development Program of China (2013CB967501, 2015CB964601, 2013CB967101), Shanghai East Hospital (ZJ2014‐2D‐002), and Tongji Eye Institute (TEI‐201403001).
Conflict of interest
None declared.
Author contributions
DS designed the study and assisted with the generation of Cryba1 knockout (KO) mice and data analysis. G‐TX participated in the study design and analyzed data. SZ generated the Cryba1 KO mice and analyzed data. PS conducted the majority of experiments. MV, SG, and RP were involved with TFEB, TFE3, and CLEAR gene network studies. TEM experiments were conducted by RG and analyzed data with JTH, IAB, and JL. SH constructed the figures. JW and JQ analyzed the human proteome high‐throughput array data. LL assisted with the morphological studies and analyzed data. YS did the molecular modeling. DS, SZ, SH, and PS wrote the paper. All authors have approved the final manuscript.
Supporting information
Table S1 Heatmap of Z‐scores of 78 protein hits identified for all triplicates (Rep1/2/3) from 14 693 human proteins on the microarray. The hits were sorted by their mean value of Z‐scores.
Acknowledgments
We thank Dr. Morton Goldberg for critical reading and discussions regarding this manuscript. We thank Drs. Ralph Nixon (CTSD), Donald Zack (Rhodopsin, M‐opsin and PNAL), Krzysztof Palczewski (1D4), and T. Michael Redmond (RPE65) for the antibodies. DS is a guest professor at Tongji University School of Medicine, Shanghai, China, and a recipient of the Carolyn K. McGillvray Memorial Award for Macular Degeneration Research from BrightFocus Foundation, the Sybil B. Harrington Special Scholar Award for Macular Degeneration from Research to Prevent Blindness. JTH is the Robert Bond Welch Professor.
Contributor Information
Guo‐Tong Xu, Email: gtxu@tongji.edu.
Debasish Sinha, Email: Debasish@jhmi.edu.
References
- Bar‐Peled L, Schweitzer LD, Zoncu R, Sabatini DM (2012) Ragulator is a GEF for the rag GTPases that signal amino acid levels to mTORC1. Cell 150, 1196–1208. [DOI] [PMC free article] [PubMed] [Google Scholar]
- Beugnet A, Tee AR, Taylor PM, Proud CG (2003) Regulation of targets of mTOR (mammalian target of rapamycin) signalling by intracellular amino acid availability. Biochem. J. 372, 555–566. [DOI] [PMC free article] [PubMed] [Google Scholar]
- Boya P, Codogno P (2013) Cell biology: Recycling in sight. Nature 501, 40–42. [DOI] [PubMed] [Google Scholar]
- Breton S, Brown D (2013) Regulation of luminal acidification by the V‐ATPase. Physiology 28, 318–329. [DOI] [PMC free article] [PubMed] [Google Scholar]
- Buschini E, Fea AM, Lavia CA, Nassisi M, Pignata G, Zola M, Grignolo FM (2015) Recent developments in the management of dry age‐related macular degeneration. Clin. Ophthalmol. 9, 563–574. [DOI] [PMC free article] [PubMed] [Google Scholar]
- Cuervo AM, Dice JF (2000) Age‐related decline in chaperone‐mediated autophagy. J. Biol. Chem. 275, 31505–31513. [DOI] [PubMed] [Google Scholar]
- Duran A, Amanchy R, Linares JF, Joshi J, Abu‐Baker S, Porollo A, Hansen M, Moscat J, Diaz‐Meco MT (2011) p62 is a key regulator of nutrient sensing in the mTORC1 pathway. Mol. Cell 44, 134–146. [DOI] [PMC free article] [PubMed] [Google Scholar]
- Fan SJ, Snell C, Turley H, Li JL, McCormick R, Perera SM, Heublein S, Kazi S, Azad A, Wilson C, Harris AL, Goberdhan DC (2016) PAT4 levels control amino‐acid sensitivity of rapamycin‐resistant mTORC1 from the Golgi and affect clinical outcome in colorectal cancer. Oncogene 35, 3004–3015. [DOI] [PMC free article] [PubMed] [Google Scholar]
- Forgac M (2007) Vacuolar ATPases: rotary proton pumps in physiology and pathophysiology. Nat. Rev. Mol. Cell Biol. 8, 917–929. [DOI] [PubMed] [Google Scholar]
- Goberdhan DCI, Wilson C, Harris AL (2016) Amino acid sensing by mTORC1: intracellular transporters mark the spot. Cell Metab. 23, 580–589. [DOI] [PMC free article] [PubMed] [Google Scholar]
- Guha S, Coffey EE, Lu W, Lim JC, Beckel JM, Laties AM, Boesze‐Battaglia K, Mitchell CH (2014) Approaches for detecting lysosomal alkalinization and impaired degradation in fresh and cultured RPE cells: evidence for a role in retinal degenerations. Exp. Eye Res. 126, 68–76. [DOI] [PMC free article] [PubMed] [Google Scholar]
- Heublein S, Kazi S, Ogmundsdottir MH, Attwood EV, Kala S, Boyd CA, Wilson C, Goberdhan DC (2010) Proton‐assisted amino‐acid transporters are conserved regulators of proliferation and amino‐acid‐dependent mTORC1 activation. Oncogene 29, 4068–4079. [DOI] [PMC free article] [PubMed] [Google Scholar]
- Horwitz J (2003) Alpha‐crystallin. Exp. Eye Res. 76, 145–153. [DOI] [PubMed] [Google Scholar]
- Jin M, Yuan Q, Li S, Travis GH (2007) Role of LRAT on the retinoid isomerase activity and membrane association of Rpe65. J. Biol. Chem. 282, 20915–20924. [DOI] [PMC free article] [PubMed] [Google Scholar]
- Laplante M, Sabatini DM (2013) Regulation of mTORC1 and its impact on gene expression at a glance. J. Cell Sci. 126, 1713–1719. [DOI] [PMC free article] [PubMed] [Google Scholar]
- Martina JA, Puertollano R (2013) Rag GTPases mediate amino acid‐dependent recruitment of TFEB and MITF to lysosomes. J. Cell Biol. 200, 475–491. [DOI] [PMC free article] [PubMed] [Google Scholar]
- Martina JA, Chen Y, Gucek M, Puertollano R (2012) MTORC1 functions as a transcriptional regulator of autophagy by preventing nuclear transport of TFEB. Autophagy 8, 903–914. [DOI] [PMC free article] [PubMed] [Google Scholar]
- Martina JA, Diab HI, Lishu L, Jeong AL, Patange S, Raben N, Puertollano R (2014) The nutrient‐responsive transcription factor TFE3 promotes autophagy, lysosomal biogenesis, and clearance of cellular debris. Sci. Signal. 7, ra9. [DOI] [PMC free article] [PubMed] [Google Scholar]
- Martina JA, Diab HI, Brady OA, Puertollano R (2016) TFEB and TFE3 are novel components of the integrated stress response. EMBO J. 35, 479–495. [DOI] [PMC free article] [PubMed] [Google Scholar]
- Matsui T, Fukuda M (2013) Rab12 regulates mTORC1 activity and autophagy through controlling the degradation of amino‐acid transporter PAT4. EMBO Rep. 14, 450–457. [DOI] [PMC free article] [PubMed] [Google Scholar]
- Parthasarathy G, Ma B, Zhang C, Gongora C, Zigler JS Jr, Duncan MK, Sinha D (2011) Expression of betaA3/A1‐crystallin in the developing and adult rat eye. J. Mol. Histol. 42, 59–69. [DOI] [PMC free article] [PubMed] [Google Scholar]
- Piatigorsky J (2008) Lens and cornea: the “refracton hypothesis”. Semin. Cell Dev. Biol. 19, 69–70. [DOI] [PubMed] [Google Scholar]
- Puertollano R (2014) mTOR and lysosome regulation. F1000Prime Rep., 6, 52. [DOI] [PMC free article] [PubMed] [Google Scholar]
- Rakoczy PE, Lai CM, Baines M, DiGrandi S, Fitton JH, Constable IJ (1997) Modulation of cathepsin D activity in retinal pigment epithelial cells. Biochem. J. 324, 935–940. [DOI] [PMC free article] [PubMed] [Google Scholar]
- Rebsamen M, Pochini L, Stasyk T, de Araujo MEG, Galluccio M, Kandasamy RK, Snijder B, Fauster A, Rudashevskaya EL, Bruckner M, Scorzoni S, Filipek PA, Huber KVM, Bigenzahn JW, Heinz LX, Kraft C, Bennett KL, Indiveri C, Huber LA, Superti‐Furga G (2015) SLC38A9 is a component of the lysosomal amino acid sensing machinery that controls mTORC1. Nature 519, 477–481. [DOI] [PMC free article] [PubMed] [Google Scholar]
- Redmond TM, Yu S, Lee E, Bok D, Hamasaki D, Chen N, Goletz P, Ma JX, Crouch RK, Pfeifer K (1998) Rpe65 is necessary for production of 11‐cis‐vitamin A in the retinal visual cycle. Nat. Genet. 20, 344–351. [DOI] [PubMed] [Google Scholar]
- Roczniak‐Ferguson A, Petit CS, Froelich F, Qian S, Ky J, Angarola B, Walther TC, Ferguson SM (2012) The transcription factor TFEB links mTORC1 signaling to transcriptional control of lysosome homeostasis. Sci. Signal. 5, ra42. [DOI] [PMC free article] [PubMed] [Google Scholar]
- Settembre C, Di Malta C, Polito VA, Garcia Arencibia M, Vetrini F, Erdin S, Erdin SU, Huynh T, Medina D, Colella P, Sardiello M, Rubinsztein DC, Ballabio A (2011) TFEB links autophagy to lysosomal biogenesis. Science 332, 1429–1433. [DOI] [PMC free article] [PubMed] [Google Scholar]
- Settembre C, Zoncu R, Medina DL, Vetrini F, Erdin S, Erdin S, Huynh T, Ferron M, Karsenty G, Vellard MC, Facchinetti V, Sabatini DM, Ballabio A (2012) A lysosome‐to‐nucleus signalling mechanism senses and regulates the lysosome via mTOR and TFEB. EMBO J. 31, 1095–1108. [DOI] [PMC free article] [PubMed] [Google Scholar]
- Settembre C, Fraldi A, Medina DL, Ballabio A (2013) Signals from the lysosome: a control centre for cellular clearance and energy metabolism. Nat. Rev. Mol. Cell Biol. 14, 283–296. [DOI] [PMC free article] [PubMed] [Google Scholar]
- Sinha D, Valapala M, Shang P, Hose S, Grebe R, Lutty GA, Zigler JS, Kaarniranta K, Handa JT (2016) Lysosomes: Regulators of autophagy in the retinal pigmented epithelium. Exp. Eye Res. 144, 46–53. [DOI] [PMC free article] [PubMed] [Google Scholar]
- Sivaprasad S, Bird A, Nitiahpapand R, Nicholson L, Hykin P, Chatziralli I (2016) Perspectives on reticular pseudodrusen in age‐related macular degeneration. Surv. Ophthalmol. 15, 30070–30079. [DOI] [PubMed] [Google Scholar]
- Sparrow JR, Hicks D, Hamel CP (2010) The retinal pigment epithelium in health and disease. Curr. Mol. Med. 10, 802–823. [DOI] [PMC free article] [PubMed] [Google Scholar]
- Strauss O (2005) The retinal pigment epithelium in visual function. Physiol. Rev. 85, 845–881. [DOI] [PubMed] [Google Scholar]
- Taylor PM (2014) Role of amino acid transporters in amino acid sensing. Am. J. Clin. Nutr. 99, 223S–230S. [DOI] [PMC free article] [PubMed] [Google Scholar]
- Valapala M, Hose S, Gongora C, Dong L, Wawrousek EF, Zigler JS Jr, Sinha D (2013) Impaired endolysosomal function disrupts Notch signalling in optic nerve astrocytes. Nat. Commun. 4, 1629. [DOI] [PMC free article] [PubMed] [Google Scholar]
- Valapala M, Wilson C, Hose S, Bhutto IA, Grebe R, Dong A, Greenbaum S, Gu L, Sengupta S, Cano M, Hackett S, Xu G, Lutty GA, Dong L, Sergeev Y, Handa JT, Campochiaro P, Wawrousek E, Zigler JS Jr, Sinha D (2014a) Lysosomal‐mediated waste clearance in retinal pigment epithelial cells is regulated by CRYBA1/betaA3/A1‐crystallin via V‐ATPase‐MTORC1 signaling. Autophagy 10, 480–496. [DOI] [PMC free article] [PubMed] [Google Scholar]
- Valapala M, Edwards M, Hose S, Grebe R, Bhutto IA, Cano M, Berger T, Mak TW, Wawrousek E, Handa JT, Lutty GA, Zigler JS, Sinha D (2014b) Increased Lipocalin‐2 in the retinal pigment epithelium of Cryba1 cKO mice is associated with a chronic inflammatory response. Aging Cell 13, 1091–1094. [DOI] [PMC free article] [PubMed] [Google Scholar]
- Varga RE, Khundadze M, Damme M, Nietzsche S, Hoffmann B, Stauber T, Koch N, Hennings JC, Franzka P, Huebner AK, Kessels MM, Biskup C, Jentsch TJ, Qualmann B, Braulke T, Kurth I, Beetz C, Hubner CA (2015) In vivo evidence for lysosome depletion and impaired autophagic clearance in hereditary spastic paraplegia type SPG11. PLoS Genet. 11, e1005454. [DOI] [PMC free article] [PubMed] [Google Scholar]
- Wang S, Tsun ZY, Wolfson RL, Shen K, Wyant GA, Plovanich ME, Yuan ED, Jones TD, Chantranupong L, Comb W, Wang T, Bar‐Peled L, Zoncu R, Straub C, Kim C, Park J, Sabatini BL, Sabatini DM (2015) Metabolism. Lysosomal amino acid transporter SLC38A9 signals arginine sufficiency to mTORC1. Science 347, 188–194. [DOI] [PMC free article] [PubMed] [Google Scholar]
- Watanabe‐Asano T, Kuma A, Mizushima N (2014) Cycloheximide inhibits starvation‐induced autophagy through mTORC1 activation. Biochem. Biophys. Res. Commun. 445, 334–339. [DOI] [PubMed] [Google Scholar]
- Zigler JS, Sinha D (2015) beta A3/A1‐crystallin: More than a lens protein. Prog. Retin. Eye Res. 44, 62–85. [DOI] [PMC free article] [PubMed] [Google Scholar]
- Zigler JS Jr, Zhang C, Grebe R, Sehrawat G, Hackler L Jr, Adhya S, Hose S, McLeod DS, Bhutto I, Barbour W, Parthasarathy G, Zack DJ, Sergeev Y, Lutty GA, Handa JT, Sinha D (2011) Mutation in the betaA3/A1‐crystallin gene impairs phagosome degradation in the retinal pigmented epithelium of the rat. J. Cell Sci. 124, 523–531. [DOI] [PMC free article] [PubMed] [Google Scholar]
- Zoncu R, Bar‐Peled L, Efeyan A, Wang S, Sancak Y, Sabatini DM (2011) mTORC1 senses lysosomal amino acids through an inside‐out mechanism that requires the vacuolar H(+)‐ATPase. Science 334, 678–683. [DOI] [PMC free article] [PubMed] [Google Scholar]
Associated Data
This section collects any data citations, data availability statements, or supplementary materials included in this article.
Supplementary Materials
Table S1 Heatmap of Z‐scores of 78 protein hits identified for all triplicates (Rep1/2/3) from 14 693 human proteins on the microarray. The hits were sorted by their mean value of Z‐scores.