

Summary
Multiple loss‐of‐function mutations in TRIAD3 (a.k.a. RNF216) have recently been identified in patients suffering from Gordon Holmes syndrome (GHS), characterized by cognitive decline, dementia, and movement disorders. TRIAD3A is an E3 ubiquitin ligase that recognizes and facilitates the ubiquitination of its target for degradation by the ubiquitin‐proteasome system (UPS). Here, we demonstrate that two of these missense substitutions in TRIAD3 (R660C and R694C) could not regulate the degradation of their neuronal target, activity‐regulated cytoskeletal‐associated protein (Arc/Arg 3.1), whose expression is critical for synaptic plasticity and memory. The synaptic deficits due to the loss of endogenous TRIAD3A could not be rescued by TRIAD3A harboring GHS‐associated missense mutations. Moreover, we demonstrate that the loss of endogenous TRIAD3A in the mouse hippocampal CA1 region led to deficits in spatial learning and memory. Finally, we show that these missense mutations abolished the interaction of TRIAD3A with Arc, disrupting Arc ubiquitination, and consequently Arc degradation. Our current findings of Arc misregulation by TRIAD3A variants suggest that loss‐of‐function mutations in TRIAD3A may contribute to dementia observed in patients with GHS driven by dysfunctional UPS components, leading to cognitive impairments through the synaptic protein Arc.
Keywords: activity‐regulated cytoskeletal protein (Arc/Arg 3.1), behavior, dementia, Gordon Holmes syndrome, learning and memory, synapse, TRIAD3, ubiquitination
Introduction
Dementia encompasses diverse diseases that share cognitive deficits in areas involving executive function, attention, memory, and recognition (Margolin et al., 2013). Previous studies have shown that protein degradation by the ubiquitin‐proteasome system (UPS) is critical for the formation of long‐term memory in inhibitory avoidance test and memory reorganization after fear memory retrieval (Lopez‐Salon et al., 2001; Lee et al., 2008). Although UPS malfunction has been reported in Alzheimer's disease (AD), the most common form of dementia (Pasqualetti et al., 2015), the exact molecular identity that links UPS with dementia is still elusive.
The most common form of dementia is AD; however, other forms exist, including frontotemporal dementia, Lewy body dementia, and vascular dementia (Pasqualetti et al., 2015). Although rare, familial forms of dementia that are caused by heritable mutation(s) in certain genes provide valuable insights into the underlying cellular mechanisms of dementia. Gordon Holmes syndrome (GHS) is an adult‐onset disorder characterized by cognitive decline, dementia, and other clinical features such as ataxia and hypogonadotropism (Margolin et al., 2013). GHS was first described in 1907 by Holmes in a family of one sister and three brothers with symptoms of ataxia and hypogonadism (Holmes, 1907). Patients with GHS have consanguineous parents in most of the cases, indicating an autosomal recessive mode of inheritance (Berciano et al., 1982; Abs et al., 1990; Seminara et al., 2002; Margolin et al., 2013; Alqwaifly & Bohlega, 2016). Intriguingly, multiple novel mutations (missense and nonsense mutations) in TRIAD3 (RNF216), a gene encoding E3 ubiquitin ligase that recognizes the target protein and conjugates ubiquitin for target protein degradation, were identified in patients suffering from GHS (Margolin et al., 2013). Coincidentally, it was recently found that the function of the TRIAD3A protein in neurons is to regulate synaptic transmission and plasticity by acting as an E3 ubiquitin ligase of activity‐regulated cytoskeletal protein (Arc/Arg 3.1) (Mabb et al., 2014). Arc is an immediate early gene product that is involved in multiple forms of synaptic plasticity, such as long‐term potentiation, long‐term depression (LTD), and homeostatic scaling, all of which are implicated in normal cognitive function, including learning and memory. The roles of Arc in LTD and homeostatic scaling have been attributed to its ability to enhance endocytosis of synaptic AMPA‐type glutamate receptors (Shepherd et al., 2006; Waung et al., 2008). Therefore, as TRIAD3A maintains the appropriate level of Arc required for synaptic transmission and plasticity, its dysfunction potentially underlies the cognitive deficits observed in patients with dementia (Wu et al., 2011).
Here, we identified that missense substitutions in TRIAD3 (both R660C and R694C) resulted in defective Arc ubiquitination and degradation. As a result, the decreased synaptic strength due to TRIAD3A knockdown in neurons could not be rescued by the TRIAD3A missense variants, thereby causing aberrant synaptic transmission. Furthermore, in vivo knockdown of endogenous TRIAD3A in the CA1 region of the mouse hippocampus simulating the loss‐of‐function dementia‐related TRIAD3A mutations led to deficits in spatial learning and memory. Taken together, our results demonstrate that the loss‐of‐function dementia‐related mutations in TRIAD3A or reduced endogenous TRIAD3A protein levels may contribute to cognitive deficits in dementia through misregulation of Arc degradation in neurons.
Results
TRIAD3/RNF216 missense variants found in patients with GHS failed to degrade the Arc protein
Recently, four mutations [two nonsense mutations (Q184X and C540X) and two missense mutations (R660C and R694C)] in the gene encoding TRIAD3/RNF216 were identified in patients with GHS (Fig. 1A; Margolin et al., 2013). The two missense mutations (R660C and R694C) reside near (R660C) or within (R694C) the RING2 region of the C‐terminal RING1‐between‐RING2 (RBR) domain of TRIAD3. These residues (R660 and R694) are evolutionarily conserved across different species, including humans, rodents, zebrafishes, and frogs (Fig. 1B).
Figure 1.
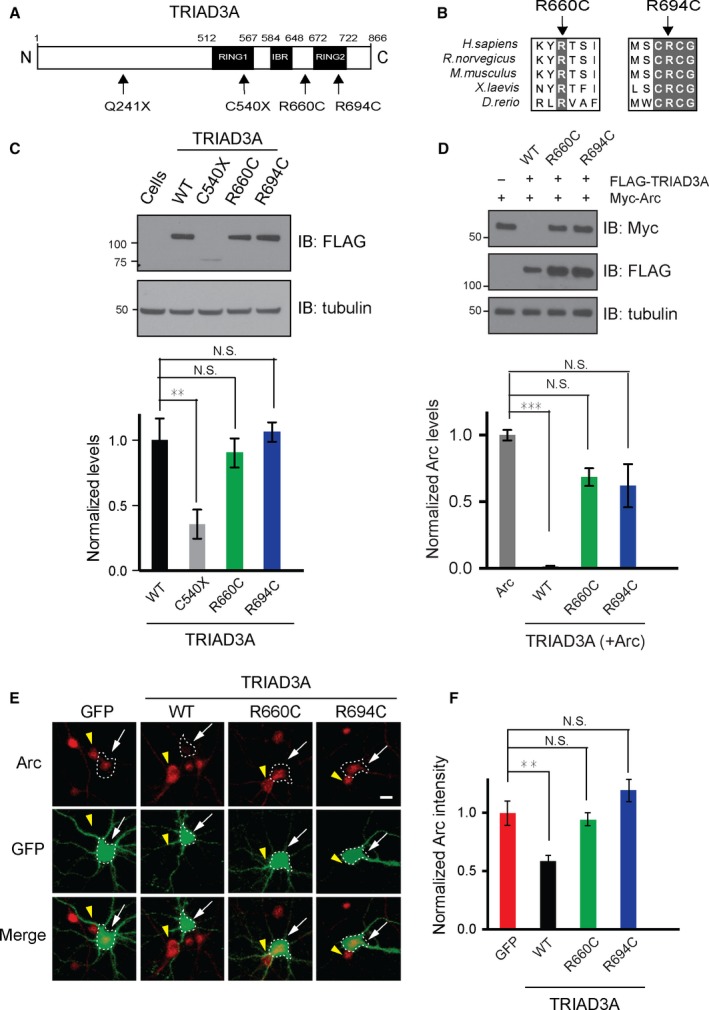
TRIAD3A variants do not degrade Arc. (A) TRIAD3A is an 866‐aa‐long protein (white) consisting of two RING domains, RING1 and RING2, which are separated by an in‐between RING fingers (IBR) domain. The positions of the four variants identified in patients with GHS are labeled. (B) TRIAD3A residues R660 and R694 are conserved across different organisms (human, rat, mouse, frog, and zebrafish). (C) Top panel: Western blot analyses were performed on HEK293T lysates overexpressing FLAG‐tagged TRIAD3A variants and blotted with an anti‐FLAG antibody and an anti‐tubulin antibody (loading control). Bottom panel: Quantification of TRIAD3A and TRIAD3A variants are depicted as the mean ± SEM (one‐way ANOVA, **P < 0.01, n = 4). (D) Top panel: HEK293T cells were cotransfected with 0.25 μg of Arc and 1 μg of WT TRIAD3A or TRIAD3A variants as indicated. Reduction in Arc levels is observed when Arc (α‐Myc) is co‐expressed with WT TRIAD3A, but not TRIAD3A point mutants. Bottom panel: Quantification of Arc levels when 1.0 μg WT TRIAD3A or TRIAD3A variants were overexpressed in HEK293T cells. The data represent the mean ± SEM. Statistical significance was assessed by one‐way ANOVA and Student's t‐test (***P < 0.001), n = 3. (E) Representative images of cultured cortical neurons transfected with GFP, WT TRIAD3A, TRIAD3A‐R660C (R660C), or TRIAD3A‐R694C (R694C). The white arrows indicate a transfected neuron whereas the yellow arrowhead indicates an untransfected neuron. Scale bar, 5 μm. (F) Histograms of results for GFP (n = 19), TRIAD3A (n = 34), R660C (n = 48), or R694C (n = 32). All histogram data are shown as the mean ± SEM. Statistical significance was assessed by one‐way ANOVA (*P < 0.05, **P < 0.01, ***P < 0.001).
TRIAD3 is expressed as five isoforms (TRIAD3A, B, C, D, and E). We focused on TRIAD3A because it is the most abundantly expressed isoform in the brain (Chuang & Ulevitch, 2004; Mabb et al., 2014). We generated expression constructs for TRIAD3A wild‐type (WT) and variants with an N‐terminal FLAG tag. Expression of these constructs in human embryonic kidney 293T (HEK293T) cells followed by Western blot analysis with a specific antibody against FLAG revealed that the TRIAD3A WT and mutant proteins had identical molecular weights and expression levels (WT vs. R660C, P = 0.9252; WT vs. R694C, P = 0.9783; n = 4; Fig. 1C). In contrast, the TRIAD3A nonsense variant (C540X) showed a significant (~65%) reduction in protein expression (WT vs. C540X, P = 0.0078; Fig. 1C).
To test whether either of the two missense variants of TRIAD3A (R660C and R694C) mediate Arc protein degradation, HEK293T cells were cotransfected with a FLAG‐tagged expression construct of either the WT TRIAD3A or a variant (R660C or R694C) together with a Myc‐tagged Arc expression construct and subjected to Western blot analyses. Previously, increasing amounts of TRIAD3A were shown to decrease Arc protein levels progressively through TRIAD3A‐mediated Arc ubiquitination and subsequent degradation by the UPS (Mabb et al., 2014). Intriguingly, we found that both the R660C and R694C variants failed to decrease Arc protein levels compared with TRIAD3A WT (>99%) (WT + Arc vs. Arc, P = 0.0002; R660C + Arc vs. Arc, P = 0.110; and R694C + Arc vs. Arc, P = 0.051; n = 4; Fig. 1D).
Given that TRIAD3A WT overexpression reduces endogenous Arc protein levels in cultured neurons (Mabb et al., 2014), cortical neurons were transfected with either WT or R660C and R694C TRIAD3A variants with GFP (Green Fluorescent Protein) cDNA and were immunostained with a specific antibody against Arc (Fig. 1E). Quantification of Arc immunoreactivity revealed a 41% reduction in endogenous Arc levels when neurons overexpressed TRIAD3A WT (P = 0.0034; Fig. 1F). However, neither R660C nor R694C TRIAD3A reduced endogenous Arc protein levels (GFP vs. R660C, P = 0.96; GFP vs. R694C, P = 0.31; n = 19–49; Fig. 1E,F). These results indicate that missense variants of TRIAD3A (R660C and R694C) linked to dementia are loss‐of‐function mutants in their ability to regulate Arc protein degradation.
Both R660C and R694C TRIAD3A variants failed to increase basal synaptic transmission through AMPA receptor regulation
TRIAD3A overexpression in neurons reduces Arc protein expression, resulting in decreased AMPA receptor endocytosis and increased surface AMPA receptor levels at excitatory synapses. Consistent with this model, TRIAD3A WT overexpression in neurons caused increased surface AMPA levels as revealed by surface labeling of the AMPA receptor subunit GluA1 (WT vs. GFP, P = 0.021, n = 9–11; Fig. 2A,B). In contrast, overexpression of TRIAD3A R660C or R694C failed to increase surface AMPA receptor levels in comparison with GFP (GFP vs. R660C, P = 0.76; GFP vs. R694C, P = 0.99; Fig. 2A,B).
Figure 2.
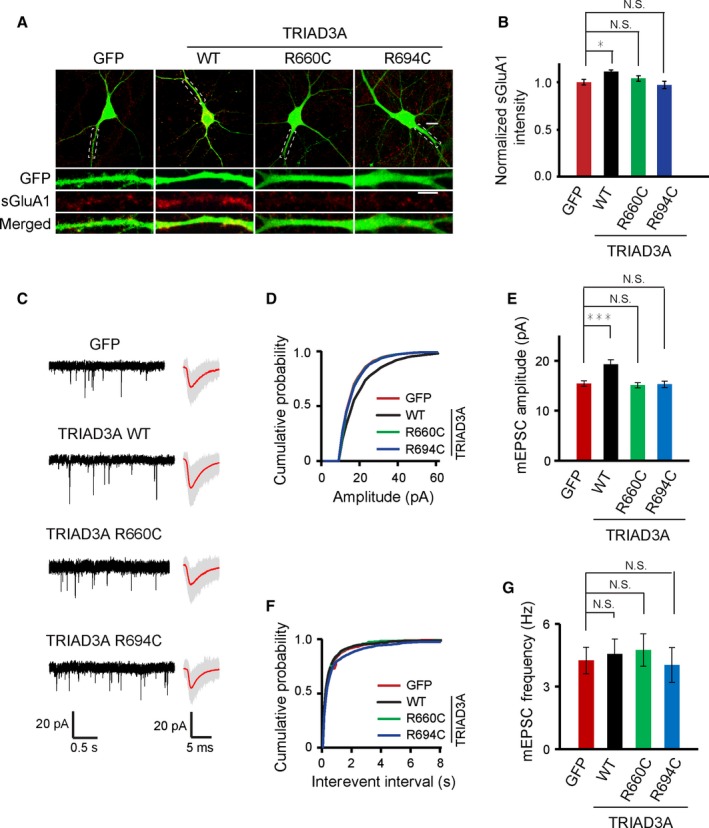
Increase in synaptic strength is impaired by the overexpression of the TRIAD3A variants. (A) Representative images of cortical neurons overexpressing GFP (control), wild‐type TRIAD3A (WT), TRIAD3A‐R660C (R660C), or TRIAD3A‐R694C (R694C) obtained after live antibody feeding with an anti‐GluA1 antibody are shown. Scale bars: 10 μm in the top panel and 5 μm in the bottom panel, respectively. (B) Quantification of surface GluA1 levels as the mean ± SEM is shown (P < 0.05). (C) Representative gap‐free recorded traces (left) and averaged mEPSC waveform (right) are shown for GFP (control), wild‐type TRIAD3A (WT), TRIAD3A‐R660C (R660C), or TRIAD3A‐R694C (R694C). In the averaged mEPSC waveform panel, gray traces indicate the overlaid raw traces and the red line indicates the average. (D,F) Cumulative plots and histograms (E,G) of mEPSC amplitude and frequency for GFP (n = 32), TRIAD3A (n = 36), R660C (n = 30), and R694C (n = 30). All histogram data are shown as the mean ± SEM. Statistical significance was assessed by one‐way ANOVA (*P < 0.05; ***P < 0.001).
To examine whether the modest increase in surface AMPA receptor levels observed upon TRIAD3A overexpression correlated with functional changes in AMPA receptor‐mediated basal synaptic transmission, we measured miniature excitatory postsynaptic currents (mEPSCs) at a resting membrane potential of −70 mV using whole‐cell patch clamp recordings. TRIAD3A WT overexpression increased mEPSC amplitudes significantly compared with neurons expressing GFP alone, without affecting mEPSC frequencies (GFP, 15.41 ± 0.54 pA, 4.25 ± 0.63 Hz, n = 32; TRIAD3A WT, 19.24 ± 0.94 pA, 4.56 ± 0.72 Hz, n = 36, P < 0.001 (amplitude); Fig. 2C–G). In contrast, overexpression of TRIAD3A R660C or R694C did not increase mEPSC amplitudes compared with neurons expressing GFP alone (TRIAD3A R660C, 15.09 ± 0.53 pA, 4.75 ± 0.78 Hz, n = 30, P = 0.39 relative to GFP (amplitude); TRIAD3A R694C, 15.28 ± 0.63 pA, 4.03 ± 0.83 Hz, n = 30 P = 0.907 relative to GFP (amplitude); Fig. 2C–G).
Next, to test whether the increase in synaptic transmission due to TRIAD3A overexpression is mediated via Arc, we transfected cortical neurons with TRIAD3A, along with WT Arc and a ubiquitination‐defective Arc‐K268R/K269R (Arc‐KR) variant (Mabb et al., 2014). The overexpression of Arc‐KR restores Arc to the level of the control (GFP) as shown by Arc immunostaining (Fig. S1A,B). The overexpression of WT TRIAD3A or WT TRIAD3A with WT Arc (TRIAD3A + Arc) significantly increased mEPSC amplitudes compared with neurons expressing GFP, without affecting the frequencies (GFP, 16.15 ± 1.24 pA, 4.07 ± 1.19 Hz, n = 14; TRIAD3A, 21.72 ± 1.75 pA, 6.27 ± 0.75 Hz, n = 12; TRIAD3A + Arc, 21.38 ± 1.52 pA, 4.80 ± 0.43 Hz, n = 16; GFP vs. TRIAD3A, P = 0.04 (amplitude), P = 0.98 (frequency); GFP vs. TRIAD3A + Arc, P = 0.04 (amplitude), P = 0.99 (frequency); Fig. 3A–E). In contrast, overexpression of WT TRIAD3A with Arc‐KR prevented this increase in amplitude in comparison with the control GFP group (TRIAD3A + Arc‐KR, 16.47 ± 0.98 pA, 3.41 ± 0.61 Hz, n = 15; GFP vs. TRIAD3A + Arc‐KR, P = 1.00 (amplitude), P = 0.31 (frequency); Fig. 3A–E). These data indicate that the increased basal synaptic transmission induced by TRIAD3A overexpression was due to Arc ubiquitination and degradation in neurons.
Figure 3.
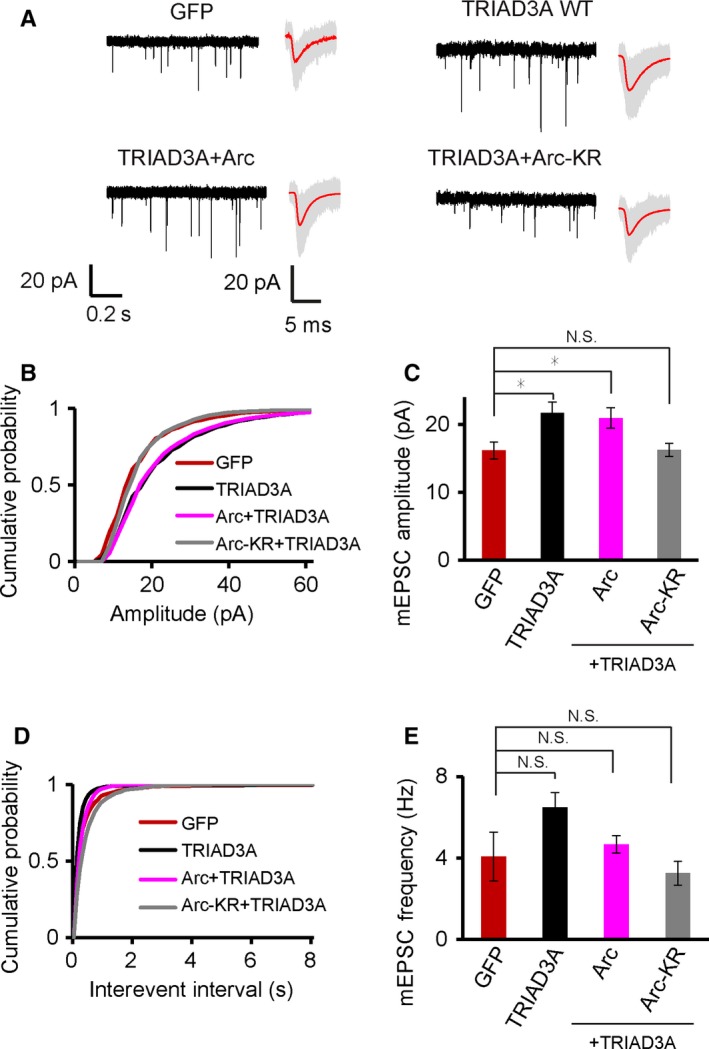
The increase in basal synaptic transmission by TRIAD3A overexpression is reversed by expression of Arc mutant that cannot be ubiquitinated. (A) Representative gap‐free recorded trace (left) and averaged mEPSC waveform (right) are shown for GFP, TRIAD3A‐WT (TRIAD3A) cotransfected with Arc WT (Arc) or Arc‐K268R/K269R (Arc‐KR). In the averaged mEPSC waveform panel, gray traces indicate the overlaid raw traces and the red line indicates the average. (B,D) Cumulative plot and (C,E) histograms of mEPSC amplitude and frequency for GFP (n = 14), TRIAD3A (n = 12), TRIAD3A + Arc (n = 16), and TRIAD3A + Arc‐KR (n = 15). All histogram data are shown as the mean ± SEM. Statistical significance was assessed by one‐way ANOVA (*P < 0.05).
The decrease in synaptic strength induced by TRIAD3A knockdown could not be rescued by TRIAD3A R660C and R694C variants
Next, we investigated whether the R660C or R694C TRIAD3A variant could rescue the synaptic effects triggered by the loss of endogenous TRIAD3A in cortical neurons resulting from the expression of small hairpin RNA (shRNA) targeting TRIAD3A as shown previously using cultured hippocampal neurons (Mabb et al., 2014). The TRIAD3A shRNA (TRIAD3A‐sh) could efficiently knockdown exogenously expressed TRIAD3A in HEK293T cells, and this knockdown effect of TRIAD3A‐sh could be rescued by the co‐expression of an shRNA‐resistant TRIAD3A WT (R) expression construct (Fig. S2).
Previously, we showed that TRIAD3A knockdown in cultured hippocampal neurons resulted in Arc upregulation (Mabb et al., 2014). Endogenous TRIAD3A knockdown in neurons caused a significant decrease in mEPSC amplitudes but not frequencies (TRIAD3A‐sh, 11.64 ± 0.43 pA, 3.11 ± 0.61 Hz, n = 12; scrambled shRNA (Scr), 15.32 ± 1.44 pA, 5.39 ± 1.17 Hz, n = 14, P = 0.007 (amplitude) and P = 0.18 (frequency) relative to Scr; Fig. 4A–E). Importantly, the synaptic effects of TRIAD3A knockdown could be rescued by the co‐expression of TRIAD3A WT (R) (15.15 ± 1.13 pA, 3.56 ± 0.75 Hz, n = 12; P = 0.99 (amplitude) relative to Scr; Fig. 4A–E). Next, we tested whether an shRNA‐resistant R660C (R660C‐R) or R694C (R694C‐R) TRIAD3A variant could rescue TRIAD3A knockdown phenotypes of basal synaptic transmission. Neither the R660C nor R694C variant could rescue the TRIAD3A‐sh‐induced decrease in mEPSC amplitude (Scr, 15.71 ± 0.97 pA, 4.00 ± 0.56 Hz, n = 25; TRIAD3A‐sh, 12.68 ± 0.48 pA, 3.09 ± 0.67 Hz, n = 28, P = 0.001 (amplitude), P = 0.62 (frequency); TRIAD3A‐sh + R660C‐R, 11.85 ± 0.32 pA, 2.35 ± 0.46 Hz, n = 21, P < 0.0001 (amplitude), P = 0.18 (frequency); TRIAD3A‐sh + R694C‐R, 12.68 ± 0.42 pA, 2.65 ± 0.41 Hz; P = 0.002 (amplitude), P = 0.32 (frequency) relative to Scr; Fig. 4F–J). These results confirmed that the TRIAD3A R660C or R694C variants could not rescue TRIAD3A knockdown phenotypes of basal synaptic transmission.
Figure 4.
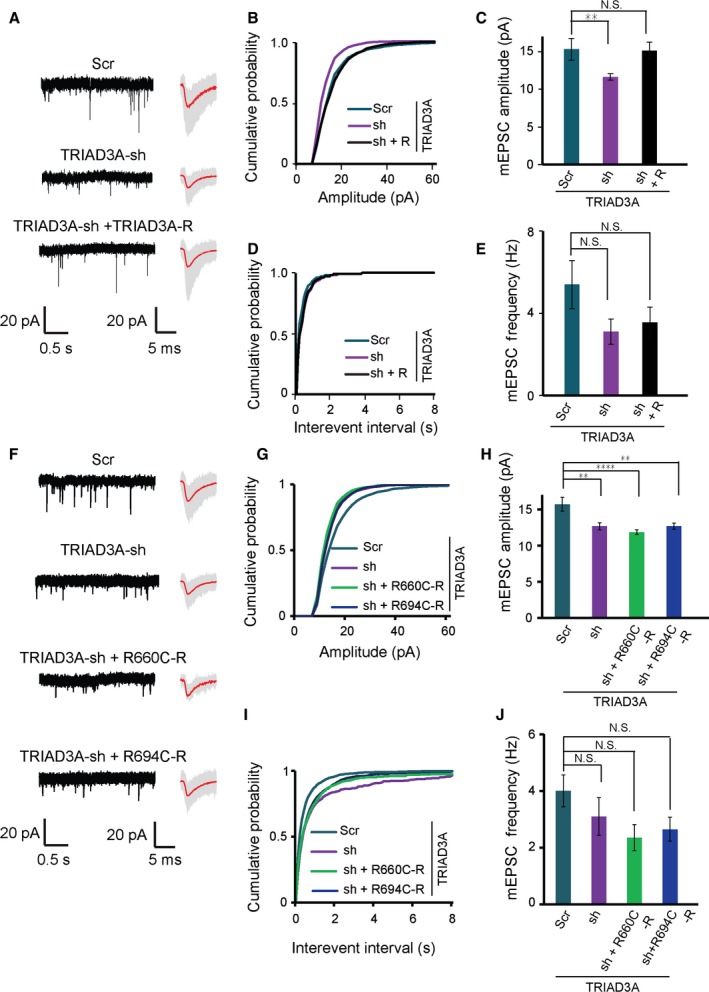
The decrease in synaptic strength by TRIAD3A knockdown cannot be rescued by TRIAD3A mutants. (A) Representative gap‐free recorded trace (left) and averaged mEPSC waveform (right) are shown for scrambled shRNA (Scr), TRIAD3A‐shRNA (TRIAD3A‐sh), or TRIAD3A‐shRNA cotransfected with shRNA‐resistant TRIAD3A (TRIAD3A‐sh + TRIAD3A‐R). In the averaged mEPSC waveform panel, gray traces indicate the overlaid raw traces and the red line indicates the average. (B,D) Cumulative plot and (C,E) histograms of mEPSC amplitude and frequency for Scr (n = 14), sh (n = 14), and sh + TRIAD3A‐R (n = 12; **P < 0.01). (F) Representative gap‐free recorded trace (left) and averaged mEPSC waveform (right) are shown for cortical neurons transfected with scrambled shRNA (Scr), TRIAD3A‐shRNA (TRIAD3A‐sh), or TRIAD3A‐shRNA cotransfected with shRNA‐resistant TRIAD3A variants (TRIAD3A‐sh + R660C‐R and TRIAD3A‐sh + R694C‐R). In the averaged mEPSC waveform panel, gray traces indicate the overlaid raw traces and the red line indicates the average. (G–J) mEPSC for knockdown rescue of the TRIAD3A variants (n = 25, 28, 21, 23 for Scr, sh, sh + R660C, and sh + R694C, respectively). All histogram data are shown as the mean ± SEM. Statistical significance was assessed by one‐way ANOVA (****P < 0.0001; **P < 0.01).
To further test whether the decrease in synaptic transmission due to TRIAD3A knockdown was mediated via Arc, we transfected cortical neurons with TRIAD3A shRNA together with either Arc shRNA or scrambled shRNA. The knockdown of TRIAD3A alone (TRIAD3A sh + Scr) resulted in a 31% decrease in mEPSC amplitudes compared with the knockdown of both TRIAD3A and Arc (TRIAD3A sh + Arc sh) with no change in mEPSC frequencies (TRIAD3A sh + Scr, 14.39 ± 0.66 pA, 7.64 ± 1.38 Hz, TRIAD3A sh + Arc sh, 20.93 ± 1.45 pA, 10.19 ± 1.97 Hz, n = 20, P = 0.0002 (amplitude), P = 0.284 (frequency); Fig. S3). These data indicated that reduced basal synaptic transmission triggered by TRIAD3A knockdown was due to elevated Arc protein levels in neurons.
TRIAD3A knockdown in the hippocampus impairs spatial memory
Given that loss‐of‐function mutations in TRIAD3 were identified in patients with dementia and related cognitive deficits, we hypothesized that the in vivo knockdown of endogenous TRIAD3A in the mouse hippocampus would lead to deficits in learning and memory, one of the hallmarks of dementia. We utilized TRIAD3A‐sh to reduce endogenous TRIAD3A levels as previously described (Mabb et al., 2014) and injected lentiviral particles harboring either TRIAD3A shRNA (KD group) or scrambled shRNA (control group) bilaterally into the CA1 region of the mouse hippocampus (Figs 5A and S4A,B). The knockdown of endogenous TRIAD3A was confirmed by immunohistochemistry using a specific antibody against TRIAD3A, and we compared changes in the levels of endogenous TRIAD3A in TRIAD3A shRNA‐ and scrambled shRNA‐transfected pyramidal neurons within the CA1 region (>25% reduction in immunofluorescence upon TRIAD3A shRNA expression, P = 0.004, Student's t‐test; Fig. S4C,D). The knockdown of endogenous TRIAD3A was further confirmed by comparing the TRIAD3A levels in mouse cortical neurons expressing TRIAD3A shRNA or scrambled shRNA as was shown previously using cultured rat hippocampal neurons (Fig. S4E) (Mabb et al., 2014).
Figure 5.
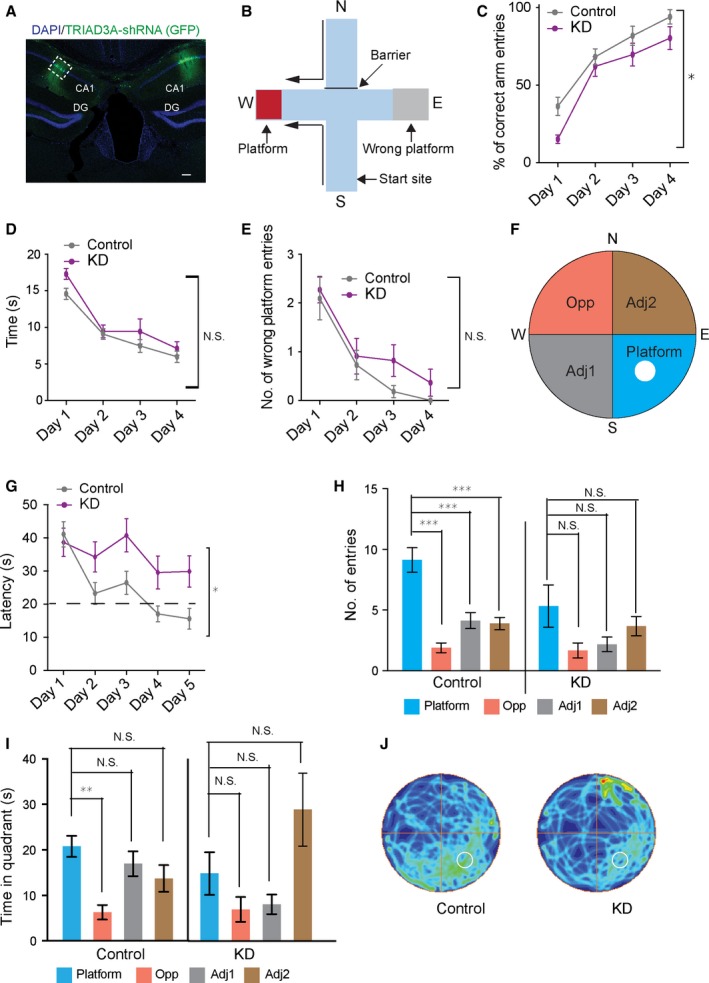
Loss of TRIAD3A in the CA1 region of the mouse hippocampus impairs spatial memory. (A) Coronal mouse brain section with the shRNA virus‐infected CA1 region as indicated by the GFP signal. Scale bar, 100 μm. (B) Schematic representation of the water‐cross maze experiment. The four arms are labeled north (N), south (S), east (E), and west (W). The location of the platform is shown. (C) The percentages of correct arm entries calculated from the six trials each day are shown. The KD group is deficient in locating the platform as accurately as the control group (two‐way ANOVA followed by Sidak's post hoc test, *P < 0.05). The time taken by the KD and control groups to reach the platform (latency) (D) and the number of wrong platform visits (E) over the 4 days of training are shown. Statistical significance was assessed by two‐way ANOVA and Student's t‐test (n = 11 for the KD group and n = 11 for the control group). (F) Scheme of the Morris water maze with the reference points used in the protocol and the names of the quadrants that are used for the analysis. The platform was located in the S‐E quadrant of the pool. (G) Latency to reach the platform within the 5 days of training is shown. The control group learned the location of the platform, but the KD group did not (two‐way ANOVA followed by Bonferroni post hoc comparison, *P < 0.05; control: n = 8; KD: n = 6). The dotted line indicates the threshold for the animal to acquire learning (20 s to reach the platform). Number of entries (H) and time spent (I) in the different quadrants of the pool during the probe test on the 6th day, 24 h after the last learning trial. Data are presented as the means ± SEM. *P < 0.05, **P < 0.01, and ***P < 0.001; ANOVA Bonferroni post hoc comparison in (H,I). (J) Group occupancy plot for control and KD mice is shown. The platform was located in the lower right quadrant prior to the probe trial and is depicted by a dotted white circle. The value for the maximum occupancy is the maximum found in any of the plots.
Three weeks after lentiviral infusion, the animals were subjected to a battery of behavioral paradigms. In the open‐field (OF) test, we could not observe any difference in the total distance traveled (F 1,20 = 0.16, P = 0.69, two‐way ANOVA, KD vs. control), distance traveled in the center (F 1,20 = 0.70, P = 0.41, two‐way ANOVA, KD vs. control) or time spent in the center (KD: 40.55 ± s/min; control: 46.74 ± 3.46 s/min; P = 0.2892, Student's t‐test) between the two groups (Fig. S5A–D).
Next, to test whether there were any differences in spatial learning and memory between the two groups, we employed two relevant behavioral paradigms: the water‐cross maze (WCM) and the Morris water maze (MWM) (Kleinknecht et al., 2012; Morris, 1984). The WCM set‐up consists of a water‐filled maze with four arms (N, S, E, and W), with a hidden platform located in one arm (W) (Fig. 5B). Six trials were conducted per day across 4 days to train the mice to locate the hidden platform. Each trial was conducted after the arm located on the opposite side from the start arm (either S or N) was blocked. Interestingly, we observed that the group injected with the TRIAD3A shRNA exhibited reduced accuracy (F 1,20 = 4.676, P = 0.043, two‐way ANOVA, KD vs. control; Fig. 5C), indicating that loss of endogenous TRIAD3A resulted in reduced impaired spatial learning compared with the control (Fig. 5C). However, there were no differences in latency (F 1,20 = 2.06, P = 0.16, two‐way ANOVA, KD vs. control) or number of wrong platform visits (F 1,20 = 1.49, P = 0.23, two‐way ANOVA, TRIAD3A KD vs. control; Fig. 5D,E).
As an alternative but analogous test for spatial learning and memory, we performed the MWM (Morris, 1984). Mice were trained to reach a hidden platform located in one of the quadrants of the circular gray pool filled with water across 5 days (Fig. 5F). On the 6th day, a 60‐second probe trial was conducted without the platform, and the number of entries and time spent in each quadrant was analyzed. We observed a significant difference in the latency to reach the platform during the training, indicative of a learning disparity between control and KD groups (F 1,12 = 4.9534, P = 0.046, two‐way ANOVA with ‘trials’ as repeated measures; Fig. 5G). The control group reached the criterion of reaching the platform in less than 20 s for two consecutive days, whereas the KD group did not succeed in reaching this criterion (learning effects over the 5 days for control: F 4,155 = 9.775, P < 0.0001, and KD: F 4,115 = 1.149, P = 0.337, one‐way ANOVA). For the probe test, which was used to measure the retention of spatial location of a hidden platform, we found a significant difference in the number of entries in the platform quadrant (Platform) when compared to the platform opposite quadrant (Opp) or the platform adjacent quadrants (Adj1 and Adj2) in the control group but not in the KD group (control: 9.12 ± 1.00 for Platform, 1.87 ± 0.39 for Opp, 4.12 ± 0.66 for Adj1, 3.87 ± 0.51 for Adj2, F 3,28 = 20.2, P = 0.0001, one‐way ANOVA; KD: 5.33 ± 1.74 for Platform, 1.67 ± 0.61 for Opp, 2.17 ± 0.60 for Adj1, 3.67 ± 0.80 for Adj2, F 3,20 = 2.46, P = 0.098, one‐way ANOVA; Fig. 5H). Furthermore, we found a significant difference in the time spent in the Platform vs. Opp only for the control group (control: 20.76 ± 2.30 for Platform, 6.28 ± 1.60 for Opp, 16.95 ± 0.2.74 for Adj1, 13.73 ± 2.92 for Adj2, Platform vs. Opp, P = 0.002, Bonferroni post hoc comparisons for time between both quadrants, with all four quadrants considered; KD: 14.80 ± 4.69 for Platform, 6.91 ± 2.73 for Opp, 8.03 ± 2.13 for Adj1, 28.85 ± 8.01 for Adj2, Platform vs. Opp, P = 1.000, Bonferroni post hoc comparisons for time between both quadrants with all four quadrants considered; Fig. 5I), suggesting that the KD group could not remember the location of the platform during the probe test (Fig. 5J). Taken together, these results suggest that endogenous knockdown of TRIAD3A in the CA1 region of the hippocampus leads to deficits in spatial learning and memory in mice.
The R660C and R694C TRIAD3A variants neither interacted with Arc nor promoted its ubiquitination
Given that the dementia‐associated TRIAD3A variants could not degrade Arc, we sought to investigate whether the mutations in TRIAD3 could affect Arc ubiquitination by performing an in vivo ubiquitination assay (Mabb et al., 2014). The cotransfection of Myc‐tagged Arc with HA(hemagglutinin)‐tagged ubiquitin cDNAs in HEK293T cells resulted in robust Arc ubiquitination in the presence of TRIAD3A WT (Fig. 6A). In contrast, the expression of either TRIAD3A R660C or R694C variants failed to promote Arc ubiquitination as evidenced by the Western blot of HA‐ubiquitin (Fig. 6A). The lack of Arc ubiquitination by either R660C or R694C prompted us to test Arc interaction by performing co‐immunoprecipitation (Co‐IP) experiments in HEK293T cells. Intriguingly, TRIAD3A WT co‐immunoprecipitated with Arc but neither the R660C nor R694C variant co‐immunoprecipitated with Arc (Fig. 6B).
Figure 6.
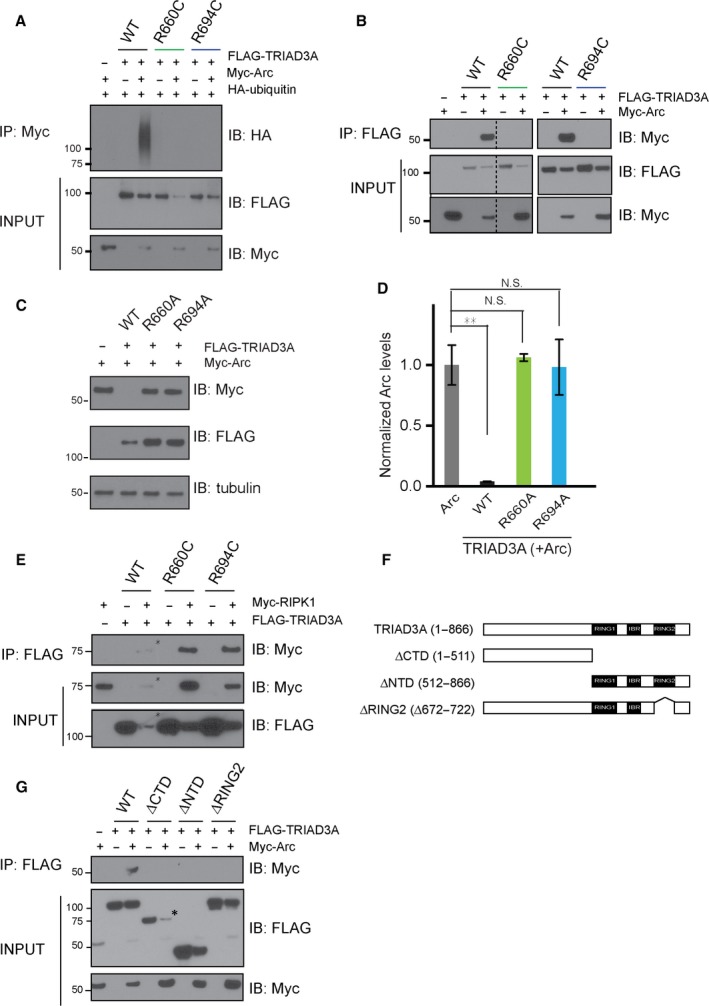
Intact TRIAD3A is required for Arc degradation, ubiquitination, and binding. (A) Ubiquitination assay was performed by transfecting HEK293T cells with Myc‐tagged Arc, HA‐tagged ubiquitin, and FLAG‐tagged TRIAD3A/TRIAD3A variants. The α‐HA (ubiquitin) immunoblot after IP with anti‐Myc beads is shown in the top panel. Only WT TRIAD3A can ubiquitinate Arc; the TRIAD3A variants cannot. The INPUT (2% of entire lysate) samples, which were immunoblotted (IB) with the antibodies indicated, are shown in the bottom two panels. (B) Co‐IP was performed using HEK293T cell lysates cotransfected with Myc‐tagged Arc and FLAG‐tagged TRIAD3A/TRIAD3A variants. IP was performed using α‐FLAG beads and then IB with α‐Myc to probe for Arc pull‐down. The INPUT (2% of entire lysate) samples show the expression of Arc and TRIAD3A in the lysate before IP. The dotted line indicates that the samples were from the same gel, but the lanes were noncontiguous. (C) Top panel: HEK293T cells were cotransfected with 0.25 μg of Arc and 1 μg of WT TRIAD3A and TRIAD3A alanine variants as indicated. Bottom panel: Quantification of Arc levels upon TRIAD3A WT or variants overexpression in HEK293T cells. The data represent the mean ± SEM. Statistical significance was assessed by one‐way ANOVA and Student's t‐test (**P < 0.01), n = 3. (D) Co‐IP was performed using HEK293T cell lysates cotransfected with Myc‐tagged RIPK1 and FLAG‐tagged TRIAD3A/TRIAD3A variants. IP was performed using α‐FLAG beads and then IB with α‐Myc to probe for RIPK1 pull‐down. RIPK1 binds to WT TRIAD3A and TRIAD3A variants. The INPUT (2% of entire lysate) samples show the expression of RIPK1 and TRIAD3A in the lysate before IP. (E) Schematic of the TRIAD3A protein indicating the truncations that were generated. (F) Co‐IP was performed using HEK293T cell lysates cotransfected with Myc‐tagged Arc and FLAG‐tagged TRIAD3A/TRIAD3A truncated constructs. IP was performed using α‐FLAG beads and then IB with α‐Myc to probe for Arc pull‐down. The INPUT (2% of entire lysate) samples show the expression of Arc and TRIAD3A in the lysate before IP. (*) indicates lower protein levels.
Arginine is the most commonly mutated residue in disease‐causing mutations found in humans (Cooper et al., 1998; Krawczak et al., 1998) and is commonly exchanged to cysteine, which potentially disrupts protein function by forming disulfide bridges between two cysteine residues within the protein (Thornton, 1981). However, we found that arginine to alanine substitutions in the TRIAD3A variants (R660A and R694A) disrupted Arc binding, ubiquitination, and degradation equally (Figs 6C and S6A,B), indicating that these two residues (R660 and R694) are indeed critical for Arc interaction.
Similar to other known E3 ubiquitin ligases, TRIAD3A has multiple protein‐binding partners in addition to Arc. To investigate whether TRIAD3A R660C and R694C variants have specific synaptic defects due to their lack of binding to Arc selectively, we performed Co‐IP experiments by expressing TRIAD3A WT or variants with the TRIAD3A binding partner RIPK1 [receptor (TNFRSF)‐interacting serine‐threonine kinase 1]. We found that both TRIAD3A R660C and R694C variants bind RIPK1 (Fig. 6D). This suggests that TRIAD3 mutations are selectively defective in their Arc interaction.
The loss of Arc interaction by substitutions at R660 and R694 residues that lie within the C‐terminal RBR domain of TRIAD3A is puzzling because the C‐terminal domain is quite distant from the N‐terminal region of TRIAD3A (201–470 aa), which was previously shown to be required for Arc binding (Mabb et al., 2014). Therefore, we sought to identify Arc interaction domains of TRIAD3A by generating multiple domain‐truncated mutants of TRIAD3A (ΔCTD: 1–511 aa; ΔNTD: 512–866 aa; and ΔRING2: 672–722 aa) and performing Co‐IP assays with Myc‐tagged Arc (Fig. 6E). All mutants failed to interact with Arc, suggesting that the native structure of TRIAD3A is required for Arc interaction (Fig. 6F).
Missense variants of TRIAD3A did not colocalize with clathrin‐mediated endocytic sites
Arc interacts with endocytic proteins, such as dynamin‐2 and endophilin‐3, to mediate AMPA receptor endocytosis (Chowdhury et al., 2006). Previously, it was shown that a pool of Arc proteins localize at clathrin‐coated pits where TRIAD3A resides for subsequent Arc ubiquitination and degradation (Chowdhury et al., 2006; Mabb et al., 2014). To test whether TRIAD3A R660C or R694C mutations affect the subcellular localization of TRIAD3A, we co‐expressed GFP‐tagged TRIAD3A with DsRed‐tagged clathrin light chain (LC) in COS7 cells and examined the colocalization of these proteins at the plasma membrane using total internal reflection fluorescence microscopy (TIRFM). TIRFM revealed punctate spots of GFP‐tagged TRIAD3A that colocalized with clathrin‐coated pits (Fig. S7A). In contrast, TRIAD3A R660C and R694C variants did not colocalize with clathrin puncta (Fig. S7A). In neurons, TRIAD3A WT puncta colocalized with clathrin‐DsRed signals in dendritic shafts (percent of puncta colocalized with clathrin signal, 68.66 ± 6.98%, n = 9; Fig. S7B,C). However, both TRIAD3A R660C and R694C variants exhibited diffused patterns within neuronal dendrites and did not colocalize with clathrin puncta (percent of puncta colocalized with clathrin signal, R660C: 25.75 ± 2.98%, P = 0.00002, n = 11; R694C: 30.89 ± 5.99%, P = 0.00018, n = 9, compared with WT; Fig. S7B,C). These results demonstrate that missense variants of TRIAD3A (R660C and R694C) not only affect interaction with Arc but also decrease the subcellular localization of TRIAD3A at endocytic sites, where TRIAD3A functions to regulate Arc turnover in neurons.
Discussion
We demonstrated that misregulated Arc levels resulting from TRIAD3A loss‐of‐function variants disrupted surface AMPA receptors and basal synaptic transmission. Furthermore, intra‐CA1 delivery of shRNA against TRIAD3A in mouse in vivo resulted in deficits in spatial learning and memory (Fig. 5). We showed that the two GHS‐related TRIAD3A variants (R660C and R694C) failed to bind and ubiquitinate Arc, did not localize at the endocytic sites and could not regulate Arc levels as a consequence (Figs 6 and S7). Considering these findings, we propose that TRIAD3A loss of function and consequent protein homeostasis failure result in synaptic dysfunction that underlies cognitive deficits in dementia patients.
Arc misregulation links synaptic deficits with UPS dysfunction as the basis for cognitive decline in dementia
Among the types of dementias, AD appears to be a disorder of synaptic failure, which involves disruptions in synaptic structure and function that consequently lead to aberrant neural processing and cognitive behavioral deficits (DeKosky et al., 1996). However, how does Arc misregulation lead to cognitive deficits? Upon activation, Arc is targeted to the dendritic spines and shafts of excitatory neurons, where it interacts with endophilin 2/3 and dynamin to facilitate AMPA receptor endocytosis. This Arc‐mediated AMPA receptor endocytosis decreases the activity of neuronal networks as well as spine size and types (Peebles et al., 2010). If Arc‐mediated endocytosis remains unchecked, then excessive modifications of synaptic strength might generate instability or altered synchrony in neuronal networks, subsequently leading to disease states characterized by network imbalances, as observed in AD.
Arc gain of function has been implicated in synaptic changes in neurodevelopmental and neurodegenerative diseases (Greer et al., 2010; Wu et al., 2011). Arc interacts with presenilin and confers activity‐dependent increases in γ‐secretase cleavage of amyloid precursor protein to generate Aβ amyloid (Wu et al., 2011). Moreover, elevated Arc protein expression was observed in the gray matter of the medial frontal cortices of patients with AD (Wu et al., 2011) and of certain AD mouse models (Lacor et al., 2004; Rosi et al., 2005; Perez‐Cruz et al., 2011). The exact underlying mechanisms by which Arc is upregulated in AD are unknown; however, these findings indicate that the Arc protein might be an important molecular determinant in regulating synaptic function in the brain.
UPS malfunction has been reported in a host of neurodegenerative disorders such as AD, Parkinson's disease, amyotrophic lateral sclerosis, and Huntington's disease (Keller et al., 2000; McNaught et al., 2003; Seo et al., 2004). Previous studies have shown that protein degradation by the UPS is critical for the retrieval of contextual fear memories during memory retrieval tests by polyubiquitination of synaptic activity‐regulated proteins such as Shank and guanylate kinase‐associated protein, and for the formation of long‐term memory in inhibitory avoidance tests (Lopez‐Salon et al., 2001; Lee et al., 2008). Moreover, many ubiquitin E3 ligases, such as STUB1, Parkin, and Ube3A, have been implicated in several neurodegenerative disorders, suggesting a link between ubiquitination and neurodegeneration.
Dementia observed in the patients with GHS exhibits characteristics similar to other types of age‐dependent dementing illnesses: (i) neuropathological analysis on the postmortem brain tissue of a GHS patient with dementia‐harboring TRIAD3 mutations (Margolin et al., 2013) revealed the presence of neuronal ubiquitin‐positive inclusions observed in patients with frontotemporal dementia (Rosso et al., 2001; Weder et al., 2007) and (ii) mutations in TRIAD3 were recently identified in patients suffering from Huntington‐like disease (HDL) with various symptoms including progressive dementia. Interestingly, a parent of two siblings suffering from HDL with heterozygous TRIAD3 mutation, was diagnosed with late‐onset dementia and Parkisonism. (Santens et al., 2015). Elevated Arc levels due to TRIAD3A knockdown that results in lower basal synaptic transmission might impair synaptic plasticity and subsequently lead to memory loss in patients with dementia. The spatial memory deficits exhibited by mice due to hippocampal TRIAD3A knockdown mirrors the memory impairment observed in patients with dementia. Our current findings of Arc misregulation by loss‐of‐function TRIAD3A variants found in patients with GHS indicate that these two pathways converge as the molecular mechanism underlying dementia in these patients.
Identification of TRIAD3 variants in dementia and other neurodegenerative diseases
The GHS patients with TRIAD3 mutations described by Margolin et al. also exhibited early‐onset ataxia and hypogonadotropism. Could TRIAD3 variants be found in other neurodegenerative disorders with overlapping symptoms? More recent studies have reported multiple mutations in TRIAD3 in patients suffering from pediatric‐onset ataxia (R686X), 4H syndrome, and Huntington‐like disorder (Q302X, G456E, and Y539C) (Sawyer et al., 2014; Ganos et al., 2015; Santens et al., 2015). Intriguingly, although the clinical characteristics between patients with GHS and HDL were varied, cerebellar ataxia, dementia, and cognitive defects were some of the common phenotypes in all of these studies with TRIAD3 mutations (Sawyer et al., 2014; Santens et al., 2015). If possible, measuring the TRIAD3A levels in the brains of these patients to test for a decrease in TRIAD3A would be extremely informative. We suggest that Arc misregulation may underlie cognitive deficits in these patients.
Although we hypothesized the role of TRIAD3A in dementia, does the loss of function of TRIAD3 lead to cerebellar ataxia, hypogonadotropism comorbid in patients with dementia? Experimental evidence demonstrated that knockdown of the TRIAD3 homolog in zebrafish by morpholino induced cerebellar disorganization, which could not be rescued by co‐expression of the R694C variant (Margolin et al., 2013). Moreover, Arc is reported to be required for synapse refinement in the developing mouse cerebellum, which potentially affects cerebellar function in controlling motor coordination (Mikuni et al., 2013). Given that TRIAD3A is expressed moderately in the cerebellum, testing whether the cerebellar‐specific ablation of TRIAD3A or cerebellar‐specific overexpression of Arc using conditional knockout or transgenic mice, respectively, can trigger defective motor behaviors or ataxia will be interesting. Moreover, the TRIAD3A variants have been proposed to affect gonadotropin‐releasing hormone (GnRH) secretion from the hypothalamus by the continuous activation and maintenance of NF‐κB signaling, resulting in hypogonadism (Chen et al., 2002; Miah et al., 2011; Margolin et al., 2013; Zhang et al., 2013).
In conclusion, the functional validation of TRIAD3A variants found in patients with dementia suggests that the deficits in Arc modulation and basal synaptic transmission potentially lead to cognitive decline.
Experimental procedures
Detailed information regarding electrophysiology, immunocytochemistry, co‐immunoprecipitation, in vivo ubiquitin assays, TIRFM, image acquisition, and animal behavior are included in Data S1 (Supporting information).
DNA and shRNA constructs
Mutations corresponding to C540X, R660C, and R694C were introduced into the pEGFP‐C3 TRIAD3A construct by site‐directed mutagenesis (Mabb et al., 2014), and into the pRK5‐FLAG TRIAD3A (human) construct, which was obtained from Dr. Tsung‐Hsien Chuang (Sanford‐Burnham Medical Research Institute). The corresponding R660A and R694A mutations were generated in the pRK5‐FLAG TRIAD3A construct. The TRIAD3A ΔCTD (1‐511), Δ(1‐ (512‐866), Δ(512‐ ((512‐866), and TRIAD3A‐R constructs were generated using pRK5‐FLAG TRIAD3A as a template. The Myc‐Arc and clathrin‐DsRed constructs were gifts from Dr. Paul Worley (Johns Hopkins University) (Chowdhury et al., 2006) and Dr. Jim Keen (Thomas Jefferson University), respectively. HA‐ubiquitin was a gift from Dr. Kah Leong Lim (National University of Singapore). All the mutations and truncations were verified by DNA sequencing. TRIAD3A‐sh and Scr lentiviral constructs (pLentilox 3.7) were generated as reported previously (Mabb et al., 2014).
Neuronal cell culture
Cortical neuronal cultures were prepared by dissecting out the cortices of E18 rat or E16 mouse embryos (SD rats, C57Bl6 mice, InVivos, Singapore). The cortices were dissociated and plated on poly‐L‐lysine (Sigma, St. Louis, Missouri, United States)‐coated 18‐mm coverslips at the desired density. These neurons were cultured in neurobasal medium (Invitrogen) containing B27 supplement (Invitrogen, Waltham, Massachusetts, United States), GlutaMAX (Invitrogen), and penicillin–streptomycin (Invitrogen). In addition, 5‐fluoro‐2′‐deoxyuridine (Sigma) was added to prevent glial proliferation. The neurons were transfected using a calcium phosphate transfection kit (Clontech, Mountain View, California, United States) according to the manufacturer's instructions. All procedures with rats were conducted in accordance with the protocol approved by the Institutional Animal Care and Use Committee (IACUC) of the Duke‐NUS Graduate Medical School. Human embryonic kidney (HEK293T) cells were cultured in DMEM (Gibco) containing 10% fetal bovine serum (Gibco, Waltham, Massachusetts, United States) and penicillin–streptomycin.
Animal surgery
All studies were conducted with protocols approved by the Institutional Animal Care and Use Committee (IACUC) of the Duke‐NUS Graduate Medical School.
For behavioral experiments, 5‐week‐old WT (C57Bl6/Ntac) mice were purchased from InVivos and housed in a vivarium for 2 weeks to acclimatize before carrying out stereotaxic surgery. Virus expressing either TRIAD3A‐sh or Scr shRNA was injected bilaterally into the CA1 region of the dorsal hippocampus using two coordinates: (i) AP + 1.5, ML ± 0.9, DV −2.0; and (ii) AP + 2.5, ML ± 1.9, DV −2.0. The animals were allowed to recover in their home cage for three weeks. The site of stereotaxic injections in all the mice was confirmed after completion of the behavioral experiments. Behavioral experiments were conducted on 3‐ to 6‐month‐old male C57Bl6 mice.
Statistical analysis
At least three experiments were performed independently under each experimental condition, and similar results were obtained. Statistical analyses were performed using Student's t‐test for comparison between two groups. ANOVA was performed to calculate differences among multiple means followed by Sidak's or Bonferroni's multiple comparison post hoc test. All data are presented as the mean and standard error of the mean (mean ± SEM). Statistical significance was defined when ****P < 0.0001, ***P < 0.001, **P < 0.01, *P < 0.05 compared with the control.
Conflict of interest
None declared.
Funding
This work was supported by the Singapore Ministry of Education (MOE) Academic Research Fund (MOE2014‐T2‐2‐071 to H.S.J.), National Medical Research Councel Collaborative Research Grant (NMRC/CBRG/0075/2014 to H.S.J.), and a Duke‐NUS Signature Research Program Block Grant (to H.S.J.), the SingHealth Foundation (# SHF/FG504P/2012 to Z.B.), an NNI Centre Grant (# NCG BF04 to Z.B.), a Johns Hopkins Alzheimer's Disease Research Center Grant (NIH P50AG05146 to O.P.), and a Khoo Postdoctoral Fellowship Award (Duke‐NUS‐KPFA/2015/0001 to N.H.).
Author contributions
N.H. designed and performed the biochemical experiments, stereotaxic viral injection, behavioral assays, and immunohistochemistry; Q.Y. contributed to ideas and designed and performed most of the experiments especially electrophysiological studies; Y.C.Y. performed behavioral assays and analyzed data; O.P. prepared and provided tissue samples; P.W. provided tissue samples and antibodies, supervised experiments, and edited the manuscript; D.Q.S. and Z.B. performed and analyzed the Morris water maze experiment; H.S.J. contributed to ideas and designed and supervised all experiments; N.H. and H.S.J. wrote the manuscript.
Supporting information
Data S1 Extended experimental methods.
Fig. S1 Overexpression of Arc‐KR restores Arc level when coexpressed with TRIAD3A.
Fig. S2 Validation of TRIAD3A shRNA and Rescue.
Fig. S3 The decrease in basal synaptic transmission by TRIAD3A knockdown is due to increased Arc protein levels.
Fig. S4 Triad3A knockdown in the CA1 region of mouse Hippocampus
Fig. S5 Open field test.
Fig. S6 TRIAD3A alanine variants neither interacted with Arc not promoted its ubiquitination.
Fig. S7 TRIAD3A variants were not colocalized with clathrincoated pits.
Fig. S8 Original western blot images for Figure 6B.
Fig. S9 Original western blot images for Figure S6A.
Table S1 Results of statistical analyses.
Acknowledgments
We thank Dr. Weiping Han for generously providing TIRF microscopes. We would like to thank Dr. Zeng Li for her help with obtaining samples. We thank Drs. David Virshup, Shirish Shenolikar, and Jaewon Ko for their critical comments on the manuscript.
References
- Abs R, Van Vleymen E, Parizel PM, Van Acker K, Martin M, Martin JJ (1990) Congenital cerebellar hypoplasia and hypogonadotropic hypogonadism. J. Neurol. Sci. 98, 259–265. [DOI] [PubMed] [Google Scholar]
- Alqwaifly M, Bohlega S (2016) Ataxia and hypogonadotropic hypogonadism with intrafamilial variability caused by RNF216 mutation. Neurol. Int. 8, 6444. [DOI] [PMC free article] [PubMed] [Google Scholar]
- Berciano J, Amado JA, Freijanes J, Rebollo M, Vaquero A (1982) Familial cerebellar ataxia and hypogonadotropic hypogonadism: evidence for hypothalamic LHRH deficiency. J. Neurol. Neurosurg. Psychiatry 45, 747–751. [DOI] [PMC free article] [PubMed] [Google Scholar]
- Chen D, Li X, Zhai Z, Shu HB (2002) A novel zinc finger protein interacts with receptor‐interacting protein (RIP) and inhibits tumor necrosis factor (TNF)‐ and IL1‐induced NF‐kappa B activation. J. Biol. Chem. 277, 15985–15991. [DOI] [PubMed] [Google Scholar]
- Chowdhury S, Shepherd JD, Okuno H, Lyford G, Petralia RS, Plath N, Kuhl D, Huganir RL, Worley PF (2006) Arc/Arg3.1 interacts with the endocytic machinery to regulate AMPA receptor trafficking. Neuron 52, 445–459. [DOI] [PMC free article] [PubMed] [Google Scholar]
- Chuang TH, Ulevitch RJ (2004) Triad3A, an E3 ubiquitin‐protein ligase regulating Toll‐like receptors. Nat. Immunol. 5, 495–502. [DOI] [PubMed] [Google Scholar]
- Cooper DN, Ball EV, Krawczak M (1998) The human gene mutation database. Nucleic Acids Res. 26, 285–287. [DOI] [PMC free article] [PubMed] [Google Scholar]
- DeKosky ST, Scheff SW, Styren SD (1996) Structural correlates of cognition in dementia: quantification and assessment of synapse change. Neurodegeneration 5, 417–421. [DOI] [PubMed] [Google Scholar]
- Ganos C, Hersheson J, Adams M, Bhatia KP, Houlden H (2015) The 4H syndrome due to RNF216 mutation. Parkinsonism Relat. Disord. 21, 1122–1123. [DOI] [PubMed] [Google Scholar]
- Greer PL, Hanayama R, Bloodgood BL, Mardinly AR, Lipton DM, Flavell SW, Kim TK, Griffith EC, Waldon Z, Maehr R, Ploegh HL, Chowdhury S, Worley PF, Steen J, Greenberg ME (2010) The Angelman Syndrome protein Ube3A regulates synapse development by ubiquitinating arc. Cell 140, 704–716. [DOI] [PMC free article] [PubMed] [Google Scholar]
- Holmes G (1907) A form of familial degeneration of the cerebellum. Brain 30, 466–489. [Google Scholar]
- Keller JN, Hanni KB, Markesbery WR (2000) Impaired proteasome function in Alzheimer's disease. J. Neurochem. 75, 436–439. [DOI] [PubMed] [Google Scholar]
- Krawczak M, Ball EV, Cooper DN (1998) Neighboring‐nucleotide effects on the rates of germ‐line single‐base‐pair substitution in human genes. Am. J. Hum. Genet. 63, 474–488. [DOI] [PMC free article] [PubMed] [Google Scholar]
- Lacor PN, Buniel MC, Chang L, Fernandez SJ, Gong Y, Viola KL, Lambert MP, Velasco PT, Bigio EH, Finch CE, Krafft GA, Klein WL (2004) Synaptic targeting by Alzheimer's‐related amyloid beta oligomers. J. Neurosci. 24, 10191–10200. [DOI] [PMC free article] [PubMed] [Google Scholar]
- Lee SH, Choi JH, Lee N, Lee HR, Kim JI, Yu NK, Choi SL, Lee SH, Kim H, Kaang BK (2008) Synaptic protein degradation underlies destabilization of retrieved fear memory. Science 319, 1253–1256. [DOI] [PubMed] [Google Scholar]
- Lopez‐Salon M, Alonso M, Vianna MR, Viola H, Mello e Souza T, Izquierdo I, Pasquini JM, Medina JH (2001) The ubiquitin‐proteasome cascade is required for mammalian long‐term memory formation. Eur. J. Neuorsci. 14, 1820–1826. [DOI] [PubMed] [Google Scholar]
- Kleinknecht KR, Bedenk BT, Kaltwasser SF, Grunecker B, Yen YC, Czisch M, Wotjak CT (2012) Hippocampus‐dependent place learning enables spatial flexibility in C57BL6/N mice. Frontiers in behavioral neuroscience 6, 87. [DOI] [PMC free article] [PubMed] [Google Scholar]
- Mabb AM, Je HS, Wall MJ, Robinson CG, Larsen RS, Qiang Y, Correa SA, Ehlers MD (2014) Triad3A regulates synaptic strength by ubiquitination of Arc. Neuron 82, 1299–1316. [DOI] [PMC free article] [PubMed] [Google Scholar]
- Margolin DH, Kousi M, Chan YM, Lim ET, Schmahmann JD, Hadjivassiliou M, Hall JE, Adam I, Dwyer A, Plummer L, Aldrin SV, O'Rourke J, Kirby A, Lage K, Milunsky A, Milunsky JM, Chan J, Hedley‐Whyte ET, Daly MJ, Katsanis N, Seminara SB (2013) Ataxia, dementia, and hypogonadotropism caused by disordered ubiquitination. N. Engl. J. Med. 368, 1992–2003. [DOI] [PMC free article] [PubMed] [Google Scholar]
- McNaught KS, Belizaire R, Isacson O, Jenner P, Olanow CW (2003) Altered proteasomal function in sporadic Parkinson's disease. Exp. Neurol. 179, 38–46. [DOI] [PubMed] [Google Scholar]
- Miah SM, Purdy AK, Rodin NB, MacFarlane AWT, Oshinsky J, Alvarez‐Arias DA, Campbell KS (2011) Ubiquitylation of an internalized killer cell Ig‐like receptor by Triad3A disrupts sustained NF‐kappaB signaling. J. Immunol. 186, 2959–2969. [DOI] [PMC free article] [PubMed] [Google Scholar]
- Mikuni T, Uesaka N, Okuno H, Hirai H, Deisseroth K, Bito H, Kano M (2013) Arc/Arg3.1 is a postsynaptic mediator of activity‐dependent synapse elimination in the developing cerebellum. Neuron 78, 1024–1035. [DOI] [PMC free article] [PubMed] [Google Scholar]
- Morris R (1984) Developments of a water‐maze procedure for studying spatial learning in the rat. Journal of neuroscience methods 11, 47‐60. [DOI] [PubMed] [Google Scholar]
- Pasqualetti G, Brooks DJ, Edison P (2015) The role of neuroinflammation in dementias. Curr. Neurol. Neurosci. Rep. 15, 17. [DOI] [PubMed] [Google Scholar]
- Peebles CL, Yoo J, Thwin MT, Palop JJ, Noebels JL, Finkbeiner S (2010) Arc regulates spine morphology and maintains network stability in vivo. Proc. Natl Acad. Sci. USA 107, 18173–18178. [DOI] [PMC free article] [PubMed] [Google Scholar]
- Perez‐Cruz C, Nolte MW, van Gaalen MM, Rustay NR, Termont A, Tanghe A, Kirchhoff F, Ebert U (2011) Reduced spine density in specific regions of CA1 pyramidal neurons in two transgenic mouse models of Alzheimer's disease. J. Neurosci. 31, 3926–3934. [DOI] [PMC free article] [PubMed] [Google Scholar]
- Rosi S, Ramirez‐Amaya V, Vazdarjanova A, Worley PF, Barnes CA, Wenk GL (2005) Neuroinflammation alters the hippocampal pattern of behaviorally induced Arc expression. J. Neurosci. 25, 723–731. [DOI] [PMC free article] [PubMed] [Google Scholar]
- Rosso SM, Kamphorst W, de Graaf B, Willemsen R, Ravid R, Niermeijer MF, Spillantini MG, Heutink P, van Swieten JC (2001) Familial frontotemporal dementia with ubiquitin‐positive inclusions is linked to chromosome 17q21‐22. Brain 124, 1948–1957. [DOI] [PubMed] [Google Scholar]
- Santens P, Van Damme T, Steyaert W, Willaert A, Sablonniere B, De Paepe A, Coucke PJ, Dermaut B (2015) RNF216 mutations as a novel cause of autosomal recessive Huntington‐like disorder. Neurology 84, 1760–1766. [DOI] [PubMed] [Google Scholar]
- Sawyer SL, Schwartzentruber J, Beaulieu CL, Dyment D, Smith A, Warman Chardon J, Yoon G, Rouleau GA, Suchowersky O, Siu V, Murphy L, Hegele RA, Marshall CR, Consortium FC, Bulman DE, Majewski J, Tarnopolsky M, Boycott KM (2014) Exome sequencing as a diagnostic tool for pediatric‐onset ataxia. Hum. Mutat. 35, 45–49. [DOI] [PMC free article] [PubMed] [Google Scholar]
- Seminara SB, Acierno JS Jr, Abdulwahid NA, Crowley WF Jr, Margolin DH (2002) Hypogonadotropic hypogonadism and cerebellar ataxia: detailed phenotypic characterization of a large, extended kindred. J. Clin. Endocrinol. Metab. 87, 1607–1612. [DOI] [PubMed] [Google Scholar]
- Seo H, Sonntag KC, Isacson O (2004) Generalized brain and skin proteasome inhibition in Huntington's disease. Ann. Neurol. 56, 319–328. [DOI] [PubMed] [Google Scholar]
- Shepherd JD, Rumbaugh G, Wu J, Chowdhury S, Plath N, Kuhl D, Huganir RL, Worley PF (2006) Arc/Arg3.1 mediates homeostatic synaptic scaling of AMPA receptors. Neuron 52, 475–484. [DOI] [PMC free article] [PubMed] [Google Scholar]
- Thornton JM (1981) Disulphide bridges in globular proteins. J. Mol. Biol. 151, 261–287. [DOI] [PubMed] [Google Scholar]
- Waung MW, Pfeiffer BE, Nosyreva ED, Ronesi JA, Huber KM (2008) Rapid translation of Arc/Arg3.1 selectively mediates mGluR‐dependent LTD through persistent increases in AMPAR endocytosis rate. Neuron 59, 84–97. [DOI] [PMC free article] [PubMed] [Google Scholar]
- Weder ND, Aziz R, Wilkins K, Tampi RR (2007) Frontotemporal dementias: a review. Ann. Gen. Psychiatry 6, 15. [DOI] [PMC free article] [PubMed] [Google Scholar]
- Wu J, Petralia RS, Kurushima H, Patel H, Jung MY, Volk L, Chowdhury S, Shepherd JD, Dehoff M, Li Y, Kuhl D, Huganir RL, Price DL, Scannevin R, Troncoso JC, Wong PC, Worley PF (2011) Arc/Arg3.1 regulates an endosomal pathway essential for activity‐dependent beta‐amyloid generation. Cell 147, 615–628. [DOI] [PMC free article] [PubMed] [Google Scholar]
- Zhang G, Li J, Purkayastha S, Tang Y, Zhang H, Yin Y, Li B, Liu G, Cai D (2013) Hypothalamic programming of systemic ageing involving IKK‐beta, NF‐kappaB and GnRH. Nature 497, 211–216. [DOI] [PMC free article] [PubMed] [Google Scholar]
Associated Data
This section collects any data citations, data availability statements, or supplementary materials included in this article.
Supplementary Materials
Data S1 Extended experimental methods.
Fig. S1 Overexpression of Arc‐KR restores Arc level when coexpressed with TRIAD3A.
Fig. S2 Validation of TRIAD3A shRNA and Rescue.
Fig. S3 The decrease in basal synaptic transmission by TRIAD3A knockdown is due to increased Arc protein levels.
Fig. S4 Triad3A knockdown in the CA1 region of mouse Hippocampus
Fig. S5 Open field test.
Fig. S6 TRIAD3A alanine variants neither interacted with Arc not promoted its ubiquitination.
Fig. S7 TRIAD3A variants were not colocalized with clathrincoated pits.
Fig. S8 Original western blot images for Figure 6B.
Fig. S9 Original western blot images for Figure S6A.
Table S1 Results of statistical analyses.