Abstract
Intramuscular fat deposition or marbling is essential for high quality beef. The molecular mechanism of adipogenesis in skeletal muscle remains largely unknown. In this study, we isolated Platelet-derived growth factor receptor α (PDGFRα) positive progenitor cells from fetal bovine skeletal muscle and induced into adipocytes. Using miRNAome sequencing, we revealed that bta-miR-23a was an adipogenic miRNA mediating bovine adipogenesis in skeletal muscle. The expression of bta-miR-23a was down-regulated during differentiation of PDGFRα+ progenitor cells. Forced expression of bta-miR-23a mimics reduced lipid accumulation and inhibited the key adipogenic transcription factor peroxisome proliferative activated receptor gamma (PPARγ) and CCAAT/enhancer binding protein alpha (C/EBPα). Whereas down-regulation of bta-miR-23a by its inhibitors increased lipid accumulation and expression of C/EBPα, PPARγ and fatty acid-binding protein 4 (FABP4). Target prediction analysis revealed that ZNF423 was a potential target of bta-miR-23a. Dual-luciferase reporter assay revealed that bta-miR-23a directly targeted the 3′-UTR of ZNF423. Together, our data showed that bta-miR-23a orchestrates early intramuscular adipogeneic commitment as an anti-adipogenic regulator which acts by targeting ZNF423.
Fetal stage is a crucial period for both skeletal muscle development and intramuscular preadipocyte formation1. During early skeletal muscle development, myogenic cells and intramuscular adipocyte are commonly derived from mesenchymal stem cells (MSCs) in embryonic mesoderm2,3. Parts of the MSCs firstly differentiate into either myogenic or non-myogenic lineages. The non-myogenic lineage progenitor cells have adipogenic and fibrogenic potential, as well as osteogenic and chondrogenic capacity4,5. Most of the non-myogenic progenitor cells subsequently differentiate into adipocytes and fibroblasts, while the others reside in the stromal-vascular fraction of mature skeletal muscle tissue without differentiation, forming the progenitor pool6. Platelet-derived growth factor receptor α (PDGFRα) is a specific surface marker of these non-myogenic progenitor cells7. Intramuscular adipogenesis from progenitor cells in prenatal stage provides the fat deposition sites for postnatal intramuscular fat (IMF) formation.
Adipogenesis is divided into commitment and differentiation. Several critical transcriptional factors (TFs) have been demonstrated to mediate adipogenesis commitment and differentiation. Using preadipocytes model, two TFs, CCAAT/enhancer binding protein alpha (C/EBPα) and peroxisome proliferative activated receptor gamma (PPARγ), were characterized as the crucial regulators of adipogenesis differentiation8,9. C/EBPα and PPARγ reinforce each other’s expression. Activation of these factors promote adipogenesis and increase lipid accumulation in cells10. PPARγ also plays the central role in bovine IMF adipogenesis11. C/EBPα and PPARγ expression in skeletal muscle are greater in the cattle breed with higher IMF deposition capacity12. Zinc finger protein 423 (ZNF423, also known as ZFP423) was identified as another important regulator and involved in both adipogenic commitment of progenitor cells and PPARγ activation13. Stromal vascular cells expressing ZNF423 have robust adipogenesis potential14. Overexpressing ZNF423 in vitro promoted the MEFs adipogenesis15. In farm animal, ZNF423 could promote adipogenic differentiation in bovine skeletal muscle derived stromal vascular cells16.
Adipogenesis is also under post-translational regulation by microRNAs (miRNAs). miRNAs are small non-coding RNAs (nc-RNAs) with an average length of 22 nucleotides(nt). Mature miRNAs interact with target mRNAs at specific sites of 3′ untranslated regions (3′UTR) by base pairing. A single miRNA can have one to several hundred target mRNAs, meanwhile a single mRNA can have multiple miRNA binding sites in 3′UTR17. The binding sites of miRNAs often evolutionarily conserved, especially between bases 2–8 of their 5′ end (seed sequence)17. miRNAs bind to target mRNAs and induce their translational repression and/or deadenylation18,19. Being the key regulation factors, miRNAs play crucial roles in various biological process such as cell growth, differentiation and development. Many miRNAs are expressed in a tissue-specific20 and/or stage-specific manner21. A series of miRNAs including miR-27a/b, miR-143, miR-448, miR-130 and let-7, have been reported regulating adipogenesis in mice or human22,23,24,25,26. However, limited miRNAs have been reported to modulate adipogenesis in cattle27. Furthermore, although the miRNAs expression profiles in bovine subcutaneous fat and IMF have been characterized28,29,30, little research focused on the miRNAs expression characteristic of early IMF development in prenatal stage. Since the important role in fetal development and its profound impact on IMF deposition, the objective of this study is to characterize the miRNAome expression profile during adipogenesis and determine their role in adipogenic differentiation of bovine progenitor cells. Of note, the significance of this study is to help understand how miRNA regulated intramuscular development during fetal stage in bovine.
Results
PDGFRα+ progenitor cells isolation and adipogenic differentiation
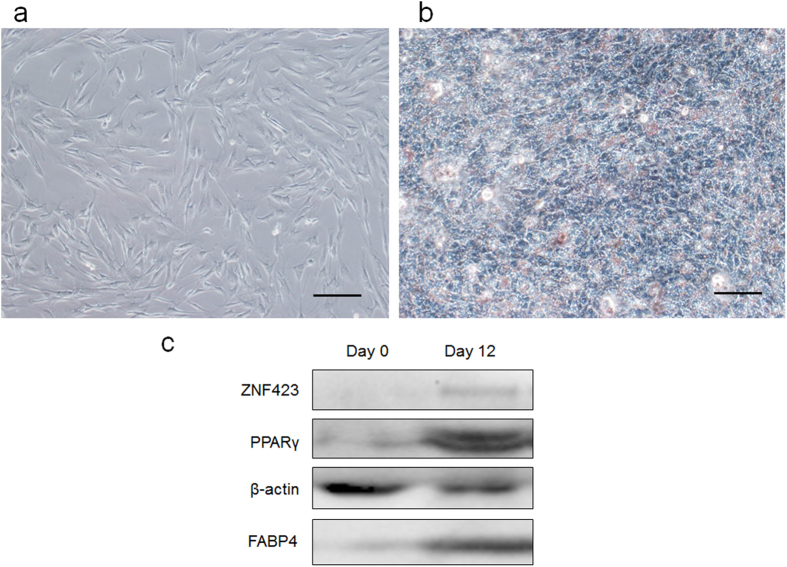
The primary cells isolated from the fetal skeletal muscle tissue adhered to the culture plates and began to elongate after 24 h. Approximately 3 days later, the cells exhibited a shuttle shape and grew to reach 70–80% confluence (Fig. 1a). The cell bodies appeared to have strong refraction.
Figure 1. Adipogenic differentiation in PDGFRα+ progenitor cells.
(a) PDGFRα+ progenitor cells isolated from bovine fetal skeletal muscle tissue. Scale bar, 100 μm. (b) Oil Red O staining of PDGFRα+ progenitor cells after adipogenic differentiation. Scale bar, 100 μm. (c) Immunoblot analysis of white adipogenic markers before or after differentiation, n = 3.
After adipogenic differentiation, most of the cells changed from the shuttle shape into an oblate shape during the first 4 days. On the 6th day of induction, lipid microdroplets could be observed in some cells under microscope. The amount of lipid droplets increased in a time-dependent manner, and lipid microdroplets aggregated and fused to form larger droplets in this process (Fig. 1b). The results of Oil Red O staining indicated the presence of lipid in the cells at 4 days after induction. Immunoblotting data showed that adipocyte-specific markers ZNF423, PPARγ and fatty acid-binding protein (FABP4) significantly increased after differentiation (Fig. 1c).
Small RNAs sequencing and identification of conserved miRNAs
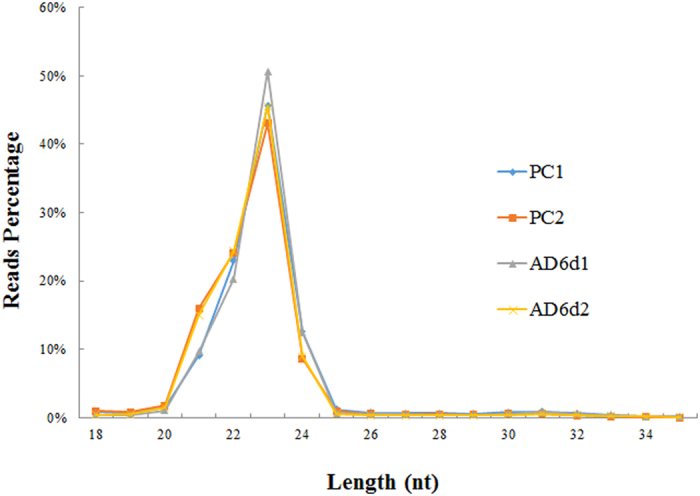
To isolate the miRNAs functioning in adipogenesis, total RNA was extracted from progenitor cells (PC) and cells at day 6 of differentiation (AD6d). After generating the libraries, two datasets were obtained from PC and AD6d (PC1, 9232752 reads; PC2, 8451410 reads; AD6d1, 7672984 reads; AD6d2, 10241514 reads), respectively. Clean reads (about 97% of total reads) were obtained by trimming 3′ adapter sequence, and removing the reads containing ploy-N, with 5′ adapter contaminants, without 3′ adapter or the insert tag, containing poly A, T, G or C and low quality reads from raw data (Table 1). Then, the reads were classified by length as shown in Fig. 2. The most abundant size for miRNAs was 21–24 nucleotides. However, only miRNAs with a length range of 18–35 nt from clean reads were filtered for further downstream analyses. Subsequently, the small RNA tags were mapped to bovine reference sequence without mismatch using Bowtie. miRBase21 was used to identify conserved miRNAs as reference in mapped tags. The numbers of miRNA reads were normalized by Tags per million (TPM) values (TPM = (readCount*1,000,000)/libsize) to express miRNAs in PC and AD6d comparable in one table.
Table 1. Parameters of small RNA sequences.
| Samples | Reads type | Reads Number | Percentage |
|---|---|---|---|
| PC1 | total reads | 9232752 | 100.00% |
| N% > 10% | 59 | 0.00% | |
| low quality | 26531 | 0.29% | |
| 5 adapter contamine | 933 | 0.01% | |
| 3 adapter null or insert null | 166114 | 1.80% | |
| with polyA/T/G/C | 5904 | 0.06% | |
| clean reads | 9033211 | 97.84% | |
| PC2 | total reads | 8451410 | 100.00% |
| N% > 10% | 42 | 0.00% | |
| low quality | 18874 | 0.22% | |
| 5 adapter contamine | 369 | 0.00% | |
| 3 adapter null or insert null | 116958 | 1.38% | |
| with polyA/T/G/C | 5242 | 0.06% | |
| clean reads | 8309925 | 98.33% | |
| AD6d1 | total reads | 6409684 | 100.00% |
| N% > 10% | 73 | 0.00% | |
| low quality | 15108 | 0.24% | |
| 5 adapter contamine | 196 | 0.00% | |
| 3 adapter null or insert null | 131490 | 2.05% | |
| with polyA/T/G/C | 2516 | 0.04% | |
| clean reads | 6260301 | 97.67% | |
| AD6d2 | total reads | 6539308 | 100.00% |
| N% > 10% | 61 | 0.00% | |
| low quality | 13115 | 0.20% | |
| 5 adapter contamine | 193 | 0.00% | |
| 3 adapter null or insert null | 333540 | 5.10% | |
| with polyA/T/G/C | 2455 | 0.04% | |
| clean reads | 6189944 | 94.66% |
Figure 2. Length distribution of small RNA reads in PC and AD6d libraries.
Identification of differentially expressed miRNAs after adipogenic differentiation
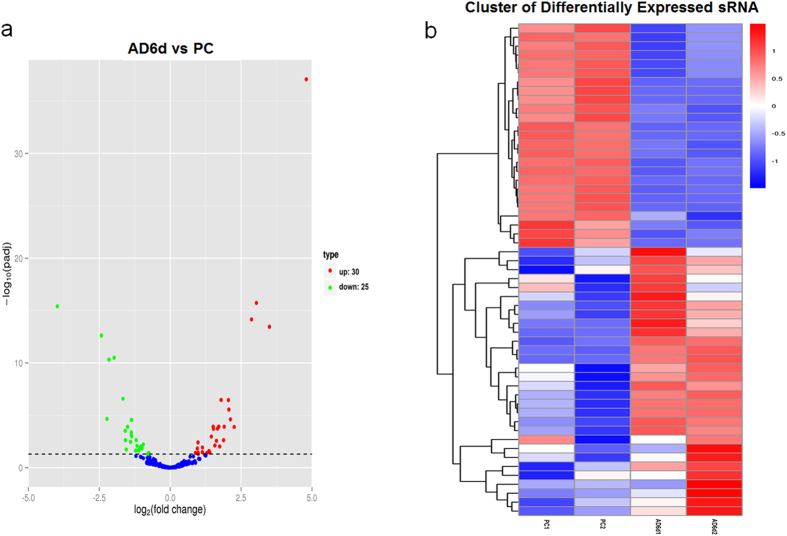
Differentially expressed conserved miRNAs between non-differentiated group (PC) and differentiating group (AD6d) were analyzed using DESeq R package. Based on the negative binomial distribution, volcano plot was generated to show the normalized miRNA expression levels (Fig. 3). We employed hierarchical cluster to analyze differentially expressed miRNAs of all samples (Fig. 3). Among the 55 differentially expressed miRNAs, 30 miRNAs were up-regulated and 25 miRNAs were down-regulated after adipogenic induction (Supplementary Table 1).
Figure 3. Differentially expressed miRNAs.
(a) Differentially expressed miRNAs in volcano plot. The X-axis stands for the fold change of miRNAs. The Y-axis stands for significant difference of miRNA expression changes. Every miRNA are represented with the dots. The blue dots indicate miRNAs without significant difference; The red dots indicate up-regulated miRNAs; The green dots stand for down-regulated miRNAs. (b) Hierarchical clustering of miRNA expression. miRNA profiles from four libraries were clustered. Samples are in columns, and miRNAs are in rows. Cluster analysis based on log10 (TPM+ 1). The red indicates up-regulated miRNAs, and the blue indicates down-regulated miRNAs.
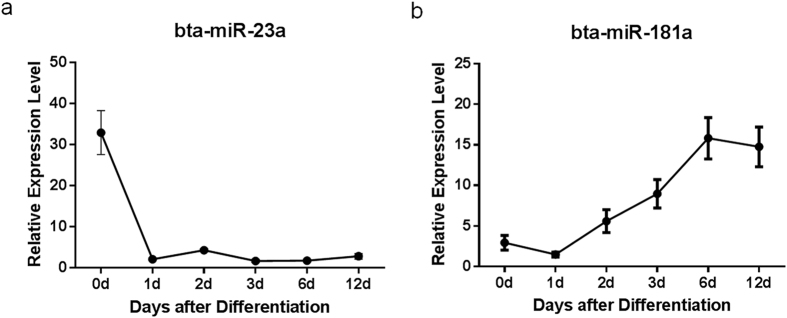
To validate the differentially expressed miRNAs, we selected bta-miR-181a, an up-regulated miRNA, and bta-miR-23a, a down-regulated miRNA to assay their expression levels during differentiation. Their expression during d0 to d12 of differentiation was quantified (Fig. 4). bta-miR-23a expression decreased substantially 1 day after induction and kept a relative low level in the following differentiation. In contrast, bta-miR-181a expression gradually increased from induction and kept at relative high level after day 6.
Figure 4. Expression of bta-miR-23a and bta-miR-181a during adipogenic differentiation.
Quantitative RT-PCR assays of bta-miR-23a (a) and bta-miR-181a (b) expression in progenitor cells throughout differentiation. Data are representative of three independent experiments and given as means ± S.E.M. n = 3.
miR-23a inhibits adipogenic differentiation of PDGFRα+ progenitor cells
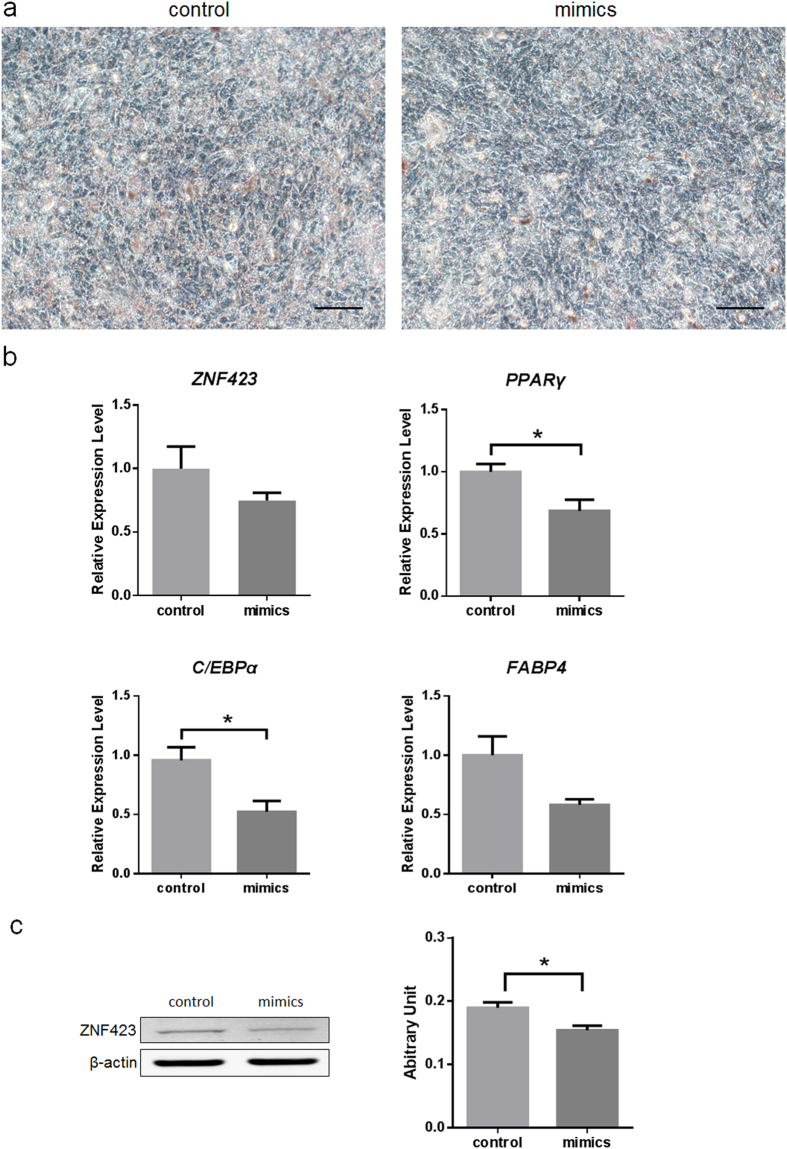
To investigate the roles of miR-23a in adipogenesis, PDGFRα+ progenitor cells were transfected with exogenous miR-23a mimics and induced adipogenic differentiation. Twelve days after induction, cells were conducted by Oil Red O staining. Compared with the negative control mimics group, PDGFRα+ progenitor cells transfected miR-23a mimics group exhibited inhibited lipid accumulation (Fig. 5a). mRNA expression of PPARγ and C/EBPα were also suppressed by the exogenous miR-23a, but ZNF423 FABP4 expression was not different (Fig. 5b). Immunoblotting data showed that ZNF423 protein level was lower at day 12 in cells transfected miR-23a mimics (Fig. 5c).
Figure 5. miR-23a inhibits adipogenic differentiation in PDGFRα+ progenitor cells.
(a) Oil Red O staining of PDGFRα+ progenitor cells transfected either control or mimics at day 12. Scale bar, 100 μm. (b) mRNA expression of adipogenic markers at day 6. Data are presented as the means ± S.E.M. Three independent experiments are conducted in PDGFRα+ progenitor cells. *P < 0.05. All the values were expressed relative to the control. (c). Immunoblot analysis of ZNF423 protein at day 12 after transfected with miR-23a mimics.
Inhibiting miR-23a promotes adipogenic differentiation of PDGFRα+ progenitor cells
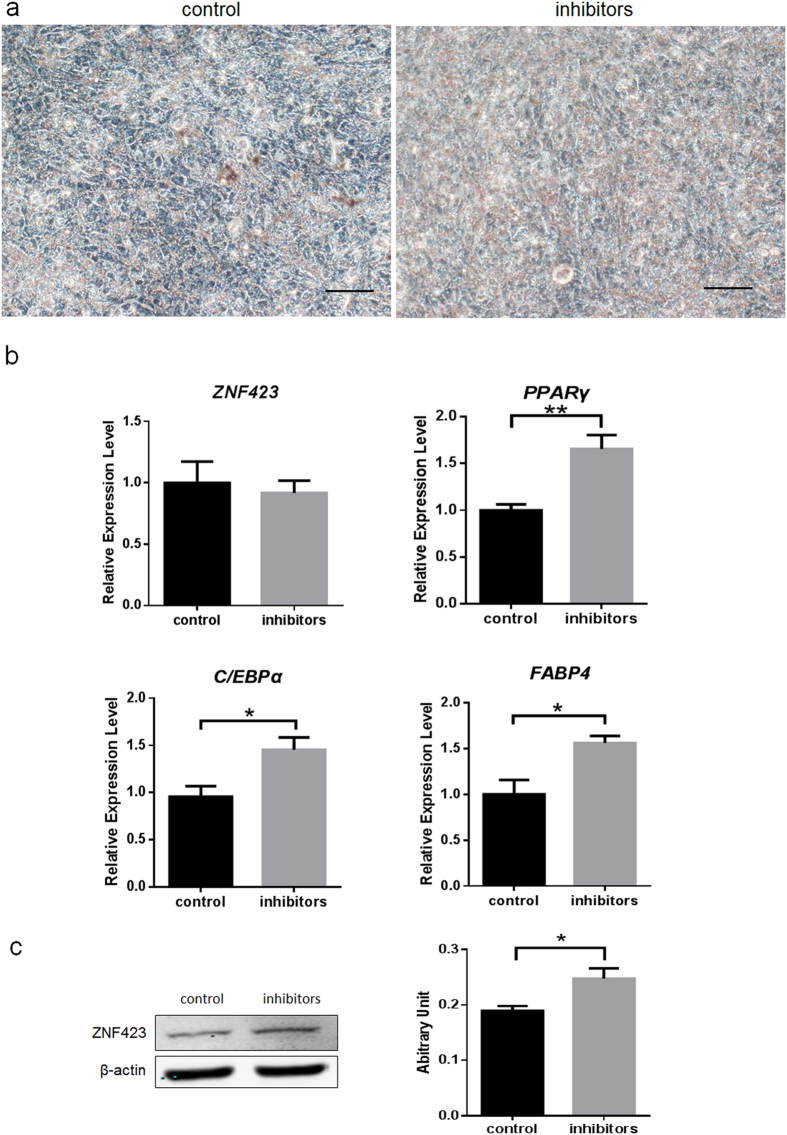
To further explore the function of miR-23a in adipocyte differentiation, endogenous miR-23a was knockdown by anti-miR-23a transfection at the same time of adipogenic differentiation. After 12 days differentiation, lipid accumulation was significantly increased in anti-miR-23a transfected cells compared to the control group (Fig. 6a). qRT-PCR assay showed that ZNF423 mRNA expression did not change after miR-23a inhibitors transfection, while C/EBPα, PPARγ and FABP4 expression increased significantly (p < 0.01 for PPARγ, p < 0.05 for C/EBPα and FABP4) (Fig. 6b). Immunoblotting assay showed that ZNF423 protein content was enhanced at day 12 after transfected miR-23a inhibitors (Fig. 6c).
Figure 6. miR-23a inhibits adipogenic differentiation in PDGFRα+ progenitor cells.
(a). Oil Red O staining of PDGFRα+ progenitor cells transfected either control or inhibitors at day 12. Scale bar, 100 μm. (b). mRNA expression of adipogenic markers at day 6. Expression levels were normalized using 18S. Data are presented as the means ± S.E.M. Three independent experiments are conducted in PDGFRα+ progenitor cells. *P < 0.05, **P < 0.01. All the values were expressed relative to the control. (c). Immunoblot analysis of ZNF423 protein at day 12 after transfected miR-23a mimics.
Prediction and annotation of miRNA target genes
The targets of bta-miR-23a were predicted using TargetScan. The results showed ZNF423 was a potential target of miR-23a which could bind through a conserved site.
miR-23a directly targets ZNF423 in adipogenic differentiation
To investigate whether ZNF423 is a direct target of miR-23a, we constructed two luciferase reporter plasmids containing either the wild-type or mutant 3′-UTR of ZNF423 (Fig. 7a). The luciferase reporters were co-transfected with miR-23a mimics or negative control into 293 T cell line. miR-23a significantly reduced Renilla luciferase activity of the wild-type ZNF423 reporter compared with the negative control, while the change was not detected in the mutant luciferase reporter (Fig. 7b). These results demonstrated that miR-23a could directly target the ZNF423 3′-UTR.
Figure 7. ZNF423 is a novel target of miR-23a.
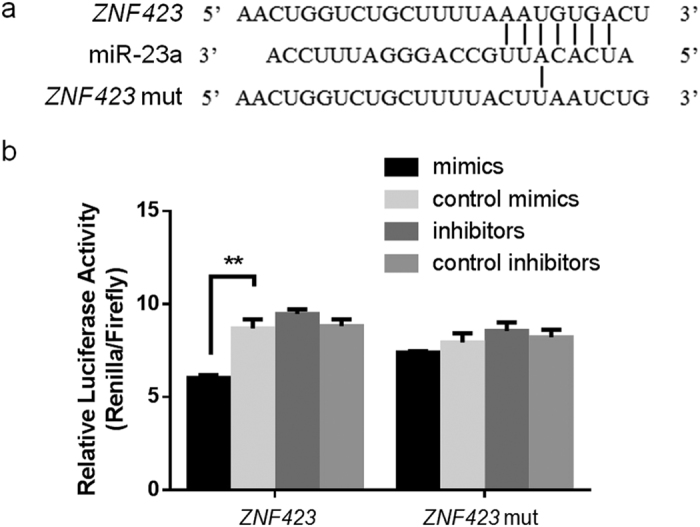
(a) Sequences of miR-23a recognition region predicted by the Targetscan and miRanda program in the 3′ UTR of ZNF423. (b) Luciferase activities of reporter plasmids with wild type or mutated ZNF423 3′ UTR were examined in 293T cells by transfecting miR-23a, control mimics or control inhibitors. Data are means ± S.E.M. and were analyzed using Student’s t-test. (**P < 0.01).
Discussion
Skeletal muscle is a rather complicated organ that contains various stem cell types. Satellite cell is the first identified muscle-derived stem cell and resided between the basement membrane and sarcolemma of myofiber31. Satellite cells stay in quiescent, but have capacity to fuse with muscle fiber when they are activated32, which is important for postnatal skeletal muscle growth33 and skeletal muscle regeneration in adulthood34,35. However, satellite cells derive from myogenic progenitor cells and do not have adipogenic potential7. Another type of muscle-derived stem cell with adipogenic and fibrogenic potentials is located in the stromal-vascular fraction of skeletal muscle. These adipogenic/fibrogenic progenitor cells developed from non-myogenic lineage and are capable of differentiating into IMF7,36. Although IMF is detectable as early as 180 days of gestation in bovine fetuses, adipogenic progenitor cells might differentiate from myogenic progenitor cells at an earlier time37. We used PDGFRα (also named CD140a) as a positive surface marker to sort the adipogenic/fibrogenic progenitor cells. PDGFRα+ progenitor cells were successfully induced to differentiate into adipocytes, which provided anin vitro model to study bovine IMF differentiation.
Next, we investigated the miRNAome expression in bovine PDGFRa+ cells during adipogenic differentiation. Totally, we isolated 55 miRNAs differentially expressed between un-differentiated and differentiating progenitor cells. The partial of these miRNAs have been identified as being associated with adipogenesis. miR-210 expression level was dramatically upregulated during 3T3-L1 adipogenesis38. miRNA-181a positively regulate adipogenesis by targeting tumor necrosis factor-α (TNF-α) in the porcine model39. During adipogenesis of human adipose tissue-derived mesenchymal stem cells, miR-221 was down-regulated40. In the present study, we found that bta-miR-23a was down-regulated during bovine adipogenesis. Using overexpression exogenous mimics or inhibitors of miR-23a, we demonstrated that miR-23a inhibited adipogenesis of PDGFRα+ progenitor cells. miR-23a is transcribed from miR-23a/27a/24–2 cluster, and processed into mature miRNAs41. The other two members of miR-23a/27a/24-2 cluster were also found down-regulated during adipogenesis. In addition, miR-27a has been reported regulating adipogenesis via targeting PPARγ42. miR-23a was also reported to regulate adipogenesis in 3T3-L1 cells and down-regulated during adipogenesis, but the mechanism was not clarified43. Here, for the first time, we report that miR-23a is a negative regulator in bovine adipogenesis by inhibiting ZNF423 expression.
ZNF423 was identified as a key transcriptional regulator of preadipocyte determination. ZNF423 regulates PPARγ expression, in part, through amplification of the bone morphogenic protein (BMP) signaling pathway, an effect dependent on the SMAD-binding capacity of ZNF42313. Also, ZNF423 is a critical regulator of adipogenesis in stromal vascular cells (SVCs) of bovine muscle16. Although mechanism of transcriptional activation of ZNF423 is not clear yet, several molecules and epigenetic modification are identified involving in the ZNF423 regulation. ZNF521 inhibit ZNF423 directly by mediating a BMP-dependent osteoblast versus adipocyte lineage commitment switch44. WISP2 can prevent ZNF423 from entering nucleus by forming complex with ZNF42345. DNA methylation and histone methylation (H3K27me3) was also related with ZNF423 expression15. So far miR-195a is the only experimentally demonstrated miRNA which targets ZNF42346. In this study, we found a new post-transcriptional regulation mechanism of ZNF423 via microRNAs.
miR-23a has been reported with the capacity of targeting crucial proteins which regulate stem cell fate in differentiation. miR-23a is an important regulator in both osteogenesis and chondrogenesis47,48. miR-23a, which is also down-regulated during differentiation of embryonic stem cells, suppresses differentiation toward the endoderm and ectoderm lineages49. miR-23a also involves in the early neural differentiation by regulating Musashi1 and cyclin D150,51 as well as erythropoiesis52. In this study we identified miR-23a as a regulator in early adipogenic differentiation, providing additional evidence for the biological roles of miR-23a in cell fate determination.
Because of the interaction of miR-23a and ZNF423, miR-23a may also potentially regulate energy metabolism and involve in the etiology metabolic diseases. In a previous study, miR-23a was isolated as a biomarker of type 2 diabetes (T2D) by comparing the serum miRNAome expression of T2D patients, pre-T2D patients and normal people53. This provided early diagnosis potential for the people with T2D risks. In obese individuals, a high efflux of glycerol from accumulated fat in adipose tissue into the liver is known to be associated with the development of T2D. Aquaporin 9 (AQP9) is an aquaglyceroporin family member which serves as the primary route of hepatic glycerol uptake for gluconeogenesis. miR-23a regulates glycerol-dependent gluconeogenesis by targeting AQP954. Furthermore, miR-23a expression is down-regulated in human subcutaneous fat of obese individuals compared with lean individuals55. miR-23a is also differentially expressed in visceral adipose tissue between non-alcoholic steatohepatitis (NASH) and non-NASH patients56. Based on these findings, miR-23a is a potential biomarker of metabolism diseases. However, the biological role of miR-23a in occurrence and development of metabolism-related diseases remains to be explored.
To our knowledge, this is the first study to investigate the miRNA profiling during bovine IMF differentiation. These studies pave a new way to gain a better understanding of the regulation of miRNAs in bovine IMF development.
Methods
Ethics statement
Animal experiments were conducted according to the guidelines established by the Regulations for the Administration of Affairs Concerning Experimental Animals (Ministry of Science and Technology, China, 2004). All animal protocols were approved by Animal Ethics Committee of Institute of Animal Sciences, Chinese Acadamy of Agricultrual Sciences. Pregnant cows were raised in Xinrui Agriculture Co., Ltd (Weichang, China). All efforts were made to minimize the cow’s suffering.
Progenitor cells isolation and culture
Bovine fetuses at 90 to 120 days after conception were collected immediately after removal from uterus of slaughtered cows. The fetuses were transported to the laboratory within 2–4 h. Longissimus dorsi was isolated from the fetus, minced into small fragments and then digested within Dulbecco’s modified Eagle’s medium (DMEM) containing collagenase type IV (w/v, 0.1%; C5138, Sigma, USA) for 1 h with continuous shaking at 37 °C. The digestion was neutralized by adding complete culture medium (low glucose DMEM supplemented with 10% FBS). The cell plasma was filtered through the 40 μm pore-diameter nylon meshes, collected by centrifuge and re-suspended in ice-cold phosphate-buffered saline (PBS) buffer (PBS with 0.5% bovine serum albumin and 2 mM EDTA). PDGF Receptor α antibody (#5241, Cell Signaling Technology, USA) was added to the cell suspension according to the manufacturer’s instructions and incubated at 4 °C for 30 min. The cells were washed with buffer and collected. After re-suspended in buffer, Anti-Rabbit IgG MicroBeads (#130-048-602, Miltenyi Biotec, Germany) was added and incubated for 15 min at 4 °C. Then the cells were collected and re-suspended in buffer. MACS column (#130-042-201, Miltenyi Biotec, Germany) and magnetic MiniMACS Separator (#130-042-102, Miltenyi Biotec, Germany) were used to separate PDGFRα+ cells. The cells were seeded in complete medium and incubated at 37 °C in a humidified atmosphere containing 5% CO2. At 70–80% confluence, the cells were passaged with 0.25% trypsin (0458, Amresco, USA).
Adipogenic differentiation and Oil Red O staining
At 100% confluence, the adipogenic differentiation cocktail medium, complete medium supplemented with 10 μg/mL insulin (I5500, Sigma, USA), 1 mM dexamethasone (D1756, Sigma, USA) and 0.5 mM isobutyl-methylxanthine (I5879, Sigma, USA) was supplied to the cells while the control group was cultured in complete medium. Medium were changed every 3 days. After 12 days of differentiation, the cells were stained with Oil Red O (O0625, Sigma, USA) to assess intracellular lipid accumulation.
RNA isolation and quality assessment
Total RNA was extracted using the TRIzol reagent (15596026, Invitrogen, USA). RNA degradation and contamination was monitored on 1% agarose gels. RNA purity was checked using the NanoPhotometer spectrophotometer (IMPLEN, CA, USA). RNA concentration was measured using Qubit RNA Assay Kit in Qubit 2.0 Flurometer (Life Technologies, USA). RNA integrity was assessed using the RNA Nano 6000 Assay Kit of the Agilent Bioanalyzer 2100 system (Agilent Technologies, USA).
Small RNA library construction and high-throughput sequencing
A total amount of 3 μg total RNA per sample was used as input material for the small RNA library. Sequencing libraries were generated using NEBNext Multiplex Small RNA Library Prep Set for Illumina (NEB, USA.) and index codes were added to attribute sequences to each sample. Briefly, NEB 3′ SR Adaptor was directly, and specifically ligated to 3′ end of miRNA, siRNA and piRNA. After the 3′ ligation reaction, the SR RT Primer hybridized to the excess of 3′ SR Adaptor and transformed the single-stranded DNA adaptor into a double-stranded DNA molecule. 5′ends adapter was ligated to 5′ends of miRNAs, siRNA and piRNA. Then first strand cDNA was synthesized using M-MuLV Reverse Transcriptase (RNase H–). PCR amplification was performed using LongAmp Taq 2 × Master Mix, SR Primer for illumina and index (X) primer. PCR products were purified on an 8% polyacrylamide gel. DNA fragments corresponding to 140~160 bp were recovered and dissolved in 8 μL elution buffer. At last, library quality was assessed on the Agilent Bioanalyzer 2100 system using DNA High Sensitivity Chips. The clustering of the index-coded samples was performed on a cBot Cluster Generation System using TruSeq SR Cluster Kit v3-cBot-HS (Illumina) according to the manufacturer’s instructions. After cluster generation, the library preparations were sequenced on an Illumina Hiseq 2500 platform and 50 bp single-end reads were generated.
Data processing, sRNA annotation and miRNA identification
Raw data (raw reads) of fastq format were firstly processed through custom perl and python scripts. In this step, clean datas (clean reads) were obtained by removing reads containing poly-N, with 5′ adapter contaminants, without 3′ adapter or the insert tag, containing poly A or T or G or C and low quality reads from raw data. At the same time, Q20, Q30, and GC-contents of the raw data were calculated, and a certain range of length from clean reads was set to do all the downstream analyses. The small RNA tags were mapped to reference sequence by Bowtie without mismatch to analyze their expression and distribution on the reference. Mapped small RNA tags were used to looking for known miRNA. miRBase21 was used as a reference. To remove tags originating from protein-coding genes, repeat sequences, rRNA, tRNA, snRNA, and snoRNA, small RNA tags were mapped to RepeatMasker, Rfam database or those types of data from the specified species itself.
Differential expression analysis of miRNAs
miRNA expression levels were estimated by TPM (transcript per million) through the following criteria. Normalization formula: Normalized expression = mapped readcount/Total reads*1000000. Differential expression analysis of samples from two time points was performed using the DESeq R package v1.8.3. The P-values was adjusted using the Benjamini& Hochberg method. Corrected P-value of 0.05 was set as the threshold for significantly differential expression by default.
Prediction of miRNA target genes
Predicting the target gene of miRNA was performed by both TargetScan57.
miRNA assay using stem-loop qRT-PCR
Stem-loop RT primers and miRNA-specific primers (forward) were designed using Primer Software Primer Premier 5.0 (Premier Biosoft International, USA). U6 was used as an internal control. All the primers were listed in the Supplementary Table 2. For stem-loop qRT-PCR, approx. 1 μg of total RNA was used to create a reverse transcription pool with the TIANScript RT Kit (KR104-02, TIANGEN Biotech, Beijing). qRT-PCR was performed with the KAPA SYBR® FAST qPCR Kits (KK4601, KAPA, USA), using the forward primer and a Universal Reverse Primer (Supplementrary Table 2). The cycling conditions were as follows: 3 min at 95 °C, followed by 40 cycles of 95 °C for 10 s and 60 °C for 30 s. The samples subjected to qRT-PCR were run in three biological replicates. The fold change of miRNA expression was calculated using the 2−ΔΔCT algorithm58. The relative expression of miRNAs was normalized to the lowest expressed time point.
Detection of mRNAs via qRT-PCR
The expression of adipogenic specific genes, peroxisome proliferator-activated receptor gamma (PPAR-γ), C/EBPα and fatty acid binding protein 4 (FABP4) was detected by RT-PCR. 18S was used as an internal control. Fold change of the tested group is calculated relative to the control group using the 2−ΔΔct algorithm58. Primers sequences are provided in Supplementary Table 2.
Transfection of miR-23a mimics and inhibitors
miR mimic Negative Control, miR inhibitor Negative Control, mimics and inhibitors for bta-miR-23a were chemically synthesized by RiboBio Co. Ltd (Guangzhou, China). Cells were transfected using 50 nM mimics or mimics Negative Control, 100 nM inhibitors or inhibitor Negative Control according to the protocol of Lipofectamine 3000 (L3000015, Invitrogen, USA).
DNA constructs and luciferase reporter assays
A luciferase reporter containing the wild type 3′-UTR of ZNF423 was constructed using psi-CHECK2 vectors (Promega, USA) between XhoI and NotI restriction sites. The following site-directed mutagenesis was done using Fast Site-Directed Mutagenesis Kit (KM101, TIANGEN, China). The primers used in plasmid construction and mutagenesis are listed in Supplementary Table 2. 293T cells were co-transfected with miR-23a mimics or its inhibitors and plasmid using Lipofectamine 3000. Twenty-four hours after transfection, the luciferase activity was measured with a Dual-Luciferase Reporter Assay System (Promega, USA).
Western Blot
Cells were lysed in lysis buffer supplemented with proteinase inhibitors. Equal amounts of total proteins were separated on 10% SDS-polyacrylamide gel. Following electrophoresis, the proteins were transferred to a polyvinylidene difluoride membrane (Millipore, USA) and blocked in 5% (w/v) non-fat milk. Membranes were incubated with antibodies against ZNF423 (sc-10486, Santa Cruz, USA), PPARγ (sc-6284, Santa Cruz, USA), FABP4 (sc-18661, Santa Cruz, USA) and β-actin (sc-47778, Santa Cruz, USA) at the concentration of 1:1000 at 4 °C overnight. The membrane was washed with Tris-buffered saline/Tween for three times and incubated with the HRP-conjugated Donkey Anti-Goat IgG (A0181, Beyotime, China) or Goat Anti-Mouse IgG (A0216, Beyotime, China) at room temperature for 1 h. The signals were visualized using ECL western blotting detection reagent (GE corporation, USA). The band intensities were quantified using Software Image Studio Lite (LI-COR Biosciences, Version 4) and protein levels were normalized to β-actin.
Statistical analysis
Data were presented as mean ± S.E.M. Data normality was verified by Shapiro-Wilk test, followed by student’s t-test with GraphPad Prism software (GraphPad Prism, version 6.0). P ≤ 0.05 was considered as significant difference.
Additional Information
How to cite this article: Guan, L. et al. bta-miR-23a involves in adipogenesis of progenitor cells derived from fetal bovine skeletal muscle. Sci. Rep. 7, 43716; doi: 10.1038/srep43716 (2017).
Publisher's note: Springer Nature remains neutral with regard to jurisdictional claims in published maps and institutional affiliations.
Supplementary Material
Acknowledgments
This study was financially supported by the National Natural Science Foundation of China (No. 31201782 and No. 31672384) and the Agricultural Science and Technology Innovation Program (#ASTIP-IAS03), as well as Agriculture and Food Research Initiative Competitive Grants no. 2015-67015-23219 and 2016-68006-24634 from the USDA National Institute of Food and Agriculture.
Footnotes
The authors declare no competing financial interests.
Author Contributions L.Z., X.H. and J.L. designed the research; X.H., Y.X. and L.Z. performed the cell culture experiment, L.Z., X.L., Q.Y. and M.D. performed the manuscript preparation; L.G., Z.Z. and H.G. performed miRNAome data analysis; L.L. performed luciferase reporter assays; S.J. and J.B. performed sample preparation.
References
- Tong J. et al. AMP-activated protein kinase and adipogenesis in sheep fetal skeletal muscle and 3T3-L1 cells. Journal of animal science 86, 1296–1305, doi: 10.2527/jas.2007-0794 (2008). [DOI] [PubMed] [Google Scholar]
- Kollias H. D. & McDermott J. C. Transforming growth factor-beta and myostatin signaling in skeletal muscle. Journal of applied physiology (Bethesda, Md.: 1985) 104, 579–587, doi: 10.1152/japplphysiol.01091.2007 (2008). [DOI] [PubMed] [Google Scholar]
- Tong J. F. et al. Maternal obesity downregulates myogenesis and beta-catenin signaling in fetal skeletal muscle. American journal of physiology. Endocrinology and metabolism 296, E917–924, doi: 10.1152/ajpendo.90924.2008 (2009). [DOI] [PMC free article] [PubMed] [Google Scholar]
- Wosczyna M. N., Biswas A. A., Cogswell C. A. & Goldhamer D. J. Multipotent progenitors resident in the skeletal muscle interstitium exhibit robust BMP-dependent osteogenic activity and mediate heterotopic ossification. Journal of bone and mineral research: the official journal of the American Society for Bone and Mineral Research 27, 1004–1017, doi: 10.1002/jbmr.1562 (2012). [DOI] [PMC free article] [PubMed] [Google Scholar]
- Joe A. W. et al. Muscle injury activates resident fibro/adipogenic progenitors that facilitate myogenesis. Nature cell biology 12, 153–163, doi: 10.1038/ncb2015 (2010). [DOI] [PMC free article] [PubMed] [Google Scholar]
- Miao Z. G. et al. Invited review: mesenchymal progenitor cells in intramuscular connective tissue development. Animal: an international journal of animal bioscience 10, 75–81, doi: 10.1017/S1751731115001834 (2016). [DOI] [PMC free article] [PubMed] [Google Scholar]
- Uezumi A., Fukada S., Yamamoto N., Takeda S. & Tsuchida K. Mesenchymal progenitors distinct from satellite cells contribute to ectopic fat cell formation in skeletal muscle. Nature cell biology 12, 143–152, doi: 10.1038/ncb2014 (2010). [DOI] [PubMed] [Google Scholar]
- Lin F. T. & Lane M. D. CCAAT/enhancer binding protein alpha is sufficient to initiate the 3T3-L1 adipocyte differentiation program. Proceedings of the National Academy of Sciences of the United States of America 91, 8757–8761 (1994). [DOI] [PMC free article] [PubMed] [Google Scholar]
- Tontonoz P., Hu E. & Spiegelman B. M. Stimulation of adipogenesis in fibroblasts by PPAR gamma 2, a lipid-activated transcription factor. Cell 79, 1147–1156 (1994). [DOI] [PubMed] [Google Scholar]
- Rosen E. D. et al. C/EBPalpha induces adipogenesis through PPARgamma: a unified pathway. Genes & development 16, 22–26, doi: 10.1101/gad.948702 (2002). [DOI] [PMC free article] [PubMed] [Google Scholar]
- Moisa S. J. et al. Central Role of the PPARgamma Gene Network in Coordinating Beef Cattle Intramuscular Adipogenesis in Response to Weaning Age and Nutrition. Gene regulation and systems biology 8, 17–32, doi: 10.4137/GRSB.S11782 (2014). [DOI] [PMC free article] [PubMed] [Google Scholar]
- Duarte M. S. et al. Enhancement of adipogenesis and fibrogenesis in skeletal muscle of Wagyu compared with Angus cattle. Journal of animal science 91, 2938–2946, doi: 10.2527/jas.2012-5892 (2013). [DOI] [PubMed] [Google Scholar]
- Gupta R. K. et al. Transcriptional control of preadipocyte determination by Zfp423. Nature 464, 619–623, doi: 10.1038/nature08816 (2010). [DOI] [PMC free article] [PubMed] [Google Scholar]
- Gupta R. K. et al. Zfp423 expression identifies committed preadipocytes and localizes to adipose endothelial and perivascular cells. Cell metabolism 15, 230–239, doi: 10.1016/j.cmet.2012.01.010 (2012). [DOI] [PMC free article] [PubMed] [Google Scholar]
- Yang Q. Y. et al. Maternal obesity induces epigenetic modifications to facilitate Zfp423 expression and enhance adipogenic differentiation in fetal mice. Diabetes 62, 3727–3735, doi: 10.2337/db13-0433 (2013). [DOI] [PMC free article] [PubMed] [Google Scholar]
- Huang Y., Das A. K., Yang Q. Y., Zhu M. J. & Du M. Zfp423 promotes adipogenic differentiation of bovine stromal vascular cells. PloS one 7, e47496, doi: 10.1371/journal.pone.0047496 (2012). [DOI] [PMC free article] [PubMed] [Google Scholar]
- Lewis B. P., Burge C. B. & Bartel D. P. Conserved seed pairing, often flanked by adenosines, indicates that thousands of human genes are microRNA targets. Cell 120, 15–20, doi: 10.1016/j.cell.2004.12.035 (2005). [DOI] [PubMed] [Google Scholar]
- Carrington J. C. & Ambros V. Role of microRNAs in plant and animal development. Science 301, 336–338, doi: 10.1126/science.1085242 (2003). [DOI] [PubMed] [Google Scholar]
- Wu L., Fan J. & Belasco J. G. MicroRNAs direct rapid deadenylation of mRNA. Proceedings of the National Academy of Sciences of the United States of America 103, 4034–4039, doi: 10.1073/pnas.0510928103 (2006). [DOI] [PMC free article] [PubMed] [Google Scholar]
- Martini P. et al. Tissue-specific expression and regulatory networks of pig microRNAome. PloS one 9, e89755, doi: 10.1371/journal.pone.0089755 (2014). [DOI] [PMC free article] [PubMed] [Google Scholar]
- Oh T. J., Wartell R. M., Cairney J. & Pullman G. S. Evidence for stage-specific modulation of specific microRNAs (miRNAs) and miRNA processing components in zygotic embryo and female gametophyte of loblolly pine (Pinus taeda). The New phytologist 179, 67–80, doi: 10.1111/j.1469-8137.2008.02448.x (2008). [DOI] [PubMed] [Google Scholar]
- Sun T., Fu M., Bookout A. L., Kliewer S. A. & Mangelsdorf D. J. MicroRNA let-7 regulates 3T3-L1 adipogenesis. Molecular endocrinology 23, 925–931, doi: 10.1210/me.2008-0298 (2009). [DOI] [PMC free article] [PubMed] [Google Scholar]
- Kinoshita M. et al. Regulation of adipocyte differentiation by activation of serotonin (5-HT) receptors 5-HT2AR and 5-HT2CR and involvement of microRNA-448-mediated repression of KLF5. Molecular endocrinology 24, 1978–1987, doi: 10.1210/me.2010-0054 (2010). [DOI] [PMC free article] [PubMed] [Google Scholar]
- Esau C. et al. MicroRNA-143 regulates adipocyte differentiation. The Journal of biological chemistry 279, 52361–52365, doi: 10.1074/jbc.C400438200 (2004). [DOI] [PubMed] [Google Scholar]
- Karbiener M. et al. microRNA miR-27b impairs human adipocyte differentiation and targets PPARgamma. Biochemical and biophysical research communications 390, 247–251, doi: 10.1016/j.bbrc.2009.09.098 (2009). [DOI] [PubMed] [Google Scholar]
- Lee E. K. et al. miR-130 suppresses adipogenesis by inhibiting peroxisome proliferator-activated receptor gamma expression. Molecular and cellular biology 31, 626–638, doi: 10.1128/MCB.00894-10 (2011). [DOI] [PMC free article] [PubMed] [Google Scholar]
- Liu S. Y. et al. MiR-378 Plays an Important Role in the Differentiation of Bovine Preadipocytes. Cellular physiology and biochemistry: international journal of experimental cellular physiology, biochemistry, and pharmacology 36, 1552–1562, doi: 10.1159/000430318 (2015). [DOI] [PubMed] [Google Scholar]
- Jin W., Dodson M. V., Moore S. S., Basarab J. A. & Guan L. L. Characterization of microRNA expression in bovine adipose tissues: a potential regulatory mechanism of subcutaneous adipose tissue development. BMC molecular biology 11, 29, doi: 10.1186/1471-2199-11-29 (2010). [DOI] [PMC free article] [PubMed] [Google Scholar]
- Wang H., Zheng Y., Wang G. & Li H. Identification of microRNA and bioinformatics target gene analysis in beef cattle intramuscular fat and subcutaneous fat. Molecular bioSystems 9, 2154–2162, doi: 10.1039/c3mb70084d (2013). [DOI] [PubMed] [Google Scholar]
- Wang H. et al. In silico identification of conserved microRNAs and their targets in bovine fat tissue. Gene 559, 119–128, doi: 10.1016/j.gene.2015.01.021 (2015). [DOI] [PubMed] [Google Scholar]
- Mauro A. Satellite cell of skeletal muscle fibers. The Journal of biophysical and biochemical cytology 9, 493–495 (1961). [DOI] [PMC free article] [PubMed] [Google Scholar]
- Kadi F. et al. The effects of heavy resistance training and detraining on satellite cells in human skeletal muscles. The Journal of physiology 558, 1005–1012, doi: 10.1113/jphysiol.2004.065904 (2004). [DOI] [PMC free article] [PubMed] [Google Scholar]
- Allen R. E., Merkel R. A. & Young R. B. Cellular aspects of muscle growth: myogenic cell proliferation. Journal of animal science 49, 115–127 (1979). [DOI] [PubMed] [Google Scholar]
- Sacco A., Doyonnas R., Kraft P., Vitorovic S. & Blau H. M. Self-renewal and expansion of single transplanted muscle stem cells. Nature 456, 502–506, doi: 10.1038/nature07384 (2008). [DOI] [PMC free article] [PubMed] [Google Scholar]
- Cosgrove B. D., Sacco A., Gilbert P. M. & Blau H. M. A home away from home: challenges and opportunities in engineering in vitro muscle satellite cell niches. Differentiation; research in biological diversity 78, 185–194, doi: 10.1016/j.diff.2009.08.004 (2009). [DOI] [PMC free article] [PubMed] [Google Scholar]
- Du M. et al. Meat Science and Muscle Biology Symposium: manipulating mesenchymal progenitor cell differentiation to optimize performance and carcass value of beef cattle. Journal of animal science 91, 1419–1427, doi: 10.2527/jas.2012-5670 (2013). [DOI] [PubMed] [Google Scholar]
- Taga H. et al. Adipocyte metabolism and cellularity are related to differences in adipose tissue maturity between Holstein and Charolais or Blond d’Aquitaine fetuses. Journal of animal science 89, 711–721, doi: 10.2527/jas.2010-3234 (2011). [DOI] [PubMed] [Google Scholar]
- Liang W. C., Wang Y., Wan D. C., Yeung V. S. & Waye M. M. Characterization of miR-210 in 3T3-L1 adipogenesis. Journal of cellular biochemistry 114, 2699–2707, doi: 10.1002/jcb.24617 (2013). [DOI] [PubMed] [Google Scholar]
- Li H. et al. MiRNA-181a regulates adipogenesis by targeting tumor necrosis factor-alpha (TNF-alpha) in the porcine model. PloS one 8, e71568, doi: 10.1371/journal.pone.0071568 (2013). [DOI] [PMC free article] [PubMed] [Google Scholar]
- Chou W. W. et al. Decreased microRNA-221 is associated with high levels of TNF-alpha in human adipose tissue-derived mesenchymal stem cells from obese woman. Cellular physiology and biochemistry: international journal of experimental cellular physiology, biochemistry, and pharmacology 32, 127–137, doi: 10.1159/000350131 (2013). [DOI] [PubMed] [Google Scholar]
- Lee Y. et al. MicroRNA genes are transcribed by RNA polymerase II. The EMBO journal 23, 4051–4060, doi: 10.1038/sj.emboj.7600385 (2004). [DOI] [PMC free article] [PubMed] [Google Scholar]
- Kim S. Y. et al. miR-27a is a negative regulator of adipocyte differentiation via suppressing PPARgamma expression. Biochemical and biophysical research communications 392, 323–328, doi: 10.1016/j.bbrc.2010.01.012 (2010). [DOI] [PubMed] [Google Scholar]
- Shen L. et al. MicroRNA-23a regulates 3T3-L1 adipocyte differentiation. Gene 575, 761–764, doi: 10.1016/j.gene.2015.09.060 (2016). [DOI] [PubMed] [Google Scholar]
- Addison W. N. et al. Direct transcriptional repression of Zfp423 by Zfp521 mediates a bone morphogenic protein-dependent osteoblast versus adipocyte lineage commitment switch. Molecular and cellular biology 34, 3076–3085, doi: 10.1128/MCB.00185-14 (2014). [DOI] [PMC free article] [PubMed] [Google Scholar]
- Hammarstedt A. et al. WISP2 regulates preadipocyte commitment and PPARgamma activation by BMP4. Proceedings of the National Academy of Sciences of the United States of America 110, 2563–2568, doi: 10.1073/pnas.1211255110 (2013). [DOI] [PMC free article] [PubMed] [Google Scholar]
- Yun U. J. et al. miR-195a inhibits adipocyte differentiation by targeting the preadipogenic determinator Zfp423. Journal of cellular biochemistry 116, 2589–2597, doi: 10.1002/jcb.25204 (2015). [DOI] [PubMed] [Google Scholar]
- Zhang Y. et al. Control of mesenchymal lineage progression by microRNAs targeting skeletal gene regulators Trps1 and Runx2. The Journal of biological chemistry 287, 21926–21935, doi: 10.1074/jbc.M112.340398 (2012). [DOI] [PMC free article] [PubMed] [Google Scholar]
- Hassan M. Q. et al. A network connecting Runx2, SATB2, and the miR-23a~27a~24-2 cluster regulates the osteoblast differentiation program. Proceedings of the National Academy of Sciences of the United States of America 107, 19879–19884, doi: 10.1073/pnas.1007698107 (2010). [DOI] [PMC free article] [PubMed] [Google Scholar]
- Hadjimichael C., Nikolaou C., Papamatheakis J. & Kretsovali A. MicroRNAs for Fine-Tuning of Mouse Embryonic Stem Cell Fate Decision through Regulation of TGF-beta Signaling. Stem cell reports 6, 292–301, doi: 10.1016/j.stemcr.2016.01.004 (2016). [DOI] [PMC free article] [PubMed] [Google Scholar]
- Ghosh T. et al. MicroRNAs establish robustness and adaptability of a critical gene network to regulate progenitor fate decisions during cortical neurogenesis. Cell reports 7, 1779–1788, doi: 10.1016/j.celrep.2014.05.029 (2014). [DOI] [PubMed] [Google Scholar]
- Gioia U. et al. Mir-23a and mir-125b regulate neural stem/progenitor cell proliferation by targeting Musashi1. RNA biology 11, 1105–1112, doi: 10.4161/rna.35508 (2014). [DOI] [PMC free article] [PubMed] [Google Scholar]
- Zhu Y. et al. A comprehensive analysis of GATA-1-regulated miRNAs reveals miR-23a to be a positive modulator of erythropoiesis. Nucleic acids research 41, 4129–4143, doi: 10.1093/nar/gkt093 (2013). [DOI] [PMC free article] [PubMed] [Google Scholar]
- Yang Z. et al. Serum miR-23a, a potential biomarker for diagnosis of pre-diabetes and type 2 diabetes. Acta diabetologica 51, 823–831, doi: 10.1007/s00592-014-0617-8 (2014). [DOI] [PubMed] [Google Scholar]
- Karolina D. S. et al. miR-22 and miR-23a control glycerol-dependent gluconeogenesis by regulating Aquaporin 9 expression. Metabolomics S2 (2014). [Google Scholar]
- Ortega F. J. et al. MiRNA expression profile of human subcutaneous adipose and during adipocyte differentiation. PloS one 5, e9022, doi: 10.1371/journal.pone.0009022 (2010). [DOI] [PMC free article] [PubMed] [Google Scholar]
- Estep M. et al. Differential expression of miRNAs in the visceral adipose tissue of patients with non-alcoholic fatty liver disease. Alimentary pharmacology & therapeutics 32, 487–497, doi: 10.1111/j.1365-2036.2010.04366.x (2010). [DOI] [PubMed] [Google Scholar]
- Agarwal V., Bell G. W., Nam J. W. & Bartel D. P. Predicting effective microRNA target sites in mammalian mRNAs. eLife 4, doi: 10.7554/eLife.05005 (2015). [DOI] [PMC free article] [PubMed] [Google Scholar]
- Livak K. J. & Schmittgen T. D. Analysis of relative gene expression data using real-time quantitative PCR and the 2(-Delta Delta C(T)) Method. Methods 25, 402–408, doi: 10.1006/meth.2001.1262 (2001). [DOI] [PubMed] [Google Scholar]
Associated Data
This section collects any data citations, data availability statements, or supplementary materials included in this article.


