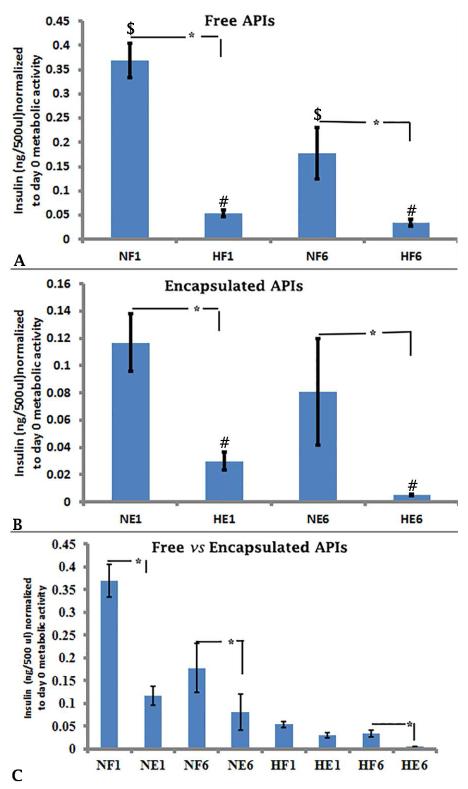
Figure 4.
Insulin secretion determined by ELISA of free and encapsulated under normoxia and hypoxia. The experiments were performed 4 times, each with islets from separate islet isolation, and representative experiments are shown in Figures 4A, 4B, and 4C.Insulin concentrations (ng/500 μl, n=3 at each time point were normalized to metabolic activity of the same well on Day 0. Statistically significant differences ($, #, *) between two groups (n=3 each) using the unpaired students t test (p≤0.05). The treatments indicated on the x-axis are the same as in Figure 3.

