

Abstract
Background
Equity is one of the major goals of China’s recent health system reform. This study aimed to evaluate the equality of the distribution of health resources and health services between hospitals and primary care institutions.
Methods
Data of this study were drawn from the China Health Statistical Year Books. We calculated Gini coefficients based on population size and geographic size, respectively, for the indicators: number of institutions, number of health workers and number of beds; and the concentration index (CI) for the indicators: per capita outpatient visits and annual hospitalization rates.
Results
The Gini coefficients against population size ranged between 0.17 and 0.44 in the hospital sector, indicating a relatively good equality. The primary care sector showed a slightly higher level of Gini coefficients (around 0.45) in the number of health workers. However, inequality was evident in the geographic distribution of health resources. The Gini coefficients exceeded 0.7 in the geographic distribution of institutions, health workers and beds in both the hospital and the primary care sectors, indicating high levels of inequality. The CI values of hospital inpatient care and outpatient visits to primary care institutions were small (ranging from -0.02 to 0.02), indicating good wealth-related equality. The CI values of outpatient visits to hospitals ranged from 0.16 to 0.21, indicating a concentration of services towards the richer populations. By contrast, the CI values of inpatient care in primary care institutions ranged from -0.24 to -0.22, indicating a concentration of services towards the poorer populations. The eastern developed region also had a high internal inequality compared with the other less developed regions.
Conclusion
Significant inequality in the geographic distribution of health resources is evident, despite a more equitable per capita distribution of resources. Richer people are more likely to use well-resourced hospitals for outpatient care. By contrast, poorer people are more likely to use poorly-resourced primary care institutions for inpatient care. There is a risk of the emergence of a two-tiered health care delivery system.
Keywords: Equity, Hospitals, Primary care institutions, Health resources, Health services
Background
Despite great progress in health system reform, inequity in medical resources and medical care services remains a serious concern of many researchers and policymakers in China. Empirical evidence suggests that large inequity in resources and services can exacerbate disparities in health outcomes and quality of life [1, 2]. In recent years, the Chinese government has endorsed equity as an important indicator for health system evaluation [3, 4]. With almost universal coverage of social health insurance, health care accessibility and affordability of the poor and disadvantaged populations emerged to be top of the governmental agenda for further policy development [5].
In China, hospitals and primary care institutions deliver the majority of medical care services although, public health agencies and other institutions also play a role [6]. Hospitals are able to attract more and quality resources (such as a health workforce and health technologies) than their primary care counterparts. However, due to the large amount of primary care institutions and better accessibility, primary care can play a more crucial role in promoting regional health equity [7]. In comparison with hospitals, unfortunately, a serious shortage of resources exists in primary care institutions in China, leading to distrust from consumers. Services delivered by primary care institutions are deemed poor quality. They are unable to fulfill a gatekeeping function in the health system. It is common for consumers to seek medical attention from hospitals for minor illness or chronic conditions. Driven by the market forces, more resources have been poured into hospitals, further exacerbating disparities between hospitals and primary care institutions [8–10].
Recently, inequity in medical resources and medical care services started to attract attention from researchers: some focused on certain medical conditions [11–13]; others explored inequity in resources and services within the primary care sector [14, 15]. Hung argued that a big gap in resources and services between hospitals and primary care institutions exists and it continues to be increase despite the government’s favorable investment policies for the primary care sector [16]. But there is paucity in the literature documenting inequity in resources and services between hospitals and primary care institutions.
This study aimed to evaluate equity in medical resources and medical care services between hospitals and primary care institutions in China.
Methods
Data source
Data used in this study were extracted from the China Statistical Yearbook and the China Health Statistics Yearbook from 2010 to 2014, which covered 31 provinces and autonomous regions municipalities. Due to inconsistencies of data standards, Macao, Hong Kong and Taiwan were excluded from the study.
The 31 provinces were divided into three economic zones according to their geographical location and Gross Domestic Product (GDP) per capita: western undeveloped zone, central developing zone and eastern developed zone. The eastern developed zone covered Beijing, Tianjin, Hebei, Liaoning, Shandong, Jiangsu, Zhejiang, Shanghai, Fujian, Guangdong and Hainan. The central developing zone covered Heilongjiang, Jilin, Shanxi, Henan, Anhui, Hubei, Jiangxi and Hunan. The western undeveloped zone covered Inner Mongolia, Ningxia, Gansu, Shaanxi, Sichuan, Chongqing, Guizhou, Yunnan, Guangxi, Qinghai, Xinjiang and Tibet [17].
In the statistics yearbooks, hospitals were identified by their registration certificates. These includes general hospitals, TCM (Traditional Chinese Medicine) hospitals, hospitals of integrated medicine, and specialized hospitals. There were three levels of hospitals: primary, secondary and tertiary. Most hospitals were owned by governments (public hospitals). Primary care institutions reported in the statistics included urban community health centers & stations, rural health centers, village clinics, and independent outpatient clinics. They were smaller in size, but many still had beds and could admit patients with non-urgent conditions [17]. We did not include public health agencies, maternal and child health care centers, and nursing homes in this study, although they also delivered a small percentage of clinical medical care.
Measurements of inequity
The Gini coefficient and concentration index (CI) have been identified as superior tools for measuring inequity [18]. The Gini coefficient examines the distribution of health resources and services against population size and geographic size, while the CI assesses the distribution of health resources and services against economic status [19]. The Gini coefficient was calculated based on the Lorenz curve: a graphical representation of a function of the cumulative proportion of resources or services of ordered institutions mapped onto the corresponding cumulative proportion of their size. It reflects the ratio of the area between the Lorenz curve and the diagonal line, to the whole area below the 45° line.
Where S1 is the area bounded by the Lorenz curve and the axes; Yi is the cumulative proportion of health resources or services (Y0 = 0); and Xi+1 is the cumulative proportion of each group of the population or geographical area. The G ranges from 0 to 1; a value of 0 indicates equitable distribution of resources or services; a value of less than 0.3 shows preferred equity status; a value of greater than. 0.4 triggers an alert of inequity; a value exceeding 0.6 reflects a highly inequitable state [20].
The concentration index defined as twice the area between the concentration curve (cumulative proportion of resources/services mapped onto the corresponding cumulative proportion of wealth) and the line of equality: C = 2cov(x, h)/μ.
Where x is fractional rank in terms of per capita GDP; h is the health (resource or service) indicator; and μ is the mean of the health indicator. The range of C lies in between -1 and 1: a value of zero indicates absolute equity; a negative value indicates a concentration of health resources or services on the poorer populations; a positive value represents a concentration of health resources or services on the richer populations [21]. Due to limitations of data availability, we did not use standardization in estimating CI.
Indicators
We chose two groups of indicators for measuring inequity in line with previous studies [22, 23], reflecting the distributions of health resources and health services, respectively. Health resources were measured by number of institutions, number of beds and number of health workers. Health services utilization was measured by average outpatient visits per person and the annual hospitalization rate in the served communities [24].
Results
Equity in the distribution of health resources
From 2010 to 2014, health resources increased in both hospitals (Table 1) and primary care (Table 2) sectors in terms of average resources per capita or per km2. The increasing trend was observed in all of the three economic zones. Hospital resources appeared to rise a more rapid pace than primary care resources. Overall, there were more primary care institutions than hospitals. However, most health workers and beds were allocated to hospitals.
Table 1.
Distribution of health resources in the hospital sector (2010–2014)
| Year | Economic zone | Population (1000 persons) |
Geographic area (1000 km2) | Hospitals | Health workers | Beds | |||
|---|---|---|---|---|---|---|---|---|---|
| Per 1000 persons |
Per 1000 km2 |
Per 1000 persons |
Per 1000 km2 |
Per 1000 persons |
Per 1000 km2 |
||||
| 2010 | Total | 1333850 | 9610.300 | 0.018 | 7.030 | 3.397 | 1815.158 | 2.675 | 1308.351 |
| Eastern | 50035 | 96.518 | 0.017 | 14.536 | 4.042 | 4141.334 | 2.879 | 2880.044 | |
| Central | 52845 | 208.738 | 0.017 | 4.363 | 3.128 | 850.486 | 2.540 | 693.699 | |
| Western | 30058 | 573.225 | 0.021 | 1.929 | 2.985 | 325.945 | 2.577 | 277.400 | |
| 2011 | Total | 1340420 | 9610.300 | 0.019 | 7.306 | 3.587 | 1905.550 | 2.886 | 1387.176 |
| Eastern | 50405 | 96.518 | 0.017 | 15.030 | 4.240 | 4327.138 | 3.042 | 3018.988 | |
| Central | 52968 | 208.738 | 0.018 | 4.597 | 3.273 | 899.447 | 2.744 | 759.821 | |
| Western | 30185 | 573.225 | 0.021 | 2.033 | 3.198 | 356.495 | 2.837 | 309.585 | |
| 2012 | Total | 1347890 | 9610.300 | 0.020 | 7.638 | 3.831 | 2043.209 | 3.165 | 1504.222 |
| Eastern | 50773 | 96.518 | 0.018 | 15.696 | 4.945 | 4611.838 | 3.290 | 3230.241 | |
| Central | 53139 | 208.738 | 0.018 | 4.742 | 3.499 | 976.448 | 3.042 | 853.326 | |
| Western | 30357 | 573.225 | 0.022 | 2.183 | 3.442 | 399.808 | 3.132 | 355.967 | |
| 2013 | Total | 1355160 | 9610.300 | 0.020 | 8.071 | 4.122 | 2178.967 | 3.466 | 1623.555 |
| Eastern | 51098 | 96.518 | 0.018 | 16.474 | 4.744 | 4890.802 | 3.507 | 3445.684 | |
| Central | 53339 | 208.738 | 0.019 | 4.953 | 3.708 | 1050.623 | 3.332 | 945.499 | |
| Western | 30531 | 573.225 | 0.024 | 2.448 | 3.827 | 445.347 | 3.518 | 405.307 | |
| 2014 | Total | 1362460 | 9610.300 | 0.021 | 8.416 | 4.370 | 2313.813 | 3.723 | 1731.190 |
| Eastern | 51418 | 96.518 | 0.019 | 17.175 | 4.980 | 5173.344 | 3.713 | 3642.380 | |
| Central | 53559.000 | 208.738 | 0.019 | 5.116 | 3.921 | 1122.929 | 3.616 | 1033.950 | |
| Western | 30699.000 | 573.225 | 0.025 | 2.588 | 4.111 | 486.499 | 3.803 | 444.091 | |
Table 2.
Distribution of health resources in the primary care sector (2010 to 2014)
| Year | Economic zone | Population (1000 persons) |
Geographic area (1000 km2) | Primary care institutions | Health workers | Beds | |||
|---|---|---|---|---|---|---|---|---|---|
| Per 1000 persons |
Per 1000 km2 |
Per 1000 persons |
Per 1000 km2 |
Per 1000 persons |
Per 1000 km2 |
||||
| 2010 | Total | 1333850 | 9610.300 | 0.698 | 207.315 | 2.381 | 979.316 | 0.846 | 335.204 |
| Eastern | 50035 | 96.518 | 0.546 | 343.328 | 2.282 | 1902.253 | 0.692 | 611.752 | |
| Central | 52845 | 208.738 | 0.707 | 205.396 | 2.539 | 758.200 | 0.930 | 281.703 | |
| Western | 30058 | 573.225 | 0.832 | 83.916 | 2.367 | 280.701 | 0.931 | 117.369 | |
| 2011 | Total | 1340420 | 9610.300 | 0.723 | 209.758 | 2.496 | 1012.334 | 0.868 | 338.192 |
| Eastern | 50405 | 96.518 | 0.545 | 345.298 | 2.320 | 1973.743 | 0.696 | 607.258 | |
| Central | 52968 | 208.738 | 0.721 | 209.765 | 2.562 | 769.625 | 0.956 | 290.618 | |
| Western | 30185 | 573.225 | 0.888 | 85.509 | 2.613 | 292.848 | 0.969 | 123.264 | |
| 2012 | Total | 1347890 | 9610.300 | 0.720 | 209.793 | 2.537 | 1036.512 | 0.922 | 351.748 |
| Eastern | 50773 | 96.518 | 0.545 | 348.568 | 2.362 | 2031.398 | 0.716 | 614.744 | |
| Central | 53139 | 208.738 | 0.705 | 203.854 | 2.557 | 771.048 | 1.031 | 315.257 | |
| Western | 30357 | 573.225 | 0.890 | 86.543 | 2.684 | 301.510 | 1.038 | 134.995 | |
| 2013 | Total | 1355160 | 9610.300 | 0.716 | 210.990 | 2.585 | 1067.879 | 0.940 | 356.560 |
| Eastern | 51098 | 96.518 | 0.540 | 351.431 | 2.424 | 2107.795 | 0.714 | 616.445 | |
| Central | 53339 | 208.738 | 0.701 | 204.025 | 2.559 | 774.800 | 1.034 | 318.930 | |
| Western | 30531 | 573.225 | 0.886 | 86.895 | 2.750 | 310.007 | 1.085 | 143.418 | |
| 2014 | Total | 1362460 | 9610.300 | 0.713 | 212.187 | 2.604 | 1085.242 | 0.958 | 360.404 |
| Eastern | 51418 | 96.518 | 0.539 | 354.795 | 2.422 | 2146.990 | 0.713 | 613.118 | |
| Central | 53559 | 208.738 | 0.698 | 203.922 | 2.562 | 778.634 | 1.065 | 330.572 | |
| Western | 30699 | 573.225 | 0.883 | 86.972 | 2.798 | 316.378 | 1.112 | 148.638 | |
Large regional disparities appeared in the number of resources per km2, despite small regional differences in the number of resources per capita. The eastern developed region had a much higher level of density in the distribution of hospitals, health workers and beds. For example, in 2014, the number of hospitals per 1000 km2 in the eastern zone was 8 times more than that in the western zone. Similarly, in 2014, the number of primary care institutions per 1000 km2 in the eastern zone was 4 times more than that in the western zone.
The Gini coefficients against population size ranged between 0.17 and 0.44 in the hospital sector: 0.36–0.44 for the number of hospitals, 0.23–0.28 for the number of health workers, and 0.17–0.26 for the number of beds respectively, indicating relatively good equality (Table 3). The primary care sector showed a slightly higher level of Gini coefficients (around 0.45) in the number of health workers. But the distribution of primary health care institutions and beds was equitable, with Gini coefficients ranging from 0.02 to 0.27 (Table 3).
Table 3.
Gini coefficients of population and geographic distribution of health resources (2010–2014)
| Gini coefficient | Year | Hospital sector | Primary care sector | ||||
|---|---|---|---|---|---|---|---|
| Institutions | Health workers | Beds | Institutions | Health workers | Beds | ||
| Population size | 2010 | 0.44 | 0.28 | 0.26 | 0.23 | 0.43 | 0.04 |
| 2011 | 0.41 | 0.26 | 0.24 | 0.27 | 0.43 | 0.04 | |
| 2012 | 0.36 | 0.24 | 0.18 | 0.27 | 0.45 | 0.02 | |
| 2013 | 0.37 | 0.23 | 0.18 | 0.27 | 0.45 | 0.07 | |
| 2014 | 0.36 | 0.23 | 0.17 | 0.26 | 0.45 | 0.07 | |
| Geographic size | 2010 | 0.86 | 0.90 | 0.88 | 0.77 | 0.81 | 0.82 |
| 2011 | 0.86 | 0.89 | 0.87 | 0.78 | 0.81 | 0.81 | |
| 2012 | 0.83 | 0.89 | 0.83 | 0.78 | 0.83 | 0.81 | |
| 2013 | 0.81 | 0.89 | 0.82 | 0.78 | 0.84 | 0.81 | |
| 2014 | 0.81 | 0.88 | 0.82 | 0.89 | 0.88 | 0.81 | |
However, inequality was evident in the geographic distribution of health resources (Table 3). The Gini coefficients exceeded 0.7 in the geographic distributions of institutions, health workers and beds in both the hospital and the primary care sectors, indicating high levels of inequality. No obvious changes in Gini coefficients were found over the years from 2010 to 2014.
Equity in utilization of health services
Primary care institutions provided more outpatient services (2.508–2.938 visits per person a year) than hospitals (1.634–2.283 visits per person a year); whereas, hospitals provided more inpatient services (7.183%–11.178% admission rates) than primary care institutions (2.619%–2.637% admission rates).
From 2010 to 2014, the most significant increase in the utilization of health services occurred in inpatient services in the hospital sector, compared with a slight increase in outpatient services in both sectors and inpatient services in the primary care sector (Table 4).
Table 4.
Health services utilization in hospital and primary care sectors (2010–2014)
| Year | Economic zone | Per capita GDP(Yuan) | Hospitals | Primary care institutions | ||
|---|---|---|---|---|---|---|
| Outpatient visits (times) |
Inpatient care (%) |
Outpatient visits (times) |
Inpatient care (%) |
|||
| 2010 | Total | 28736.935 | 1.634 | 7.183 | 2.508 | 2.619 |
| Eastern | 44670.364 | 2.443 | 7.624 | 2.862 | 1.680 | |
| Central | 21001.125 | 1.091 | 6.701 | 2.252 | 2.982 | |
| Western | 19288.500 | 1.259 | 7.100 | 2.355 | 3.238 | |
| 2011 | Total | 39136.161 | 1.793 | 8.018 | 2.621 | 2.496 |
| Eastern | 56799.909 | 2.693 | 8.401 | 2.995 | 1.560 | |
| Central | 30759.250 | 1.176 | 7.573 | 2.387 | 2.861 | |
| Western | 28529.000 | 1.379 | 7.963 | 2.433 | 3.110 | |
| 2012 | Total | 43351.032 | 1.978 | 9.346 | 2.789 | 2.789 |
| Eastern | 61907.091 | 2.969 | 9.517 | 3.199 | 1.633 | |
| Central | 34264.625 | 1.317 | 8.930 | 2.558 | 3.237 | |
| Western | 32398.917 | 1.509 | 9.467 | 2.567 | 3.549 | |
| 2013 | Total | 47046.581 | 2.123 | 10.261 | 2.919 | 2.814 |
| Eastern | 66765.364 | 3.158 | 10.214 | 3.386 | 1.565 | |
| Central | 37064.750 | 1.406 | 9.781 | 2.660 | 3.238 | |
| Western | 35625.583 | 1.653 | 10.623 | 2.664 | 3.676 | |
| 2014 | Total | 50734.742 | 2.283 | 11.178 | 2.938 | 2.637 |
| Eastern | 71753.909 | 3.371 | 11.050 | 3.459 | 1.490 | |
| Central | 39753.000 | 1.532 | 10.741 | 2.698 | 3.104 | |
| Western | 38788.333 | 1.786 | 11.586 | 2.619 | 3.376 | |
Higher levels of health services utilization in the eastern developed zone (except for inpatient services in primary care institutions) was found compared with those in the central developing and western undeveloped zones. Western residents were more likely to use primary care institutions for inpatient care than their eastern and central counterparts (Table 4).
The CI values of hospital inpatient care and outpatient visits to primary care institutions were small (ranging from -0.02 to 0.02), indicating good wealth-related equality (Table 5). The CI values of outpatient visits to hospitals, ranged from 0.16 to 0.21, indicated a concentration of services towards the richer populations. By contrast, the CI values of inpatient care in primary care institutions ranged from -0.24 to -0.22, indicating a concentration of services towards the poorer populations.
Table 5.
Concentration index (CI) of health services in the hospital and primary care sectors (2010–2014)
| Year | Hospitals | Primary care institutions | ||
|---|---|---|---|---|
| Outpatient visits | Inpatient care | Outpatient visits | Inpatient care | |
| 2010 | 0.20 | -0.01 | -0.01 | -0.24 |
| 2011 | 0.21 | 0.02 | 0.02 | -0.23 |
| 2012 | 0.16 | 0.02 | -0.02 | -0.23 |
| 2013 | 0.21 | -0.01 | 0.02 | -0.22 |
| 2014 | 0.20 | -0.05 | 0.02 | -0.24 |
Within each economic zone, wealth-related inequality in health services also existed (Fig. 1). The eastern developed zone had a higher level of CI than the central developing and western undeveloped zones, indicating greater inequality. In the eastern developed zone, poorer people were more likely to use primary care institutions for their inpatient care, while the other services were favored by richer people. From 2010 to 2014, the CI in the central and western zones declined, compared with an increasing trend in the eastern zone, except for inpatient care in primary care institutions.
Fig. 1.
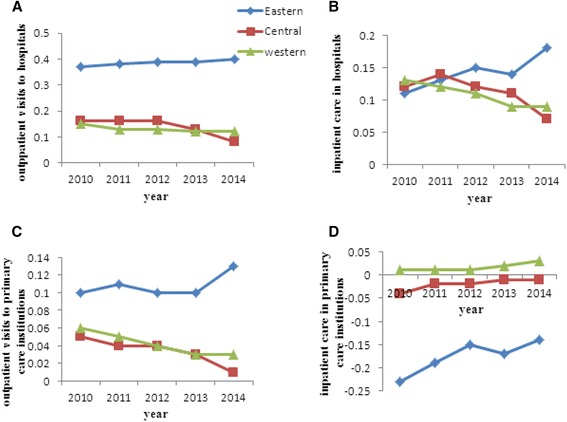
Concentration index (CI) of health services utilization in the eastern, central and western regions from 2010 to 2014. a and b illustrate changes in CI for outpatient visits to and inpatient care in hospitals, respectively; c and d illustrate changes in CI for outpatient visits to and inpatient care in primary care institutions, respectively. The X-axis represents the year and the Y-axis represents the value of CI
Discussion
This study compared the hospital and primary care sector in China in terms of the distributions of health resources and health services. We found that most health workers and beds were allocated to hospitals despite there being a much larger number of primary care institutions (in China, primary care institutions comprise more than 96% of all health institutions [6]). Meanwhile, hospitals developed more rapidly than primary care institutions. This may impose a risk of further enlarging the capacity gap between hospitals and primary care institutions, jeopardizing the governmental effort to strengthen primary care. The most recent round of health reform launched in 2009 has a strong focus on primary care. Although some progress has been made with increased governmental investments in primary care, the capacity development of primary care still lags behind the hospital sector. Several other studies in China also found that quality resources tend to be increasingly concentrated in hospitals [13, 25]. Low wages and lack of career opportunities have often been blamed for the shortage of primary care workers and the loss of quality health workers to hospitals [6].
Inequality in health resources is mainly reflected in geographic distributions (density) instead of per capita (population) distribution. The Gini coefficients exceeded 0.7 in the geographic distribution of resources, much higher than those of per capita population distribution of resources. This is not surprising given that most resource planning programs have considered population size [26]. But few have been concerned about the geographic density of resources. Conversely, health services operated in scarcely populated, large geographic catchments are often poorly resourced because they are more expensive to operate [27]. However, residents living in less populated areas, such as rural districts, are often disadvantaged in China with lower income and less support. Those people deserve more policy attention.
We found significant regional disparities in the distribution, in particular the geographic distribution of health resources. The eastern developed region has a higher level of resources than the other two regions. This finding is consistent with other studies [27]. The larger size and the higher density of populations in the eastern region mean that its operational costs of health services are relatively cheaper. Meanwhile, the decentralized governmental budgeting process means that the wealthy eastern provinces have a higher financial capacity to fund health services. The health services in the eastern region can also offer a better salary and welfare to health workers, enticing quality health workers from the less developed regions to move to the east. Indeed, previous studies show that.most quality health resources are concentrated in hospitals, especially in tertiary hospitals, of which 46.68% are located in the eastern provinces in China. It was estimated that 30% of provinces in China have attracted 50% of quality health resources [6].
The outpatient visits to primary care institutions outnumbered those to hospitals, not only because the number of primary care institutions is large, but also because they are geographically close to residents, easy to access, and cheap. Understandably, most people chose hospitals for inpatient care. What is concerning is that the volume of inpatient care grew much faster than outpatient care over the years from 2010 to 2014, in particular for those provided by the hospital sector. This is aligned with the stronger growth of hospital resources. At the same time, the growth of outpatient care services was marginal, indicating a relatively weaker primary care sector.
Regional disparities exist in health services utilization. Residents living in the eastern developed zone were more likely to use hospitals for outpatient care than their poorer central and western counterparts. On the other hand, residents living in the western undeveloped zone were more likely to use primary care institutions for inpatient care than their eastern and central counterparts. This is clearly associated with the gap in income level and health expenditure [28–30]. The CI indicates that outpatient care provided by hospitals tends to concentrate on the richer; whereas, inpatient care provided by primary care institutions tends to concentrate on the poorer. Such a two-tier system is worrisome. Empirical evidence shows that both the overuse of services (such as hospital care) and the under use of services (such as primary care) coexist in China [31].
The internal disparities within each economic zone further illustrate the regional differences in the equality of health care. The eastern developed region has a much higher level of inequality compared with the other regions. Similar results were also found in previous studies [32]. The inequality in outpatient care and hospital inpatient care, as indicated by the CI values, was actually growing in the eastern region, enlarging the regional gaps in CI. In addition, the regional CI gap in inpatient care provided by primary care institutions, the only service that tends to concentrate on the poor, shrank over the years. The less developed regions have to learn how to mitigate the risk of growing inequality in their development process.
This study has several policy implications. Firstly, more health resources, especially quality health worker, should be allocated to primary care institutions in order to narrow the capacity gap between hospitals and primary care institutions. Secondly, regional disparities need to be addressed. This can only be done through financial transfer coordinated by the central government. The current governmental budgeting system and the social health insurance arrangements in China are highly decentralized and fragmented, preventing the central government from fulfilling this role. Thirdly, more attention needs to be paid to the potential emergence of a two-tier system, where the well-resourced facilities (such as hospitals) favor the rich and the poorly resourced facilities (such as primary care institutions) favor the poor. Finally, a tiered health care delivery system needs to be developed, in which the function of primary care institutions complements that of hospitals. Consumers should be able to access different services based on their health care needs, not their ability to pay.
Limitations
This study analyzed a 5-year trend in the change of equality of health resources and health services. It would be interesting to perform further analyses on the longer term changes when data are made available. The indicators selected in this study were restricted by the availability of data. Although they are consistent with other studies, they may not be comprehensive enough to reflect the entire picture of inequality in health resources and health services. For example, no significant inequality in hospital inpatient care was observed in this study. However, the less affluent patients are more likely to end their hospital stay prematurely than their more affluent counterparts due to financial barriers imposed by deductible and co-payment requirements. Unfortunately, those indictors are not available at this stage. We are also unable to decompose CI due to the limited availability of data.
Conclusion
Significant inequality in the geographic distribution of health resources is evident, despite a more equitable per capita distribution of resources. The residents living in the eastern developed region are more likely to use the well-resourced hospitals for outpatient care. By contrast, the residents living in the western undeveloped region are more likely to use the poorly-resourced primary care institutions for inpatient care. Apart from regional disparities, inequality within each region also exists. The wealth-related inequality in the eastern developed region is increasing, further enlarging the regional gaps in CI.
Acknowledgements
Not applicable.
Funding
Not applicable
Availability of data and materials
The datasets analyzed during the current study are available from: http://www.nhfpc.gov.cn/zwgkzt/tjnj/list.shtml.
Authors’ contributions
All authors made significant contributions to the study. ZT and JR conceptualized this study. SLQ collected and analyzed the data. ZT and JR wrote the first draft of the manuscript. CL interpreted the results and revised the manuscript. JX critically commented the paper. The final version submitted for publication was read and approved by all authors.
Competing interests
The authors declare that they have no competing interests.
Consent for publication
Not applicable
Ethics approval and consent to participate
Not applicable
Contributor Information
Tao Zhang, Email: lucky1230405@163.com.
Yongjian Xu, Email: xyjdyx@126.com.
Jianping Ren, Email: 18768429445@163.com.
Liqi Sun, Email: 984077581@qq.com.
Chaojie Liu, Email: c.liu@latrobe.edu.au.
References
- 1.Cutler DM, Lleras-Muney A, Vogl T. The Oxford Handbook of Health Economics. New York: Oxford University Press; 2011. Socioeconomic status and health: dimensions and mechanisms. [Google Scholar]
- 2.Sala-i-Martin X. Health and Economic Growth: Findings and Policy Implications. MA: MIT Press; 2005. On the Health-poverty Trap. [Google Scholar]
- 3.Ying MAO, Fei XU, Ming-jun ZHANG, et al. Equity of health service utilization of urban residents: data from a western Chinese city. Chin Med J. 2013;126(13):2510–2516. [PubMed] [Google Scholar]
- 4.Chen M, Chen W, Zhao Y. New evidence on financing equity in China's health care reform-a case study on Gansu province China. BMC Health Serv Res. 2012;12(1):466. doi: 10.1186/1472-6963-12-466. [DOI] [PMC free article] [PubMed] [Google Scholar]
- 5.Luo J, Zhang X, Jin C, Wang D. Inequality of access to health care among the urban elderly in northwestern China. Health Policy. 2009;93(2-3):111–117. doi: 10.1016/j.healthpol.2009.06.003. [DOI] [PubMed] [Google Scholar]
- 6.Xinyu Z, Lin Z, Zhuang C, Yaogang W. Study on equity and efficiency of health resources and services based on Key indicators in China. PLoS One. 2015;10(12):e0144809. doi: 10.1371/journal.pone.0144809. [DOI] [PMC free article] [PubMed] [Google Scholar]
- 7.Kreng VB, Yang C-T. The equality of resource allocation in health care under the national health insurance system in Taiwan. Health Policy. 2011;100:203–210. doi: 10.1016/j.healthpol.2010.08.003. [DOI] [PubMed] [Google Scholar]
- 8.Zhao Y, Chen R, Wang B, Wu T, Huang Y, et al. General practice on-the-Job training in Chinese urban community: a qualitative study on needs and challenges. PLoS One. 2014;9:e94301. doi: 10.1371/journal.pone.0094301. [DOI] [PMC free article] [PubMed] [Google Scholar]
- 9.Baorong Y, Qingyue M, Charles C, et al. how does the New cooperative medical scheme influence health service utilization? a study in two provinces in rural China. BMC Health Serv Res. 2010;10:116. doi: 10.1186/1472-6963-10-116. [DOI] [PMC free article] [PubMed] [Google Scholar]
- 10.Xiaoyun L, Shenglan T, Baorong Y, et al. Can rural health insurance improve equity in health care utilization? a comparison between China and Vietnam. Int J Equity Health. 2012;11:10. doi: 10.1186/1475-9276-11-10. [DOI] [PMC free article] [PubMed] [Google Scholar]
- 11.Yuan S, Hong Y, Klemetti R, et al. Equity in use of maternal health services in western rural China: a survey from Shaanxi province. BMC Health Serv Res. 2014;14:155. doi: 10.1186/1472-6963-14-155. [DOI] [PMC free article] [PubMed] [Google Scholar]
- 12.Yalan L, Yi J, Shenglan T, et al. Analysis of the equity of emergency medical services: a cross-sectional survey in Chongqing city. Int J Equity Health. 2015;14:150. doi: 10.1186/s12939-015-0282-8. [DOI] [PMC free article] [PubMed] [Google Scholar]
- 13.Zhongliang Z, Jianmin G, Ashley F, et al. Measuring the equity of inpatient utilization in Chinese rural areas. BMC Health Serv Res. 2011;11:201. doi: 10.1186/1472-6963-11-201. [DOI] [PMC free article] [PubMed] [Google Scholar]
- 14.Xiaopeng Z, Yuqi X, Jing Y, et al. Analysis of government investment in primary healthcare institutions to promote equity during the three-year health reform program in China. BMC Health Serv Res. 2013;13:114. doi: 10.1186/1472-6963-13-114. [DOI] [PMC free article] [PubMed] [Google Scholar]
- 15.Rui C, Yali Z, Juan D, et al. Health workforce equity in urban community health service of China. PLoS One. 2014;9(12):e115988. doi: 10.1371/journal.pone.0115988. [DOI] [PMC free article] [PubMed] [Google Scholar]
- 16.Li-Mei H. Advancing primary care to promote equitable health: implications for China. Int J Equity Health. 2012;11:2. doi: 10.1186/1475-9276-11-2. [DOI] [PMC free article] [PubMed] [Google Scholar]
- 17.China National Health and Family Planning Commission: China Health Statistical Yearbook. Beijing: Peking Union Medical College Press; 2013.
- 18.Druckman A, Jackson T. Measuring resource inequalities: the concepts and methodology for an area-based gini coefficient. Ecol Econ. 2008;65:242–252. doi: 10.1016/j.ecolecon.2007.12.013. [DOI] [Google Scholar]
- 19.Wagstaff A, Paci P, Van Doorslaer E. On the measurement of inequalities in health. Soc Sci Med. 1991;33:545–557. doi: 10.1016/0277-9536(91)90212-U. [DOI] [PubMed] [Google Scholar]
- 20.Theodorakis PN, Mantzavinis GD. measuring health inequalities in Albania: a focus on the distribution of general practitioners. Hum Resour Health. 2006;4:5. doi: 10.1186/1478-4491-4-5. [DOI] [PMC free article] [PubMed] [Google Scholar]
- 21.Wagstaff A. Analyzing health equity using household survey data. Washington: The World Bank; 2007. p. 92. [Google Scholar]
- 22.Ali AKBARISARI. Regional disparity in physical resources in the health sector in Iran: a comparison of Two time periods. Iran J Public Health. 2015;44(6):848–854. [PMC free article] [PubMed] [Google Scholar]
- 23.James M, Maria Fernanda L-C. Horizontal equity in health care utilization in Brazil, 1998–2008. Int J Equity Health. 2012;11:33–41. doi: 10.1186/1475-9276-11-33. [DOI] [PMC free article] [PubMed] [Google Scholar]
- 24.Fang P, Dong S. Regional inequality in health and its determinants: evidence from China. Health Policy. 2010;94:14–25. doi: 10.1016/j.healthpol.2009.08.002. [DOI] [PubMed] [Google Scholar]
- 25.Zhou Z, Su Y, Gao J, et al. Assessing equity of healthcare utilization in rural China: results from nationally representative survey from 1993 to 2008. Int J Equity Health. 2013;12:34. doi: 10.1186/1475-9276-12-34. [DOI] [PMC free article] [PubMed] [Google Scholar]
- 26.Lourdes L. Socioeconomic patterns in use of private and public health services in Spain and Britain: implications for equity in health care. Health Place. 2014;25:19–25. doi: 10.1016/j.healthplace.2013.09.011. [DOI] [PubMed] [Google Scholar]
- 27.Jian JIN, Jianxiang WANG, Xiaoyi MA, et al. Equality of medical health resource allocation in China based on the gini coefficient method. Iran J Public Health. 2015;44(4):445–457. [PMC free article] [PubMed] [Google Scholar]
- 28.Kim JI, Kim G. Country-level socioeconomic indicators associated with healthy life expectancy: income, urbanization, schooling, and internet users: 2000-2012. Soc Indic Res. 2016;129(1):391–402. doi: 10.1007/s11205-015-1107-2. [DOI] [Google Scholar]
- 29.Kim JI, Kim G. Social structural influences on healthy aging: community-level socioeconomic conditions and survival probability of becoming a centenarian for those aged 65 to 69 in South Korea. Int J Aging Hum Dev. 2015;81(4):241–259. doi: 10.1177/0091415015623550. [DOI] [PubMed] [Google Scholar]
- 30.Kim JI, Kim G. Factors affecting the survival probability of becoming a centenarian for those aged 70, based on the human mortality database: income, health expenditure, telephone, and sanitation. BMC Geriatr. 2014;14:113. doi: 10.1186/1471-2318-14-113. [DOI] [PMC free article] [PubMed] [Google Scholar]
- 31.Gao J, Qian J, Tang S, Eriksson BO, Blas E. Health equity in transition from planned to market economy in China. Health Policy Plan. 2002;17:20–29. doi: 10.1093/heapol/17.suppl_1.20. [DOI] [PubMed] [Google Scholar]
- 32.Wen L, Ying L, Peter T. National equity of health resource allocation in China: data from 2009 to 2013. Int J Equity Health. 2016;15:6. doi: 10.1186/s12939-016-0298-8. [DOI] [PMC free article] [PubMed] [Google Scholar]
Associated Data
This section collects any data citations, data availability statements, or supplementary materials included in this article.
Data Availability Statement
The datasets analyzed during the current study are available from: http://www.nhfpc.gov.cn/zwgkzt/tjnj/list.shtml.