

Abstract
Cellular metabolism dynamically regulates the epigenome via availability of the metabolite substrates of chromatin-modifying enzymes. The impact of diet on the metabolism-epigenome axis is poorly understood but could alter gene expression and influence metabolic health. ATP citrate-lyase produces acetyl-CoA in the nucleus and cytosol and regulates histone acetylation levels in many cell types. Consumption of a high-fat diet (HFD) results in suppression of ATP citrate-lyase levels in tissues such as adipose and liver, but the impact of diet on acetyl-CoA and histone acetylation in these tissues remains unknown. Here we examined the effects of HFD on levels of acyl-CoAs and histone acetylation in mouse white adipose tissue (WAT), liver, and pancreas. We report that mice consuming a HFD have reduced levels of acetyl-CoA and/or acetyl-CoA:CoA ratio in these tissues. In WAT and the pancreas, HFD also impacted the levels of histone acetylation; in particular, histone H3 lysine 23 acetylation was lower in HFD-fed mice. Genetic deletion of Acly in cultured adipocytes also suppressed acetyl-CoA and histone acetylation levels. In the liver, no significant effects on histone acetylation were observed with a HFD despite lower acetyl-CoA levels. Intriguingly, acetylation of several histone lysines correlated with the acetyl-CoA: (iso)butyryl-CoA ratio in liver. Butyryl-CoA and isobutyryl-CoA interacted with the acetyltransferase P300/CBP-associated factor (PCAF) in liver lysates and inhibited its activity in vitro. This study thus provides evidence that diet can impact tissue acyl-CoA and histone acetylation levels and that acetyl-CoA abundance correlates with acetylation of specific histone lysines in WAT but not in the liver.
Keywords: Acetyl-CoA, adipose tissue, diet, histone acetylation, liver
Introduction
The prevalence of obesity in the United States and around the world has risen dramatically in recent decades, with the percentage of individuals with a body mass index >30 doubling globally between 1980 and 2008 (1, 2). Obesity and poor diet contribute substantially to the global disease burden, predisposing individuals to diseases such as diabetes, cardiovascular disease, and several types of cancer, including those of the liver and pancreas (3, 4). Increased knowledge of the molecular links between diet and disease may help to reduce the disease burden caused by excess calorie consumption and poor nutrition.
Over the past decade, it has become clear that cellular metabolism exerts a profound and dynamic influence on histone modifications because of the fact that metabolic intermediates are substrates in many chromatin-modifying reactions (i.e. acetyl-CoA is the acetyl group donor for acetylation, whereas the methyl donor S-adenosylmethionine is required for methylation) (5–9). Although the connection between cell metabolism and chromatin modification has been documented in numerous studies using model organisms, mammalian cell culture systems, and cancer models (5–9), whether diet influences chromatin modifications in different tissues remains poorly understood. Moreover, the potential contributions of a dynamic diet-epigenome relationship to diseases such as cancer and diabetes are almost completely unknown.
A large body of literature supports the role of dietary micronutrients involved in S-adenosylmethionine production, such as folate, in maintaining proper levels of DNA methylation during embryonic development (10–12). Both epidemiologic and experimental data support the concept that parental diet can influence genomic imprinting and offspring phenotypes (11, 12). Moreover, dietary folate intake has been linked to altered DNA methylation in cancer (10). In addition, data have emerged recently that support a role of diet in influencing histone modifications in adulthood in a dynamic and reversible manner. For example, levels of histone H3 lysine 4 trimethylation in the liver are sensitive to dietary intake of methionine (13). The ketone body β-hydroxybutyrate can also act as a histone deacetylase inhibitor that elevates tissue histone acetylation levels and alters gene expression patterns under ketogenic dietary conditions (14). Finally, it has recently been shown that short-chain fatty acids produced by gut microbiota influence host tissue histone acetylation and methylation in a diet-dependent manner (15).
Histone acetylation is a highly dynamic chromatin modification (16, 17). In diverse systems, from yeast and flies to mammalian cells, histone acetylation is sensitive to the availability of acetyl-CoA (18–23). Many lysine acetyltransferases (KATs)5 are also subject to product inhibition by CoA; the ratio of acetyl-CoA:CoA may also be important for metabolic regulation of histone acetylation (21, 24–26).
Acetyl-CoA is compartmentalized into mitochondrial, nuclear, and cytosolic pools. Mitochondrial acetyl-CoA cannot directly cross the mitochondrial membrane but, instead, is transferred to the cytosol via citrate export and conversion to acetyl-CoA by ATP citrate-lyase (ACLY) (6). ACLY has been shown to regulate histone acetylation levels and influence gene regulation in diverse mammalian cell types (19, 21, 27–29), and histone acetylation is responsive to glucose availability in an ACLY-dependent manner (19, 21, 30). We have shown previously that Acly silencing impairs histone acetylation and expression of select genes such as Glut4 during 3T3-L1 adipocyte differentiation (18). More recently, we have reported the generation of mice lacking ACLY in adipose tissue (AclyFAT−/− mice), which exhibit normal body weight and adipose tissue architecture but reduced expression of Glut4 and lower acetylation of some histone tail lysines (30). ACLY is highly regulated by dietary conditions; its expression is induced by high carbohydrate exposure and suppressed upon high-fat feeding (31–34). Long-term high-fat feeding has been shown to influence the liver metabolome, including altering the levels of several acyl-CoA species (35). However, the influence of a high-fat diet (HFD) on global histone acetylation and its relationship to acetyl-CoA levels is not known. If consuming a diet high in fat impacts the levels of histone acetylation in tissues, then gene expression programs and even predisposition to diabetes, cancer, and other diseases could potentially be influenced.
In this study, we investigated whether high-fat feeding alters tissue acyl-CoA and histone acetylation levels. We report that 4 weeks of high-fat feeding results in suppression of acetyl-CoA and/or the acetyl-CoA:CoA ratio in the liver, WAT, and pancreas in mice. Moreover, several histone acetylation marks trend downwards in each of these tissues in high-fat diet-fed mice, with significant reductions in histone H3 lysine 23 acetylation (H3K23ac) observed in WAT and H3K18ac and H3K23ac in the pancreas. Consistently, acute genetic deletion of Acly in cultured adipocytes reduced acetyl-CoA abundance and suppressed acetylation of histone lysines, including H3K23. Although no significant differences in histone acetylation were observed with diet in the liver, the acetyl-CoA:(iso)butyryl-CoA ratio positively correlated with marks such as H3K9ac and H3K14ac. Both butyryl-CoA and isobutyryl-CoA interacted with the acetyltransferase P300/CBP-associated factor (PCAF) in liver extracts and inhibited in vitro histone acetylation by PCAF, suggesting that these metabolites may function as endogenous inhibitors. Thus, metabolism may exert complex influences on histone acetylation in liver. Together, these data indicate that diet influences both acyl-CoA and histone acetylation levels in murine tissues and that, at least in WAT, a correlation between histone acetylation and acetyl-CoA levels is observed.
Results
A High-fat Diet Suppresses ACLY and ACSS2 Levels in WAT and Liver
To assess whether diet impacts the levels of histone acetylation and acyl-CoA species within tissues, C57Bl/6 mice were fed either regular chow (RC) or an HFD (60% kcal from fat). One cohort of mice received the diets for 5 days and a second group of animals for 4 weeks. Mice consuming the HFD showed a trend toward increased body weight and significantly increase blood glucose levels after 5 days already (Fig. 1, A and B), and both body weight and blood glucose levels were significantly elevated after 4 weeks of dietary intervention (Fig. 1, C and D).
FIGURE 1.

Mouse response to dietary intervention. A–D, C57Bl/6 mice were fed either RC (white columns) or an HFD (gray columns) for 5 days (n = 5/group) or 4 weeks (n = 10/group). Weight gain (in grams, compared with the weight at day 0) and blood glucose after 5 days (A and B, respectively) or 4 weeks (C and D) in the indicated diet. Graphs represent mean ± S.D. Significance was assessed by two-tailed unpaired t test. *, p < 0.05; **, p < 0.01; ***, p < 0.001.
4 weeks of HFD was sufficient to potently suppress levels of the de novo lipogenesis (DNL) proteins ACLY, acyl-CoA synthetase short-chain family member 2 (ACSS2), and fatty acid synthetase (FASN) in perigonadal WAT (pgWAT) (Fig. 2, A and B). ACLY and ACSS2 were also suppressed in the liver (Fig. 2, C and D). No clear effect of diet on DNL proteins was observed in the pancreas, much of which is the exocrine compartment (Fig. 2, E and F). 5 days of dietary intervention were not sufficient to alter the protein levels of DNL enzymes in any of the tissues examined (data not shown).
FIGURE 2.

Suppression of ACLY, ACSS2, and FASN levels by HFD. A–F, Western blotting analysis for proteins involved in de novo lipogenesis in pgWAT (A, quantified in B), liver (C, quantified in D), and pancreas (E, quantified in F). B.T. indicates below background threshold set for detection in ImageJ. Graphs represent mean ± S.D. Dots show individual data points. Significance was assessed by two-tailed t test. *, p < 0.05; **, p < 0.01.
A High-fat Diet Suppresses Acetyl-CoA and/or the Acetyl-CoA:CoA Ratio in the Liver, Fat, and Pancreas
We investigated whether dietary manipulation impacted metabolite levels and protein acetylation. First, we measured the relative abundance of short- and medium-chain acyl-CoA species in freeze-clamped hepatic tissue in all experimental groups. After a short exposure to an HFD (5 days), no consistent differences were observed in any acyl-CoA metabolite we analyzed (data not shown). After 4 weeks of HFD feeding, acetyl-CoA abundance in the liver was significantly suppressed (Fig. 3A). The CoA level was unaltered by diet, and the acetyl-CoA: CoA ratio was also significantly reduced in the liver following HFD feeding (Fig. 3A). Propionyl-CoA was also reduced with an HFD, although other acyl-CoA species measured were not significantly altered by diet (Fig. 3B).
FIGURE 3.

Acetyl-CoA and/or the acetyl-CoA:CoA ratio is/are suppressed by HFD. A–F, quantification of acyl-CoA species in the liver (A and B; n = 9 for RC, n = 10 for HFD), perigonadal WAT (C and D; n = 10 for RC, n = 10 for HFD), and pancreas (E and F; n = 4 for RC, n = 5 for HFD) of mice fed with either RC (white columns) or HFD (gray columns) for 4 weeks. Acyl-CoA measurements were normalized to internal standards, as described under “Experimental Procedures” and expressed as relative levels, with RC mean set to 1. For acetyl-CoA, CoA, the ratio between relative abundance of acetyl-CoA and relative abundance of CoA for each animal is depicted. (iso)Butyryl-CoA shows the abundance of both isobutyryl-CoA and butyryl-CoA, as the two isomers could not be discriminated. Data are graphed as mean ± S.D., with data from individual animals represented as dots. For A, C, and E, statistical significance was assessed by two-tailed t test (*, p < 0.05; **, p < 0.01; or as indicated). For B, D, and F, significance was assessed by two-tailed t tests and corrected for multiple comparisons using the Holm-Sidak method (α = 0.05). The p values are indicated on the graphs.
In WAT, acetyl-CoA abundance trended downwards with HFD and the acetyl-CoA: CoA ratio was significantly suppressed (Fig. 3C). Propionyl-CoA, (iso)butyryl-CoA (butyryl-CoA and isobutyryl-CoA mass spectra could not be distinguished), 3-hydroxybutyryl-CoA, and crotonyl-CoA were also significantly reduced by HFD (Fig. 3D). In pancreas, acetyl-CoA was suppressed by HFD, and no alterations in other acyl-CoAs were detected (Fig. 3E and F). Thus, 4 weeks of HFD feeding were sufficient to alter tissue acyl-CoA profiles, particularly in WAT. Notably, a fat-rich diet suppressed acetyl-CoA abundance and/or the acetyl-CoA:CoA ratio in multiple organs, suggesting the potential of diet to influence histone acetylation.
Histone Acetylation Is Impacted by a High-fat Diet
To investigate whether histone acetylation is impacted by diet, we used mass spectrometry to quantify acetylation of histones extracted from the liver, pancreas, and WAT of control and HFD-fed mice. Similar to what was observed with acyl-CoA profiles, 5 days of HFD did not alter liver histone acetylation levels (data not shown). Moreover, in the liver, no alterations were observed even at 4 weeks of HFD (Fig. 4A). In both pancreas and WAT, however, significant reductions in H3K23ac were detected after 4 weeks of HFD (Fig. 4, B and C). H3K18ac was also significantly suppressed in the pancreas and showed a strong trend toward suppression (p = 0.056) in WAT (Fig. 4, B and C). Several other marks showed a similar trend but failed to reach statistical significance (Fig. 4, B and C). Thus, in WAT and pancreas, either acetyl-CoA or the acetyl-CoA:CoA ratio and certain histone acetylation marks were suppressed by HFD.
FIGURE 4.

Specific histone acetylation marks are suppressed by HFD in WAT and pancreas. A–C, histones were extracted from the liver (A), perigonadal WAT (B), and pancreas (C) of mice fed either RC (white columns) or HFD (gray columns) for 4 weeks (n = 5/group). Values are expressed as percent of each lysine that is acetylated. Data are graphed as mean ± S.D., with data from individual animals represented as dots. Statistical significance was assessed by two-tailed t test (*, p < 0.05; **, p < 0.01; or as indicated).
From nine individual animals, measurements of acetyl-CoA, CoA, and histone acetylation were available in WAT, allowing us to test correlations. H4K8ac, which trended downward with HFD in WAT (Fig. 4B), correlated most strongly with acetyl-CoA levels (Spearman r = 0.9333, p = 0.0007) (Fig. 5). Of note, H4K12ac uniquely displayed a negative correlation with both acetyl-CoA and the acetyl-CoA:CoA ratio in WAT, and both H4K16ac and H4K18ac showed essentially no relationship with these metabolites. Several other marks, including H3K23ac and H4K14ac, showed positive correlations with acetyl-CoA and the acetyl-CoA:CoA ratio in WAT (Fig. 5).
FIGURE 5.
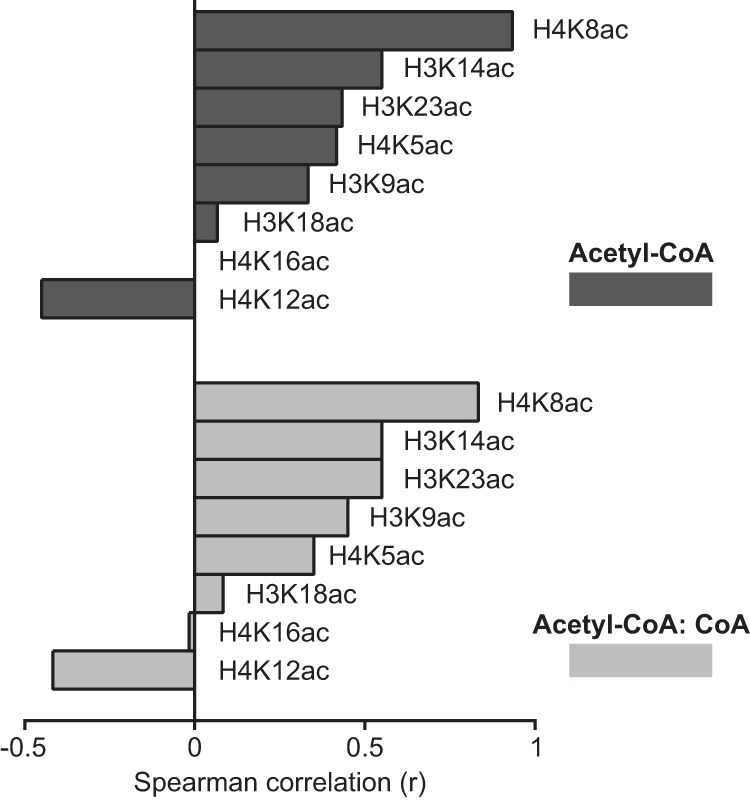
Correlation between acetyl-CoA and histone acetylation in pgWAT. Spearman correlation (r) was calculated for the indicated relationships (n = 9 animals). Significant correlations are with acetyl-CoA, H4K8ac (r = 0.933, p = 0.0007) and with acetyl-CoA:CoA, H4K8ac (r = 0.8333, p = 0.0083).
These data suggest that diet-induced ACLY suppression could impact acetyl-CoA abundance and histone acetylation in adipocytes. To directly test whether acute suppression of ACLY in mature adipocytes would alter acetyl-CoA and histone acetylation levels, we isolated and immortalized preadipocytes from the stromal-vascular fraction of inguinal WAT of Aclyf/f mice (hereafter identified as the 5A cell line). Upon induction of differentiation, 5A cells differentiate into mature, lipid droplet-containing adipocytes, as assessed by Oil Red O staining for neutral lipids (Fig. 6A). After differentiation, 5A cells were infected with Adeno-Cre, allowing an efficient deletion of the Acly gene (Fig. 6, A–C). Deletion of Acly reduced the lipid content of adipocytes (Fig. 6A) but did not alter the expression of markers of differentiated adipocytes, including Fabp4, Pparg2, and Adipoq. Notably, Glut4 mRNA was reduced (Fig. 6B), consistent with our prior findings (19, 30). ACLY deficiency caused a marked reduction in H3K14ac and H3K23ac but not H4K12ac (Fig. 6C), similar to what was observed with HFD in WAT. Moreover, acetyl-CoA abundance and the acetyl-CoA:CoA ratio were suppressed upon Acly deletion (Fig. 6D). Administration of Adeno-Cre to Acly+/+ adipocytes had no effect on histone acetylation (data not shown). Thus, reducing ACLY levels acutely in mature adipocytes is sufficient to suppress both acetyl-CoA and histone acetylation levels.
FIGURE 6.

Genetic deletion of Acly decreases global histone acetylation. Aclyfl/fl preadipocytes (5A) were differentiated and then either mock-treated (mock, white columns) or infected with Adeno-Cre virus (Cre, gray columns). After 4 days, cells were analyzed. A, Oil Red O staining for neutral lipids. The whole plate is shown on the left. B, mRNA expression of the indicated genes. C, Western blotting analysis for the indicated cytosolic proteins (top panel) and histone marks and nuclear fraction (center panel). Ponceau is shown in the bottom panel as a loading control for isolated histones. Shown are two biological replicates. D, quantification of acetyl-CoA, CoA, and the acetyl-CoA:CoA ratio (n = 6/group). Measurements were normalized to internal standards and expressed as relative levels, with mock mean set to 1. Data are graphed as mean ± S.D., with data from individual replicate represented as dots. For B and D, statistical significance was assessed by two-tailed t test (*, p < 0.05; **, p < 0.01; ***, p < 0.001).
Because histone acetylation levels in the liver were not altered by diet, we asked whether, irrespective of diet, acetyl-CoA levels or the acetyl-CoA:CoA ratio correlated with histone acetylation levels in the liver. These correlations were found to be weak in the liver (Fig. 7A). This could reflect a variety of factors, including acetyl-CoA compartmentalization (mitochondrial acetyl-CoA, which is inaccessible for histone acetylation (18), might account for much of the tissue acetyl-CoA measured in the liver), compensatory changes in KAT levels or activity, or the influence of other metabolic factors. In addition to the feedback inhibitor CoA, it has recently been shown that KATs are inhibited by other acyl-CoAs (i.e. palmitoyl-, butyryl-, and propionyl-CoA (24)). Therefore, we asked whether a relationship exists between liver histone acetylation and any of these endogenous metabolites. Intriguingly, the acetyl-CoA:(iso)butyryl-CoA ratio correlated positively with several histone acetylation marks, most strongly H3K9Ac (Spearman r = 0.6176, p = 0.0096) (Fig. 7A). To ask whether butyryl-CoA or isobutyryl-CoA is capable of inhibiting PCAF (a major H3K9 KAT (36)), we applied a chemical approach that reports on the ability of small molecules to interact with KAT active sites in cell lysates (Fig. 7B) (26). Using this approach, we found that, in addition to interacting with acetyl-CoA and CoA (Fig. 7, C and D), PCAF can interact strongly with both butyryl-CoA and isobutyryl-CoA in liver lysates derived from either RC- or HFD-fed mice (Fig. 7, C–F). Moreover, both metabolites could inhibit in vitro histone acetylation by PCAF in a dose-dependent manner (Fig. 7G). These data suggest the possibility that accumulation of acyl-CoAs such as butyryl-CoA or isobutyryl-CoA could inhibit histone acetylation.
FIGURE 7.

Correlation between the acetyl-CoA:(iso)butyryl-CoA ratio and histone acetylation in the liver. A, correlation between the levels of histone acetylation and acetyl-CoA measurements or acetyl-CoA:metabolite ratios in the livers of RC- and HFD-fed mice (n = 17). Spearman correlations (r) are graphed. Significant correlations with acetyl-CoA:(iso)butyryl-CoA ratio include H3K9ac (r = 0.6176, p = 0.0096), H3K14ac (r = 0.4926, p = 0.0465), H3K23ac (r = 0.5098, p = 0.0366), and H4K5ac (r = 0.4975, p = 0.0421). B, schematic for the workflow used to profile KAT activity as described previously (25). C–F, pulldown of PCAF by the KAT chemoproteomic probe in the presence of the indicated competitors, shown by Western blot (C and E) and quantified in D and F, respectively. Proteomes were obtained from pools of livers (n = 3/group) from mice fed either with RC (white columns) or HFD (gray columns). N.A., data not acquired G, rate of in vitro acetylation of H3K14 by PCAF in the presence of acetyl-CoA with the indicated concentrations of butyryl-CoA or (iso)butyryl-CoA. Graphs represent mean ± S.D. Significance was assessed by two-tailed t test, and each condition was compared with mock. ***, p < 0.001.
Together, these data indicate that histone acetylation can be impacted by diet, but the effects are not equivalent among different tissues. In the liver, diet has a minimal impact on histone acetylation levels, and histone acetylation does not closely correlate with acetyl-CoA abundance. In WAT, HFD suppresses the levels of ACLY and ACSS2, the acetyl-CoA:CoA ratio, and some histone acetylation marks. Several histone acetylation marks correlate positively with acetyl-CoA levels in WAT, pointing to a dynamic relationship between diet, metabolite levels, and the epigenome.
Discussion
In this study, we report that HFD results in suppression of acetyl-CoA levels and/or the acetyl-CoA:CoA ratio in murine WAT, liver, and pancreas. In addition, specific histone acetylation marks, such as H3K23ac, are suppressed in WAT and pancreas in HFD-fed mice. In WAT, several marks, most strongly H4K8Ac, correlated positively with acetyl-CoA levels. 4 weeks of HFD were found to have no significant impact on histone acetylation in the liver, although the acetyl-CoA:(iso)butyryl-CoA ratio correlated with marks such as H3K9ac regardless of diet. The results of this study suggest that lower histone acetylation levels in WAT of HFD-fed mice could be a consequence of suppressed ACLY and acetyl-CoA levels, an interpretation that is bolstered by our findings that acute deletion of Acly from mature adipocytes in vitro suppresses both acetyl-CoA and histone acetylation levels. Consistently, we have also reported that AclyFAT−/− mice exhibit reduced levels of histone acetylation in subcutaneous WAT in vivo. Interestingly, some histone acetyl marks (e.g. H3K23ac) appear to be more severely affected by targeting ACLY both in vitro and in vivo. H3K23ac is also impacted by HFD in mice, further supporting a causative link between diet, ACLY expression, and histone acetylation.
An additional caveat is that whole tissue acyl-CoA measurements may not reflect the availability of these metabolites to KATs within the nucleus. It is likely that measurements of nuclear or nuclear-cytosolic pools of acetyl-CoA would more closely correlate with histone acetylation levels. Recently, a methodology for the quantitation of mitochondrial matrix metabolites, which involves tagging of mitochondria to enable their rapid isolation, has been reported (37). Such strategies for subcellular metabolite quantitation may help to further define the relationship between metabolism and chromatin modification.
This study provides initial insights that chromatin modifications may be dynamically regulated in adult animals in response to diet. In the future, it will be important to investigate both the underlying mechanisms of diet-induced changes in histone acetylation as well as the functional impact of this on gene regulation and metabolic phenotypes. Because Glut4 expression is suppressed in the absence of ACLY (Refs. 19, 30 and this study), and GLUT4 is responsible for insulin-stimulated glucose uptake in adipocytes, it is plausible that HFD-induced suppression of ACLY levels could contribute to the development of insulin resistance in part through the role of ACLY in regulating the expression of genes such as Glut4.
Another intriguing question raised by this study is the extent to which other acyl-CoAs might contribute to the regulation of histone acetylation or acylation in vivo. Histone crotonylation, for example, has been shown to impact gene regulation and is sensitive to crotonyl-CoA levels generated in part by ACSS2 (38). Both crotonyl-CoA and ACSS2 levels were suppressed by HFD in WAT; further investigation into the impact of diet on histone crotonylation may thus point toward new mechanisms of gene regulation in response to diet. In addition, it has been shown in principle that acyl-CoAs such as palmitoyl-CoA and butyryl-CoA can inhibit KATs (24), although in vivo circumstances in which this definitively occurs have yet to be identified. This study provides evidence for this possibility by pointing to a correlation between the acetyl-CoA:(iso)butyryl-CoA ratio and histone acetylation in the liver. In vitro acetylation assays validate this hypothesis in principle, although further studies manipulating the availability of (iso)butyryl-CoA in cells or tissues will be required to define physiological conditions under which such regulation occurs. Butyryl-CoA levels can accumulate under conditions of defective fatty acid oxidation, such as in SCAD−/− mice, which lack short-chain acyl-CoA dehydrogenase (SCAD). In livers of SCAD−/− mice, butyryl-CoA levels can accumulate to levels as high or higher than acetyl-CoA (39), suggesting a potentially interesting context to further test this concept.
In summary, we report that exposure of adult mice to a high-fat diet can impact levels of acetyl-CoA and histone acetylation in tissues and that the relationship between these is different in WAT and liver. In WAT, but not in liver, acetyl-CoA levels were found to correlate with levels of certain histone acetylation marks. These data align with the concept that histone acetylation is a dynamic, metabolically sensitive chromatin modification and raise a number of questions for future investigation regarding the mechanisms through which diet exerts these effects and the influence of the diet-induced changes in acetylation of histones and other proteins on systemic metabolic control.
Experimental Procedures
Animals and Diet
6-Week-old male C57Bl/6J black mice were purchased from The Jackson Laboratory. Mice were housed at the animal facility of the University of Pennsylvania. Mice were allowed to acclimatize to the new environment for 1 week prior to initiation of the study. Mice were fed with either the standard facility chow (RC, 13.5% of total calories from fat) or a high-fat diet (60% of total calories from fat, Research Diet, Inc., D12492). The food was replaced every 7 days, and the mice were weighed weekly. Prior to sacrifice, blood glucose was measured from the tail vein by glucometer. Mice were sacrificed by cervical dislocation, and tissues, except those used for histone acetylation analysis, were quickly harvested by freeze clamp and stored at −80 °C. Tissues used for histone acetylation analysis were processed fresh as described below. Each group of short-term diet-fed mice contained five mice. For the 4-week study, there were two time-staggered groups (n = 5/diet in each group for a total of n = 10/diet). Liver histone acetylation and acyl-CoA levels were measured in all animals (n = 10/diet). From visceral (perigonadal) WAT, acyl-CoA was measured from all animals (n = 10/diet), and histone acetylation levels were measured from one group (n = 5/diet). For the pancreas, acyl-CoA was measured from one group (n = 5/diet), and histone acetylation was measured from one group (n = 5/diet). Analysis of histone acetylation and acyl-CoAs in mouse samples was conducted in a blinded manner. To do this, the scientist who conducted the mouse work assigned an ID number to each animal and provided only the mouse ID number (but not the corresponding diet information) to the scientists who performed the acyl-CoA and histone acetylation measurements. For a few samples, data were unable to be acquired because of technical issues. All animal work was approved by the University of Pennsylvania Institutional Animal Care and Use Committee.
Western Blots
Snap-frozen tissue (about 100 mg) was lysed in radioimmune precipitation assay buffer (1% Nonidet P-40, 0.5% deoxycholate, 0.1% SDS, 150 mm NaCl, 50 mm Tris-HCl (pH 8.0), and freshly added 1× protease inhibitors) for 30 min at 4 °C and mechanically dissociated using TissueLyser (Qiagen). The lysates were sonicated at 30% duty cycle and an output control setting of 3–4. The sonicated samples were pelleted for 5 min and 16,000 relative centrifugal force, and the supernatant was collected and quantified by BSA (Thermo Scientific). Samples were prepared for Western blotting analysis through Invitrogen NuPAGE and BOLT gel systems. Blot quantitation was performed using ImageJ software. The antibodies used for Western blots included the following: ACLY (described previously (19)), ACSS2 (Cell Signaling Technology, 3658S), tubulin (Sigma, T6199), FASN (Cell Signaling Technology, 3189S), acetyl-CoA carboxylase (Cell Signaling Technology, 3676), PCAF (Cell Signaling Technology, 3378), H3K14ac (Cell Signaling Technology, 7627S), H3K23ac (Cell Signaling Technology, 9674S), H4K8ac (Cell Signaling Technology, 2594), H4K12ac (Millipore, 06-761-MN), and H4 (Millipore, 05-858). The secondary antibodies were IRDye680RD goat anti-mouse (LI-COR, 926-68070) and IRDye800CW goat anti-rabbit (LI-COR, 926-32211). Molecular weight ladders were SeeBlue Plus2 Pre-Stained Standard (Life Technologies, for the blots in Fig. 2), BLUEstain Protein Ladder (Gold Biotechnology, for the blots in Fig. 6), MagicMark XP Western Protein Standard (Thermo Fisher, for the blots in Fig. 7), and BenchMark Pre-Stained Protein Ladder (Thermo Fisher, for the Ponceau stainings in Fig. 7).
Generation of Aclyf/f (5A) Preadipocyte Cell Lines
Aclyf/f preadipocyte cell lines were generated by isolating the stromal-vascular fraction from the inguinal WAT of two 13-week-old male Aclyf/f mice. WAT was minced and then digested in DMEM, collagenase, and dispase at 37 °C for 25 min, vortexing every 10 min. The resulting cell suspension was then filtered through a 100-μm mesh filter and spun down at 500 × g for 5 min. The resulting pellet was suspended in DMEM F12 + 10% heat-inactivated FBS, 1% penicillin/streptomycin, and 0.1% primocin. Cells were plated into Corning CellBIND 12-well plates (product 3336). 24 h later, cells were washed in PBS and placed into fresh medium for an additional 24 h. In parallel, Phoenix E cells were used to generate a retrovirus using the pBABE-neo largeTcDNA plasmid (a kind gift from P. Seale). The virus, in addition to Polybrene, was added to preadipocytes for 24 h. Cells were passaged every time they reached 80% confluency. Cells that were passaged at least six times were then tested for the ability to differentiate. 5A cells were selected for further use based on potent adipocyte differentiation.
Adipocyte Culture and Experiments
5A cells were plated in 12-well plates (2 × 10⁵ cells/well) in DMEM/F12 (Gibco, 11320-033) and 10% heat-inactivated fetal bovine serum (hiFBS, Gibco, 10438-018). After 4 days (2 days post-confluence), the culture medium was replaced with induction medium (DMEM/F12, 10% hiFBS, 0.05 mm isobutylmethylxanthine (Sigma-Aldrich, I-7018),10 μm dexamethasone (Sigma-Aldrich, D-1881), 5 μm troglitazone (Sigma-Aldrich, T-2573), and 5 μg/ml insulin (Sigma-Aldrich, I-5500)). At day 3 post-induction, the medium was replaced with maintenance medium (DMEM/F12, 10% hiFBS, and 5 μg/ml insulin). At day 4, cells were infected with Ad-Cre virus (2 × 10¹¹ viral particles/ml for 6 h), obtained from the University of Pennsylvania Vector Core. After 6 h, virus-containing medium was replaced with maintenance medium (further replaced at days 6 and 7 post-induction). At day 8, cells were harvested. For histone and protein extraction, cells were lysed in 1 ml of ice-cold NIB250 and 0.2 Nonidet P-40 and processed as described previously (21). For acetyl-CoA quantification, cells were scraped in medium, washed in ice-cold PBS, and resuspended in 1 ml of 10% (w/v) trichloroacetic acid (Sigma-Aldrich, St. Louis, MO, catalog no. T6399) and 100 μl of internal standard (see below) and processed as described below. For mRNA quantification, cells were lysed in 1 ml TRIzol® reagent (Thermo Fisher Scientific, 15596018) and processed as described in the instructions from the manufacturer.
cDNA Synthesis and Quantitative PCR
1.5 μg of mRNA was retrotranscribed using High Capacity RNA-to-cDNA (Applied Biosystems, 4387406). cDNA samples were diluted 1:20 and used as a template in Power SYBR Master Mix (ABI4367659), and DNA was amplified using the ViiA-7 real-time PCR system. All primers anneal at 60 °C. Primer sequences were as follows: Acly-Fw, TTCGTCAAACAGCACTTCC; Acly-Rv, ATTTGGCTTCTTGGAGGTG; Glut4-Fw, GCCCGAAAGAGTCTAAAGC; Glut4-Rv, CTTCCGTTTCTCATCCTTCAG; FABP4-Fw, ACAAAATGTGTGATGCCTTTGTGGGAAC; FABP4-Rv, TCCGACTGACTATTGTAGTGTTTGATGCAA; PPARg2-Fw, TGGCATCTCTGTGTCAACCATG; PPARg2-Rv, GCATGGTGCCTTCGCTGA; AdipoQ-Fw, GCACTGGCAAGTTCTACTGCAA; AdipoQ-Rv, GTAGGTGAAGAGAACGGCCTTGT; 18S-Fw, AAATCAGTTATGGTTCCTTTGGTC; and 18S-Rv, GCTCTAGAATTACCACAGTTATCCAA.
Determination of Acyl-CoA Species
Internal Standard Generation
The 13C315N1-labeled acyl-CoA internal standard was generated by culturing pan6-deficient Saccharomyces cerevisiae with [13C315N1]pantothenate (Isosciences, King of Prussia, PA), as described previously (40). A 500-ml culture at stationary phase was resuspended in 100 ml of 10% (w/v) trichloroacetic acid (Sigma-Aldrich, catalog no. T6399). The cells were dismembranated in 10-ml aliquots by sonication (60 0.5-s pulses) with a probe tip sonicator (Thermo Scientific) and centrifuged at 3000 × g for 10 min at 4 °C. The cleared supernatant was stored at −80 °C.
Acyl-CoA Extraction
Frozen tissue samples were cut to ∼50 mg on a superchilled ceramic tile on dry ice. The weighed samples were added to 1 ml of thawed 13C315N1-labeled acyl-CoA internal standard in 1.5-ml Eppendorf tubes on ice. Samples were homogenized and dismembranated by 60 0.5-s pulses with a probe tip sonicator (Thermo Scientific) and centrifuged at 14,000 × g for 10 min at 4 °C. The supernatant was purified by solid-phase extraction using Oasis HLB 1-ml (30 mg) solid phase extraction columns (Waters, Milford, MA). Columns were washed with 1 ml of methanol, equilibrated with 1 ml of water, loaded with supernatant, desalted with 1 ml of water, and eluted with 1 ml of methanol containing 25 mm ammonium acetate. The purified extracts were evaporated to dryness under nitrogen and then resuspended in 55 μl of 5% (w/v) 5-sulfosalicylic acid in water.
Liquid Chromatography-Mass Spectrometry
Samples were analyzed by an Ultimate 3000 autosampler coupled to a Thermo Q Exactive Plus instrument in positive electrospray ionization mode in 10-μl injections using settings described previously (41). Analytes were separated before introduction to the mass spectrometer using a Waters HSS T3 column (2.1 × 100 mm, 3.5-μm particle size) with 5 mm ammonium acetate in water as solvent A, 5 mm ammonium acetate in acetonitrile/water (95:5, v/v) as solvent B, and acetonitrile/water/formic acid (80:20:0.1, v/v/v) as solvent C. Gradient conditions were as follows: 2% B for 1.5 min, increased to 25% over 3.5 min, increased to 100% B in 0.5 min and held for 8.5 min, and washed with 100% C for 5 min before equilibration for 5 min. The flow rate was 200 μl/min.
Mass spectrometer scan parameters were as follows: a heated electrospray ionization probe and heated capillary at 425 °C, in-source collision energy at 5 eV with sheath and aux gasses at 45 and 10 arbitrary units, alternating full scan from 760 to 1800 m/z at 140,000 resolution, and data-independent acquisition looped three times with all fragment ions multiplexed at a normalized collision energy of 20 at a resolution of 280,000. An isolation width of 7 m/z with an offset of 3 m/z was used to capture ms2 data for acyl-CoA thioesters. Each analyte and its corresponding 13C315N1-labeled internal standard was detected as parent [MH]+ and product [(M-506.99587)H]+ ions according to their predicted exact mass (M).
Data were processed in Xcalibur and TraceFinder (Thermo). Parent ion peaks for each acyl-CoA species and their corresponding 13C315N1-labeled internal standard were integrated to determine relative abundance between samples, whereas ms2 (product ion) data were used to confirm the identity of the parent ion.
Mass Spectrometry Analysis of Histone Acetylation
Fresh tissues were homogenized with TissueLyser (Qiagen), and histones were extracted using 0.4 n HCl. These samples were TCA-precipitated, acetone-washed, and prepared for mass spectrometry analysis as described previously (42). A Waters Acquity H-class ultra-performance liquid chromatography system coupled to a Thermo (Waltham, MA) TSQ Quantum Access triple-quadrupole (QqQ) mass spectrometer was used to quantify modified histones. Selected reaction monitoring was used to monitor the elution of the acetylated and propionylated tryptic peptides. Samples were analyzed as described previously (42). Each acetylated and/or propionylated peak was identified by retention time and specific transitions. The resulting peak integration was conducted using Xcalibur software (version 2.1, Thermo). The fraction of a specific peptide (Fp) is calculated as Fp = Is / (ΣIp), where Is the intensity of a specific peptide state and Ip is the intensity of any state of that peptide.
KAT Chemoproteomic Analysis
Chemoproteomic analysis of KAT activity was performed as described previously (26). Briefly, mouse liver proteomes were incubated with the indicated concentration of competitor for 30 min on ice, added to Lys-CoA-Sepharose resin, and rotated for 1 h at room temperature. Capture resin was subjected to mild washes, and enriched proteins were eluted with 1× SDS sample buffer at 95 °C prior to SDS-PAGE and Western blotting analysis. Relative enrichment calculations were performed using gel densitometry analysis normalized to “no competitor” control lanes.
PCAF Rate Experiments
In vitro experiments to determine how butyryl and isobutyryl-CoA affect PCAF-mediated histone acetylation were conducted under steady-state conditions in buffer containing 100 mm ammonium bicarbonate and 50 mm HEPES buffer (pH 7.8) at 37 °C. Experiments were performed utilizing excess H3/H4 (15 μm) in the presence of PCAF (100 nm), acetyl-CoA (100 μm), and varying concentrations of isobutyryl-CoA and butyryl-CoA (0, 5, 25, and 50 μm). A time course was performed to determine the rate (velocity/enzyme concentration (v/E)) of acetylation, normalized to enzyme concentration. Under steady-state conditions, (prior to 10% of H3/H4 being acetylated), PCAF only acetylated H3K14. Assays were quenched using four volumes of TCA and prepared for mass spectrometry analysis as described previously (43).
Author Contributions
A. C., J. L. D. P., and K. E. W. conceptualized and designed the project. A. C., J. L. D. P., and S. T. performed the mouse experiments and prepared the figures. A. C. performed the adipocyte in vitro experiments. S. T., N. W. S., and I. A. B. performed the acyl-CoA measurements. R. A. H., Y. M. K., and A. J. A. performed the histone acetylation analysis and PCAF kinetic assay. D. C. M. and J. L. M. conducted the chemoproteomic analysis. A. T. generated the Aclyfl/fl preadipocytes. J. M. V. performed the Oil Red O staining. A. C. and K. E. W. analyzed the data and wrote the manuscript with editorial input from all authors.
Acknowledgments
We thank Patrick Seale for technical advice regarding the generation of preadipocyte cell lines.
This work was supported by American Diabetes Association Grant 7-12-JF-59, NCI, National Institutes of Health Grant R01CA174761, by a Pancreatic Cancer Action Network-American Association for Cancer Research career development award (to K. E. W.), by the Abramson Cancer Center Basic Science Center for Excellence in Cancer Metabolism (to K. E. W. and I. A. B.), by National Institutes of Health Grants R21HD087866 and K22ES26235 (to N. W. S.), and by NCI, National Institutes of Health Grant ZIABC011488-04 (to J. L. M.). The authors declare that they have no conflicts of interest with the contents of this article. The content is solely the responsibility of the authors and does not necessarily represent the official views of the National Institutes of Health.
- KAT
- lysine acetyltransferase
- ACLY
- ATP citrate-lyase
- HFD
- high-fat diet
- WAT
- white adipose tissue
- H3K23ac
- histone H3 lysine 23 acetylation
- RC
- regular chow
- pgWAT
- perigonadal white adipose tissue
- SCAD
- short-chain acyl-CoA dehydrogenase
- hiFBS
- heat-inactivated FBS
- PCAF
- P300/CBP-associated factor
- DNL
- de novo lipogenesis
- ACSS2
- Acyl-CoA synthetase short-chain family member 2
- FASN
- fatty acid synthetase
- CBP
- CREB-binding protein
- CREB
- cAMP-response element-binding protein.
References
- 1. Finucane M. M., Stevens G. A., Cowan M. J., Danaei G., Lin J. K., Paciorek C. J., Singh G. M., Gutierrez H. R., Lu Y., Bahalim A. N., Farzadfar F., Riley L. M., Ezzati M., and Global Burden of Metabolic Risk Factors of Chronic Diseases Collaborating Group (Body Mass Index) (2011) National, regional, and global trends in body-mass index since 1980: systematic analysis of health examination surveys and epidemiological studies with 960 country-years and 9.1 million participants. Lancet 377, 557–567 [DOI] [PMC free article] [PubMed] [Google Scholar]
- 2. Stevens G. A., Singh G. M., Lu Y., Danaei G., Lin J. K., Finucane M. M., Bahalim A. N., McIntire R. K., Gutierrez H. R., Cowan M., Paciorek C. J., Farzadfar F., Riley L., Ezzati M., and Global Burden of Metabolic Risk Factors of Chronic Diseases Collaborating Group (Body Mass Index) (2012) National, regional, and global trends in adult overweight and obesity prevalences. Popul. Health Metr. 10, 22. [DOI] [PMC free article] [PubMed] [Google Scholar]
- 3. Ezzati M., and Riboli E. (2013) Behavioral and dietary risk factors for noncommunicable diseases. N. Engl. J. Med. 369, 954–964 [DOI] [PubMed] [Google Scholar]
- 4. Calle E. E., and Kaaks R. (2004) Overweight, obesity and cancer: epidemiological evidence and proposed mechanisms. Nat. Rev. Cancer 4, 579–591 [DOI] [PubMed] [Google Scholar]
- 5. Su X., Wellen K. E., and Rabinowitz J. D. (2016) Metabolic control of methylation and acetylation. Curr. Opin. Chem. Biol. 30, 52–60 [DOI] [PMC free article] [PubMed] [Google Scholar]
- 6. Carrer A., and Wellen K. E. (2015) Metabolism and epigenetics: a link cancer cells exploit. Curr. Opin. Biotechnol. 34, 23–29 [DOI] [PMC free article] [PubMed] [Google Scholar]
- 7. Etchegaray J. P., and Mostoslavsky R. (2016) Interplay between metabolism and epigenetics: a nuclear adaptation to environmental changes. Mol. Cell 62, 695–711 [DOI] [PMC free article] [PubMed] [Google Scholar]
- 8. Gut P., and Verdin E. (2013) The nexus of chromatin regulation and intermediary metabolism. Nature 502, 489–498 [DOI] [PubMed] [Google Scholar]
- 9. Meier J. L. (2013) Metabolic mechanisms of epigenetic regulation. ACS Chem. Biol. 8, 2607–2621 [DOI] [PMC free article] [PubMed] [Google Scholar]
- 10. Locasale J. W. (2013) Serine, glycine and one-carbon units: cancer metabolism in full circle. Nat. Rev. Cancer 13, 572–583 [DOI] [PMC free article] [PubMed] [Google Scholar]
- 11. Anderson O. S., Sant K. E., and Dolinoy D. C. (2012) Nutrition and epigenetics: an interplay of dietary methyl donors, one-carbon metabolism and DNA methylation. J. Nutr. Biochem. 23, 853–859 [DOI] [PMC free article] [PubMed] [Google Scholar]
- 12. Crider K. S., Yang T. P., Berry R. J., and Bailey L. B. (2012) Folate and DNA methylation: a review of molecular mechanisms and the evidence for folate's role. Adv. Nutr. 3, 21–38 [DOI] [PMC free article] [PubMed] [Google Scholar]
- 13. Mentch S. J., Mehrmohamadi M., Huang L., Liu X., Gupta D., Mattocks D., Gómez Padilla P., Ables G., Bamman M. M., Thalacker-Mercer A. E., Nichenametla S. N., and Locasale J. W. (2015) Histone methylation dynamics and gene regulation occur through the sensing of one-carbon metabolism. Cell Metab. 22, 861–873 [DOI] [PMC free article] [PubMed] [Google Scholar]
- 14. Shimazu T., Hirschey M. D., Newman J., He W., Shirakawa K., Le Moan N., Grueter C. A., Lim H., Saunders L. R., Stevens R. D., Newgard C. B., Farese R. V. Jr., de Cabo R., Ulrich S., Akassoglou K., and Verdin E. (2013) Suppression of oxidative stress by β-hydroxybutyrate, an endogenous histone deacetylase inhibitor. Science 339, 211–214 [DOI] [PMC free article] [PubMed] [Google Scholar]
- 15. Krautkramer K. A., Kreznar J. H., Romano K. A., Vivas E. I., Barrett-Wilt G. A., Rabaglia M. E., Keller M. P., Attie A. D., Rey F. E., and Denu J. M. (2016) Diet-microbiota interactions mediate global epigenetic programming in multiple host tissues. Mol. Cell 64, 982–992 [DOI] [PMC free article] [PubMed] [Google Scholar]
- 16. Waterborg J. H. (1998) Dynamics of histone acetylation in Chlamydomonas reinhardtii. J. Biol. Chem. 273, 27602–27609 [DOI] [PubMed] [Google Scholar]
- 17. Evertts A. G., Zee B. M., Dimaggio P. A., Gonzales-Cope M., Coller H. A., and Garcia B. A. (2013) Quantitative dynamics of the link between cellular metabolism and histone acetylation. J. Biol. Chem. 288, 12142–12151 [DOI] [PMC free article] [PubMed] [Google Scholar]
- 18. Takahashi H., McCaffery J. M., Irizarry R. A., and Boeke J. D. (2006) Nucleocytosolic acetyl-coenzyme a synthetase is required for histone acetylation and global transcription. Mol. Cell 23, 207–217 [DOI] [PubMed] [Google Scholar]
- 19. Wellen K. E., Hatzivassiliou G., Sachdeva U. M., Bui T. V., Cross J. R., and Thompson C. B. (2009) ATP-citrate lyase links cellular metabolism to histone acetylation. Science 324, 1076–1080 [DOI] [PMC free article] [PubMed] [Google Scholar]
- 20. Cai L., Sutter B. M., Li B., and Tu B. P. (2011) Acetyl-CoA induces cell growth and proliferation by promoting the acetylation of histones at growth genes. Mol. Cell 42, 426–437 [DOI] [PMC free article] [PubMed] [Google Scholar]
- 21. Lee J. V., Carrer A., Shah S., Snyder N. W., Wei S., Venneti S., Worth A. J., Yuan Z. F., Lim H. W., Liu S., Jackson E., Aiello N. M., Haas N. B., Rebbeck T. R., Judkins A., et al. (2014) Akt-dependent metabolic reprogramming regulates tumor cell histone acetylation. Cell Metab. 20, 306–319 [DOI] [PMC free article] [PubMed] [Google Scholar]
- 22. Cluntun A. A., Huang H., Dai L., Liu X., Zhao Y., and Locasale J. W. (2015) The rate of glycolysis quantitatively mediates specific histone acetylation sites. Cancer Metab. 3, 10. [DOI] [PMC free article] [PubMed] [Google Scholar]
- 23. Peleg S., Feller C., Forne I., Schiller E., Sévin D. C., Schauer T., Regnard C., Straub T., Prestel M., Klima C., Schmitt Nogueira M., Becker L., Klopstock T., Sauer U., Becker P. B., et al. (2016) Life span extension by targeting a link between metabolism and histone acetylation in Drosophila. EMBO Rep. 17, 455–469 [DOI] [PMC free article] [PubMed] [Google Scholar]
- 24. Montgomery D. C., Sorum A. W., Guasch L., Nicklaus M. C., and Meier J. L. (2015) Metabolic regulation of histone acetyltransferases by endogenous acyl-CoA cofactors. Chem. Biol. 22, 1030–1039 [DOI] [PMC free article] [PubMed] [Google Scholar]
- 25. Albaugh B. N., Arnold K. M., and Denu J. M. (2011) KAT(ching) metabolism by the tail: insight into the links between lysine acetyltransferases and metabolism. ChemBioChem 12, 290–298 [DOI] [PMC free article] [PubMed] [Google Scholar]
- 26. Montgomery D. C., Garlick J. M., Kulkarni R. A., Kennedy S., Allali-Hassani A., Kuo Y. M., Andrews A. J., Wu H., Vedadi M., and Meier J. L. (2016) Global profiling of acetyltransferase feedback regulation. J. Am. Chem. Soc. 138, 6388–6391 [DOI] [PMC free article] [PubMed] [Google Scholar]
- 27. Covarrubias A. J., Aksoylar H. I., Yu J., Snyder N. W., Worth A. J., Iyer S. S., Wang J., Ben-Sahra I., Byles V., Polynne-Stapornkul T., Espinosa E. C., Lamming D., Manning B. D., Zhang Y., Blair I. A., and Horng T. (2016) Akt-mTORC1 signaling regulates Acly to integrate metabolic input to control of macrophage activation. eLife 5, e11612. [DOI] [PMC free article] [PubMed] [Google Scholar]
- 28. Donohoe D. R., Collins L. B., Wali A., Bigler R., Sun W., and Bultman S. J. (2012) The Warburg effect dictates the mechanism of butyrate-mediated histone acetylation and cell proliferation. Mol. Cell 48, 612–626 [DOI] [PMC free article] [PubMed] [Google Scholar]
- 29. Peng M., Yin N., Chhangawala S., Xu K., Leslie C. S., and Li M. O. (2016) Aerobic glycolysis promotes T helper 1 cell differentiation through an epigenetic mechanism. Science 354, 481–484 [DOI] [PMC free article] [PubMed] [Google Scholar]
- 30. Zhao S., Torres A., Henry R. A., Trefely S., Wallace M., Lee J. V., Carrer A., Sengupta A., Campbell S. L., Kuo Y. M., Frey A. J., Meurs N., Viola J. M., Blair I. A., Weljie A. M., et al. (2016) ATP-citrate lyase controls a glucose-to-acetate metabolic switch. Cell Rep. 17, 1037–1052 [DOI] [PMC free article] [PubMed] [Google Scholar]
- 31. Jiang L., Wang Q., Yu Y., Zhao F., Huang P., Zeng R., Qi R. Z., Li W., and Liu Y. (2009) Leptin contributes to the adaptive responses of mice to high-fat diet intake through suppressing the lipogenic pathway. PLoS ONE 4, e6884. [DOI] [PMC free article] [PubMed] [Google Scholar]
- 32. Fukuda H., Katsurada A., and Iritani N. (1992) Effects of nutrients and hormones on gene expression of ATP citrate-lyase in rat liver. Eur. J. Biochem. 209, 217–222 [DOI] [PubMed] [Google Scholar]
- 33. Herman M. A., Peroni O. D., Villoria J., Schön M. R., Abumrad N. A., Blüher M., Klein S., and Kahn B. B. (2012) A novel ChREBP isoform in adipose tissue regulates systemic glucose metabolism. Nature 484, 333–338 [DOI] [PMC free article] [PubMed] [Google Scholar]
- 34. Shimano H., Yahagi N., Amemiya-Kudo M., Hasty A. H., Osuga J., Tamura Y., Shionoiri F., Iizuka Y., Ohashi K., Harada K., Gotoda T., Ishibashi S., and Yamada N. (1999) Sterol regulatory element-binding protein-1 as a key transcription factor for nutritional induction of lipogenic enzyme genes. J. Biol. Chem. 274, 35832–35839 [DOI] [PubMed] [Google Scholar]
- 35. Liu X., Sadhukhan S., Sun S., Wagner G. R., Hirschey M. D., Qi L., Lin H., and Locasale J. W. (2015) High resolution metabolomics with acyl-CoA profiling reveals widespread remodeling in response to diet. Mol. Cell Proteomics 14, 1489–1500 [DOI] [PMC free article] [PubMed] [Google Scholar]
- 36. Jin Q., Yu L. R., Wang L., Zhang Z., Kasper L. H., Lee J. E., Wang C., Brindle P. K., Dent S. Y., and Ge K. (2011) Distinct roles of GCN5/PCAF-mediated H3K9ac and CBP/p300-mediated H3K18/27ac in nuclear receptor transactivation. EMBO J. 30, 249–262 [DOI] [PMC free article] [PubMed] [Google Scholar]
- 37. Chen W. W., Freinkman E., Wang T., Birsoy K., and Sabatini D. M. (2016) Absolute quantification of matrix metabolites reveals the dynamics of mitochondrial metabolism. Cell 166, 1324–1337.e11 [DOI] [PMC free article] [PubMed] [Google Scholar]
- 38. Sabari B. R., Tang Z., Huang H., Yong-Gonzalez V., Molina H., Kong H. E., Dai L., Shimada M., Cross J. R., Zhao Y., Roeder R. G., and Allis C. D. (2015) Intracellular crotonyl-CoA stimulates transcription through p300-catalyzed histone crotonylation. Mol. Cell 58, 203–215 [DOI] [PMC free article] [PubMed] [Google Scholar]
- 39. Palladino A. A., Chen J., Kallish S., Stanley C. A., and Bennett M. J. (2012) Measurement of tissue acyl-CoAs using flow-injection tandem mass spectrometry: acyl-CoA profiles in short-chain fatty acid oxidation defects. Mol. Genet. Metab 107, 679–683 [DOI] [PMC free article] [PubMed] [Google Scholar]
- 40. Snyder N. W., Tombline G., Worth A. J., Parry R. C., Silvers J. A., Gillespie K. P., Basu S. S., Millen J., Goldfarb D. S., and Blair I. A. (2015) Production of stable isotope-labeled acyl-coenzyme A thioesters by yeast stable isotope labeling by essential nutrients in cell culture. Anal. Biochem. 474, 59–65 [DOI] [PMC free article] [PubMed] [Google Scholar]
- 41. Frey A. J., Feldman D. R., Trefely S., Worth A. J., Basu S. S., and Snyder N. W. (2016) LC-quadrupole/Orbitrap high-resolution mass spectrometry enables stable isotope-resolved simultaneous quantification and 13C-isotopic labeling of acyl-coenzyme A thioesters. Anal. Bioanal. Chem. 408, 3651–3658 [DOI] [PMC free article] [PubMed] [Google Scholar]
- 42. Kuo Y. M., Henry R. A., and Andrews A. J. (2014) A quantitative multiplexed mass spectrometry assay for studying the kinetic of residue-specific histone acetylation. Methods 70, 127–133 [DOI] [PMC free article] [PubMed] [Google Scholar]
- 43. Henry R. A., Kuo Y. M., and Andrews A. J. (2013) Differences in specificity and selectivity between CBP and p300 acetylation of histone H3 and H3/H4. Biochemistry 52, 5746–5759 [DOI] [PMC free article] [PubMed] [Google Scholar]