

Abstract
Maintenance of glucose homeostasis is essential for normal physiology. Deviation from normal glucose levels, in either direction, increases susceptibility to serious medical complications such as hypoglycemia and diabetes. Maintenance of glucose homeostasis is achieved via functional interactions among various organs: liver, skeletal muscle, adipose tissue, brain, and the endocrine pancreas. The liver is the primary site of endogenous glucose production, especially during states of prolonged fasting. However, enhanced gluconeogenesis is also a signature feature of type 2 diabetes (T2D). Thus, elucidating the signaling pathways that regulate hepatic gluconeogenesis would allow better insight into the process of normal endogenous glucose production as well as how this process is impaired in T2D. Here we demonstrate that the TGF-β1/Smad3 signaling pathway promotes hepatic gluconeogenesis, both upon prolonged fasting and during T2D. In contrast, genetic and pharmacological inhibition of TGF-β1/Smad3 signals suppressed endogenous glucose production. TGF-β1 and Smad3 signals achieved this effect via the targeting of key regulators of hepatic gluconeogenesis, protein phosphatase 2A (PP2A), AMP-activated protein kinase (AMPK), and FoxO1 proteins. Specifically, TGF-β1 signaling suppressed the LKB1-AMPK axis, thereby facilitating the nuclear translocation of FoxO1 and activation of key gluconeogenic genes, glucose-6-phosphatase and phosphoenolpyruvate carboxykinase. These findings underscore an important role of TGF-β1/Smad3 signaling in hepatic gluconeogenesis, both in normal physiology and in the pathophysiology of metabolic diseases such as diabetes, and are thus of significant medical relevance.
Keywords: AMP-activated kinase (AMPK), diabetes, FOXO, gluconeogenesis, liver, obesity, phosphoprotein phosphatase, SMAD transcription factor, transforming growth factor β (TGF-β)
Introduction
Glucose homeostasis is achieved via the integration of physiological processes occurring in multiple organs. Glycolysis and gluconeogenesis represent two competing processes that regulate blood glucose levels (1). Hepatic gluconeogenesis is a critical mechanism for endogenous glucose production during periods of prolonged fasting. However, deregulated hepatic gluconeogenesis is a common feature in patients with type 2 diabetes (T2D)2 (2). Expression of phosphoenolpyruvate carboxykinase (PEPCK) and glucose-6-phosphatases (G6Pase) (3), key rate-limiting enzymes for hepatic gluconeogenesis, increases abnormally in T2D (4). Likewise, the transgenic overexpression of these enzymes in mice results in hyperglycemia, hyperinsulinemia, and insulin resistance (5, 6). In contrast, deletion of PEPCK reverses hyperglycemia and insulin resistance in diabetes-prone db/db mice (7).
The AMP-activated protein kinase (AMPK) signaling pathway, among others, regulates the expression of PEPCK and G6Pase (8). AMPK is a heterotrimeric protein, consisting of α1/2, β1/2, and γ1/2/3 subunits, that regulates glucose and fatty acid metabolism (9). Phosphorylation of Thr-172 in the α1 subunit is important for AMPK activation, which is in turn regulated by two upstream kinases, LKB1 and Ca2+ calmodulin-dependent protein kinases α and β (10, 11). Further, AMPK is a serine/threonine kinase, and activation of hepatic AMPK suppresses gluconeogenesis via substrate phosphorylation (12). The commonly prescribed antidiabetic drug metformin and 5-aminoimidazole-4-carboxamide ribonucleotide (AICAR) both activate AMPK via LKB1-dependent mechanisms to suppress hepatic gluconeogenesis (13). In addition, AMPK suppresses gluconeogenesis via down-regulation of Forkhead box protein O1 (FoxO1) target genes (14) through increasing FoxO1 phosphorylation (15). FoxO1 promotes hepatic gluconeogenesis via transcriptional activation of PEPCK and G6Pase (16, 17).
The TGF-β signaling pathway regulates biological processes including cell proliferation, differentiation, and death (18). Canonical TGF-β signaling involves ligand binding to TGF-β receptor II (TβRII), which promotes phosphorylation and activation of TGF-β receptor I (TβRI), which in turn phosphorylates and activates the downstream Smad transcription factors. Smad3 is the preferred downstream transcription factor for TGF-β isoforms. Once activated Smad3 complexes with Smad4 and translocates to the nucleus to bind target promoters. In addition to the SMAD pathway, TGF-β signaling is known to interact with non-SMAD-signaling nodes (19). For example, TGF-β signaling interacts with insulin receptor signaling in the nematode Caenorhabditis elegans. TGF-β/daf-7 activates the TGF-receptor I and II kinases (daf-1 and daf-4) and the Smad transcription factor (daf-8 and daf-14) network and interacts with FoxO1 (daf-16), LKB1 (par-4), and AMPK (aak-1/aak-2) to regulate metabolic and nutrient sensory pathways and glucose metabolism (20) (21). Along those lines, we have illustrated the key role of TGF-β signaling in regulating the function of diverse cell types tasked with maintenance of glucose homeostasis (22–24).
Here, we investigated the role of TGF-β1 signaling in regulating hepatic gluconeogenesis, in normal physiology, and during the pathogenesis of metabolic disease. We found that TGF-β1/Smad3 promotes hepatic gluconeogenesis via targeting the PP2A-AMPK-FoxO1 pathways during fasting/feeding and during pathologic conditions like insulin resistance and diabetes.
Results
TGF-β1/Smad3 Signaling Is Associated with Physiologically Normal Gluconeogenesis
To evaluate the role of TGF-β in glucose production, we developed a cell culture system using HepG2 cells, which are human non-tumorigenic cells that harbor an intact TGF-β1 response (25). Prolonged glucose deprivation of HepG2 cells resulted in a significantly increased secretion of TGF-β1 in the media after 12 and 24 h (Fig. 1a), concomitant with increased glucose production (Fig. 1b). Glucose deprivation was followed by a marked increase in PEPCK and G6Pase mRNA (Fig. 1c). TGF-β1/Smad3-signaling target genes, i.e. Serpine1, Smad7, and Mmp1, were increased (Fig. 1d) suggesting that glucose deprivation enhanced TGF-β1 signals.
FIGURE 1.

Increased TGF-β1/Smad3 signaling is associated with normal and deregulated hepatic gluconeogenesis. a and b, levels of TGF-β1 secretion (a) and glucose production (b) in media from HepG2 cells (in triplicate) at indicated time points post-glucose deprivation. c and d, mRNA expression of gluconeogenic genes (c) and TGF-β1/Smad3-signaling target genes (d) during the glucose-deprived state of HepG2 cells (in triplicate). e, Western blotting analysis of p-Smad3, total Smad3, G6Pase, and PEPCK along with levels of tubulin in liver from mice that were fed ad libitum, fasted, or refed after a fasting period (pooled samples from n = 5 mice/group). f and g, mRNA expression of gluconeogenic genes (f) and TGF-β1/Smad3 signaling target genes (g) in ad libitum-fed, fasted, and refed mice liver (n = 5 in each group). h, TGF-β1 levels in liver tissue homogenate of normal chow-fed, DIO, and leptin-deficient (Lepob/ob) mice (n = 6/group). i, Western blotting analyses of p-Smad3, total Smad3, p-Akt, total Akt, G6Pase, and PEPCK along with internal control (tubulin) in liver homogenates of normal, DIO, and Lepob/ob mice. j, mRNA expression of TGF-β1/Smad3 signaling target genes in normal, DIO, and Lepob/ob mice livers (n = 6/group). All the values present here are averages, and error bars represent S.E. *, p = <0.05; **, p = <0.01; and ***, p = <0.001.
To investigate the plausible role of TGF-β1/Smad3 signaling in fasting-induced hepatic gluconeogenesis in vivo, we examined the livers of normal wild type mice subjected to a prolonged fasting (22–24 h) and refeeding regimen. Prolonged fasting resulted in a significant increase in phospho-Smad3 (p-Smad3), whereas refeeding reversed the elevated p-Smad3 levels (Fig. 1e). These changes in Smad3 phosphorylation were not associated with changes in total Smad3 protein levels. The protein and mRNA expression levels of PEPCK and G6Pase (Fig. 1, e and f) trended similar to those of p-Smad3, suggesting that TGF-β1/Smad3 activation is associated with changes in gluconeogenic gene expression. As expected, TGF-β1/Smad3 target genes were increased (Serpine1 and Smad7) or decreased (c-Myc) in fasted livers (Fig. 1g).
Increased TGF-β/Smad3 Signaling Is Associated with Impaired Gluconeogenesis
Compared with that observed in normal mice, the levels of TGF-β1 and p-Smad3 were substantially increased in liver homogenate of diet-induced obese (DIO) and Lepob/ob mice, which are two mouse models of obesity and diabetes (Fig. 1, h and i). Phospho-Akt (p-Akt) levels were significantly decreased in DIO and Lepob/ob liver suggestive of insulin resistance in these models, and those p-AKT levels were negatively correlated with increased p-Smad3 levels (Fig. 1i). DIO and Lepob/ob livers showed elevated expression of PEPCK and G6Pase (data not shown) as well as TGF-β1/Smad3 target genes (Serpine1, Smad7, Mmp1, and p21) (Fig. 1j).
Intraperitoneal injection of TGF-β1 ligand in normal wild type mice led to a significant increase in mRNA and protein levels of PEPCK and G6Pase in the liver of TGF-β1-injected mice (Fig. 2, a and b). Similarly, tail vein injection of adenoviruses containing constitutively activate Smad3 (AdS3) resulted in an impaired pyruvate tolerance test (PTT) along with increased expression of PEPCK and G6Pase genes (Fig. 2, c and d). Taken together, these results further demonstrate that activation of TGF-β1/Smad3 signaling leads to impaired hepatic gluconeogenesis.
FIGURE 2.
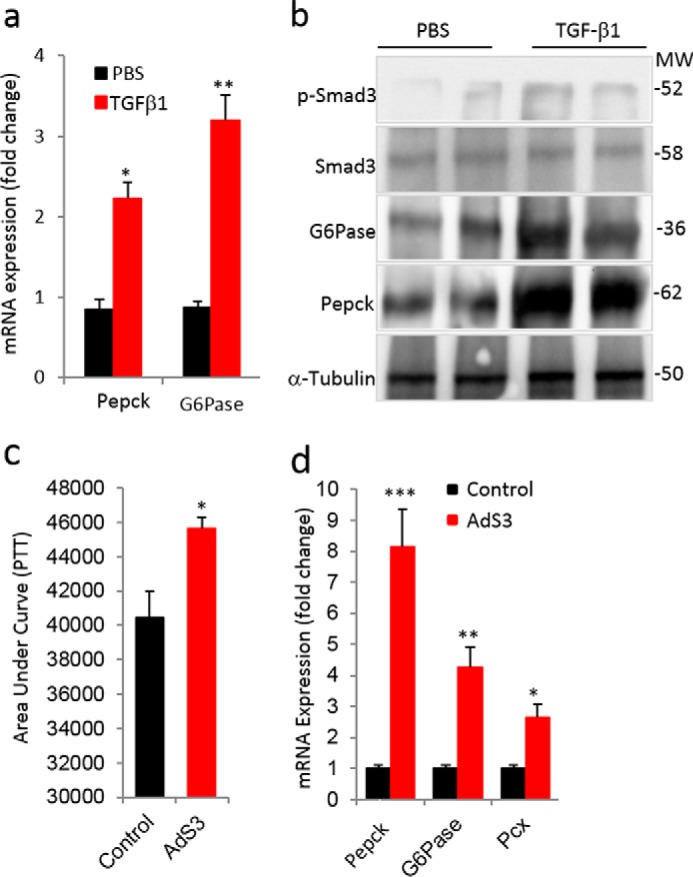
Activation of TGF-β1/Smad3 signaling deregulates hepatic gluconeogenesis. a and b, mRNA expression of PEPCK and G6Pase (a) and Western blotting analyses of p-Smad3, total Smad3, G6Pase, and PEPCK proteins (b) in liver tissues of mice injected with TGF-β1 ligand compared with vehicle (PBS)-injected mice (n = 6/group, 6 consecutive days of injections). c, area under the curve during a PTT performed in mice after 1 week of tail vein injection of adenoviruses harboring constitutively active Smad3 (AdS3) and control adenoviral particles (Control). d, mRNA expression of PEPCK, G6Pase, and pyruvate carboxylase (Pcx) in liver tissues from control and AdS3 mice (n = 6/group). All values present here are averages, and error bars represent S.E. *, p = <0.05; **, p = <0.01; and ***, p = <0.001.
Blockade of TGF-β1/Smad3 Signaling Suppressed Gluconeogenesis in Mice
We next evaluated the effects of blocking TGF-β1/Smad3 signaling on hepatic gluconeogenesis, using two strategies: 1) anti-TGF-β1 antibody administration in Lepob/ob and DIO mice and 2) germ line Smad3 deletion in mice (22). We have shown previously 1) the beneficial metabolic effects of the TGF-β neutralization antibody (1D11) using Lepob/ob and DIO mice and 2) the protection of whole-body Smad3−/− mice from high fat diet-induced diabetes (22). Systemic administration of anti-TGFβ1 antibody to Lepob/ob and DIO mice for 8–12 weeks resulted in a significantly improved PTT (Fig. 3, a, b, d, and e) and reduced mRNA expression levels of gluconeogenic markers in the liver (Fig. 3, c and f). A similar improvement in the PTT (Fig. 4, a and b), with associated decreases in fasting blood glucose levels (Fig. 4c), was seen in the Smad3−/− knock-out (KO) mice fed NC and HFD. Furthermore, mRNA and protein expression levels of PEPCK and G6Pase were markedly lower in Smad3−/− liver (Fig. 4, d and e). These results demonstrate that blockade of TGF-β1/Smad3 signaling significantly protected mice from high fat diet-induced impairment in hepatic gluconeogenesis. Consistent with improved insulin sensitivity, a marked increase in insulin-signaling mediators in the livers of Smad3−/− mice fed with either NC or HFD was observed (Fig. 4, f and g).
FIGURE 3.

Blockade of TGF-β1 signaling suppresses hepatic gluconeogenesis in diabetic mice. Shown are pyruvate tolerance tests (a and d)), area under the curve (AUC) of PTT (b and e), and mRNA expression of gluconeogenic genes in liver tissues (c and f) of anti-TGF-β1 antibody-treated Lepob/ob (a–c) and DIO (d–f) mice (n = 6/group). All values presented here are averages, and error bars represent S.E. *, p = <0.05.
FIGURE 4.

Smad3 deficiency suppresses hepatic gluconeogenesis and enhances hepatic insulin sensitivity. Shown are pyruvate tolerance tests (a), area under the curve (AUC) of PTT (b), fasting glucose levels (c), expression of gluconeogenic genes in liver tissues (d) of global Smad3 KO (n = 5) and WT (n = 8) mice fed with NC and HFD. e, Western blotting analysis of PEPCK and G6Pase in livers of HFD-fed WT and KO mice. f and g, insulin signaling mediators, i.e. p-Akt, total Akt, p-ERK1/2, total ERK1/2, p-IRS1, and total-IRS1, along with tubulin as an internal control in liver tissues of NC-fed (f) and HFD-fed (g) Smad3 WT and KO mice. Western blotting analyses were performed using pooled lysates (n = 5 mice/group). All values present here are averages, and error bars represent S.E. *, p = 0.05; and **, p = <0.01.
Liver-specific Inhibition of TGF-β1/Smad3 Signaling Suppressed Hepatic Gluconeogenesis
To further evaluate the liver-specific role of TGF-β/Smad3, we developed liver-specific Smad3 and TβRI conditional knock-out mice by breeding Smad3flox/flox and TβRIflox/flox mice with albumin-ERT2-Cre mice that allow tamoxifen-dependent excision of Smad3 and TβR1 in albumin promoter-expressing liver cells. Albumin-Cre transgenic mice have been used extensively for liver-specific targeting of genes (27, 28). Smad3flox/flox:albCre+ and TβRIflox/flox:albCre+ mice showed a marked improvement in PTT and glucagon tolerance tests (Fig. 5, a–d). Furthermore, mRNA and protein expression of PEPCK and G6Pase in hepatic tissues of prolonged fasted (24 h) Smad3flox/flox:albCre+ and TβRIflox/flox:albCre+ mice were significantly decreased (Fig. 5, e–g). These results further demonstrate the crucial role of TGF-β1/Smad3 signaling in hepatic endogenous glucose production and strongly suggest a protective effect of liver-specific ablation of TGF-β1/Smad3 signals from deregulated gluconeogenesis.
FIGURE 5.

Liver-specific deletion of TβRI/Smad3 improved hepatic gluconeogenesis. Shown are pyruvate tolerance tests (a and c) and glucagon tolerance tests (b and d) upon liver-specific deletion of Smad3 (a and b) and TβRI (c and d) (n = 6 mice/group). e, confirmation of Smad3 and TβRI deletion using anti-Smad3, anti-TβRI, and anti-Cre antibody, respectively, via Western blotting along with expression levels of G6Pase and PEPCK proteins. f and g, liver mRNA expression of PEPCK (f) and G6Pase (g) in liver-specific Smad3 and TβRI knock-out mice. All values present here are averages, and error bars represent S.E. *. p = <0.05; and **, p = <0.01. FC, fold change.
TGF-β1/Smad3 Signaling Impairs Gluconeogenesis via Targeting the LKB1-AMPK-FoxO1 Pathway
Treatment of HepG2 cells with TGF-β1 resulted in a significant increase in glucose production (Fig. 6a). In contrast, inhibition of TGF-β1/Smad3 signaling via stable expression of a short hairpin RNA against Smad3 (ShSmad3), which knocks down Smad3 protein expression, in HepG2 cells resulted in significant suppression of TGF-β1-stimulated glucose production (Fig. 6b). In agreement, the mRNA and protein levels of PEPCK and G6Pase were significantly increased in TGF-β1-treated cells, whereas those levels were suppressed in shSmad3-HepG2 cells or in cells exposed to a small molecule TGF-β receptor 1 antagonist (SB431542) (Fig. 6, c–f).
FIGURE 6.

TGF-β1/Smad3 signaling targets the LKB1-AMPK-FoxO1 pathway. a, glucose production in media after 12 h of TGF-β1 (5 ng/ml) and TGF-β receptor I inhibitor (SB431542, 10 μm) treatment of HepG2 cells (two separate experiments in triplicate). b, glucose production in media after TGF-β1 treatment of HepG2 cells stably expressing control shRNA or shRNA targeting Smad3 (ShS3) (in triplicate). c and d, gluconeogenic gene expression in HepG2 cells after TGF-β1 and SB431542 treatments (c) and in control and ShS3 cells with and without TGF-β1 treatments (d) (in triplicate). e, Western blotting analysis of PP2A, LKB1, AMPK, and FoxO1 proteins along with gluconeogenic proteins in normal HepG2 cells with TGF-β1 and/or SB431542 treatments (in triplicate). f, Western blotting analysis of TGFβ1, LKB1, AMPK, and FoxO1 pathway proteins along with gluconeogenic genes in control and ShS3 cells with and without TGF-β1 treatments (in triplicate). Tubulin has been used as an internal control. All values present here are averages, and error bars represent S.E. *, p = <0.05; and **, p = <0.01.
LKB1-AMPK signaling suppresses hepatic gluconeogenesis by phosphorylation of various downstream molecules including FoxO1 (29). We observed that LKB1 and AMPK activity was significantly decreased (as indicated by reduced phosphorylation of LKB1 and AMPK isoforms) upon TGF-β1 treatment in fasted HepG2 cells (Fig. 6, e and f). In contrast, TGF-β1/Smad3 signal inhibition using SB431542 or shRNA-mediated knockdown of Smad3 led to increased levels of phosphorylated LKB1-AMPK proteins (Fig. 6, e and f), indicating that TGF-β1 signaling reduces the active forms of LKB1-AMPK proteins. Further, TGF-β1 treatment significantly decreased inactive phospho-FoxO1 (p-FoxO1), whereas TβRI inhibitor (SB431542) treatment and shSmad3 maintained higher levels of inactive p-FoxO1 (Fig. 6, e and f). These effects correlated with the expected changes in the mRNA and protein levels of G6Pase and PEPCK (Fig. 6, e and f). Key elements of the data were confirmed in AML12 immortalized mouse hepatocyte cells (Fig. 7). Thus, we observed (i) elevated glucose levels upon an extended period of glucose deprivation, (ii) increased levels of TGF-β1 ligand in the culture medium concomitant with elevation of glucose, (iii) exogenous supplementation of TGF-β1 ligand further promoting PEPCK and G6Pase gene expression, and (iv) increased protein expression of PEPCK and G6Pase enzymes correlated with elevated phosphorylation of Smad3 and active FoxO1. Treatment with SB431542 reversed these effects. Taken together, these results demonstrate that TGF-β1/Smad3 promotes glucose production in hepatocytes via dephosphorylation of LKB/AMPK/FoxO1 proteins followed by activation of the gluconeogenic gene program. In contrast, inhibition of TGF-β1/Smad3 signals maintains the phosphorylated forms of LKB/AMPK/FoxO1 that preclude activation of gluconeogenesis genes.
FIGURE 7.

Increased TGF-β1 signaling is associated with glucose production in AML12 cells. a and b, glucose production (a) and TGF-β1 levels in media (b) from AML12 cells (in triplicates) after 0 and 18 h of glucose deprivation. c, mRNA expression of gluconeogenic genes in AML12 cells after treatment with TGF-β1 and SB431542. d, Western blotting analysis of total and phosphorylated forms of Smad3 and FoxO1 proteins along with levels of gluconeogenic enzymes, PEPCK and G6Pase, in AML12 cells upon treatment with TGF-β1 and SB431542 (in triplicate). Tubulin serves as an internal control. All values present here are averages, and error bars represent S.E. **, p = <0.01; ***, p = < 0.001.
TGF-β1 Induces PP2A Activity to Dephosphorylate LKB1-AMPK-FoxO1
We hypothesized that TGF-β1 activation might be associated with increased phosphatase activity resulting in dephosphorylation of the LKB1-AMPK-FoxO1 proteins. PP2A is known to bind activated TβRI and dephosphorylate downstream signaling proteins (5), and thus we investigated the involvement of PP2A in our model. No appreciable changes in the protein levels of PP2A isoforms were seen in treated versus non-treated cells, and PP2Aα expression was undetectable in HepG2 cells (Fig. 6e). Interestingly, PP2A enzyme activity was significantly increased in TGF-β1-treated cell lysates (Fig. 8, a and b). In contrast, SB431542 treatment eliminated the TGF-β-induced PP2A activity (Fig. 8a). Further, shS3-HepG2 cells exhibited reduced PP2A enzyme activity, and TGF-β1 treatment was unable to increase PP2A activity (Fig. 8b), consistent with a requirement for Smad3 in the effect of TGF-β1 on increasing PP2A enzyme activity. Overall, these observations suggested that TGF-β1 induces PP2A enzyme activity and in turn causes the dephosphorylation of LKB1-AMPK-FoxO1 proteins.
FIGURE 8.

TGF-β1/Smad3 targets PP2A-AMPK-FoxO1 signaling. a and b, PP2A enzyme activity in TGF-β1- and SB431543-treated HepG2 cells (a) and in HepG2 cells treated with TGF-β1 with or without ShS3 (two independent experiments performed in triplicate) (b). c, effect of PP2A inhibitor OKA on Smad3-LKB1-AMPK-FoxO1 proteins with and without TGF-β1 and SB431542 treatments in HepG2 cells. d and e, PP2A enzyme activity (d) and mRNA expression of gluconeogenic genes (e) in HepG2 cells upon treatment with TGF-β1 and SB431542 with or without OKA (in triplicate). All values present here are averages, and error bars represent S.E. *, p = 0.05; **, p = <0.01.
To further examine whether PP2A is required for TGF-β1 to promote gluconeogenesis, we inhibited PP2A enzyme activity using okadaic acid (OKA) (Fig. 8, c–e). TGF-β1-induced dephosphorylation of LKB1-AMPK-FoxO1 was significantly abolished by OKA treatment, whereas SB431542 showed effects that synergized with the OKA treatment, as evident by the increased levels of phosphorylated LKB1-AMPK-FoxO1 proteins (Fig. 8c). Moreover, the mRNA and protein expression levels of gluconeogenic genes were consistent with the above observations (Fig. 8, c and e). Taken together, these data show that TGF-β1 activation induces PP2A activity, which in turn results in the dephosphorylation of LKB1-AMPK-FoxO1 proteins followed by enhanced gluconeogenesis-related gene expression.
TGF-β Induces Cytoplasmic PP2A-FoxO1 and Nuclear Smad3-FoxO1 Interactions
FoxO1 binds the promoter regions of gluconeogenic genes (PEPCK and G6Pase); this binding is associated with increased expression of these enzymes, leading to elevated endogenous glucose production (30). AMPK-mediated phosphorylation inactivates FoxO1 (31), presumably by precluding its nuclear translocation or promoting its retention in the cytoplasm. Cytoplasmic phospho-FoxO1 levels were markedly decreased in TGF-β1-stimulated cells (Fig. 9a). Total FoxO1 levels were decreased in the cytoplasmic fraction, whereas the accumulation of FoxO1 was seen in the nuclear fraction of TGF-β1-treated cells, albeit both were at moderate levels (Fig. 9a). Based on these data, we infer that TGF-β1 promoted the dephosphorylation and activation of FoxO1 followed by FoxO1 nuclear translocation.
FIGURE 9.

PP2A-FoxO1-Smad3 complex formation. a, Western blotting analysis of Smad3-AMPKα-FoxO1 proteins in cytoplasmic and nuclear fractions of HepG2 cells with and without TGF-β1 treatments. b, co-immunoprecipitation assay using anti-FoxO1 as the primary immunoprecipitation antibody (IP) and cytoplasmic and nuclear fractions of HepG2 cells treated with TGF-β1 ligand and SB431542 followed by Western blotting (WB) analyses of p-Smad3, total Smad3, and PP2A (a representative blot from two independent experiments). Anti-tubulin and anti-histone H3 antibodies were used as the internal control for the cytoplasmic and nuclear fractions, respectively.
Interactions between AMPK and PP2A have been described elsewhere (32). We next investigated the protein-protein interactions among Smad3, PP2A, and FoxO1 proteins using co-immunoprecipitation assays. To this end, we utilized an anti-FoxO1 antibody to immunoprecipitate FoxO1 protein localized in the cytoplasmic and nuclear fractions of HepG2 cells treated with or without TGF-β1 and SB431542. Western blotting was then performed on the FoxO1 immunoprecipitates to detect the presence of FoxO1-associated proteins. PP2A association with FoxO1 was higher in the cytoplasmic fractions of control cells, and TGF-β1 stimulation further accentuated the levels of PP2A-FoxO1 interaction (Fig. 9b). Treatment with SB431542 effectively suppressed this association. These findings revealed evidence of TGF-β1-induced PP2A-FoxO1 complex formation in the cytoplasm. Additionally, we observed abundant levels of Smad3 and p-Smad3 in the nuclear fraction of FoxO1 immunoprecipitation samples (Fig. 9b), which is indicative of FoxO1-Smad3 complex formation, preferentially in the nucleus of TGF-β1-stimulated cells. Again, this FoxO1-Smad3 association was effectively neutralized by SB431542 treatment. Together, these results are consistent with a key role of TGF-β1 in promoting complex formation between (i) PP2A-FoxO1 in the cytoplasm and (ii) Smad3-FoxO1 in the nucleus, presumably to enhance expression of gluconeogenic target genes.
Discussion
Hepatic gluconeogenesis is required to maintain euglycemia during periods of prolonged fasting (33). However, elevated hepatic gluconeogenesis is also a hallmark of type 2 diabetes and a primary contributing factor to fasting hyperglycemia (2). A better understanding of cross-talk among the various signaling pathways that regulate hepatic gluconeogenesis during normal fasting and refeeding cycles and in type 2 diabetes will aid the design of rational therapeutic interventions. Here, we have uncovered a role for TGF-β signaling in the regulation of hepatic gluconeogenesis and unraveled its interaction with other signaling networks in the process. The activation of TGF-β1 signaling enhanced gluconeogenesis, whereas inhibition of TGF-β1/Smad3 signaling suppressed gluconeogenesis and enhanced insulin sensitivity. TGF-β1 activation was associated with enhanced PP2A-mediated (i) dephosphorylation and inhibition of LKB1-AMPK proteins and (ii) dephosphorylation and activation of FoxO1 transcription factor. The combined effect of TGF-β/Smad3 actions resulted in increased gluconeogenic gene expression. Based on these results, we propose a model of TGF-β1/Smad3-mediated regulation of hepatic gluconeogenesis via actions on PP2A-AMPK-FoxO1 (Fig. 10).
FIGURE 10.
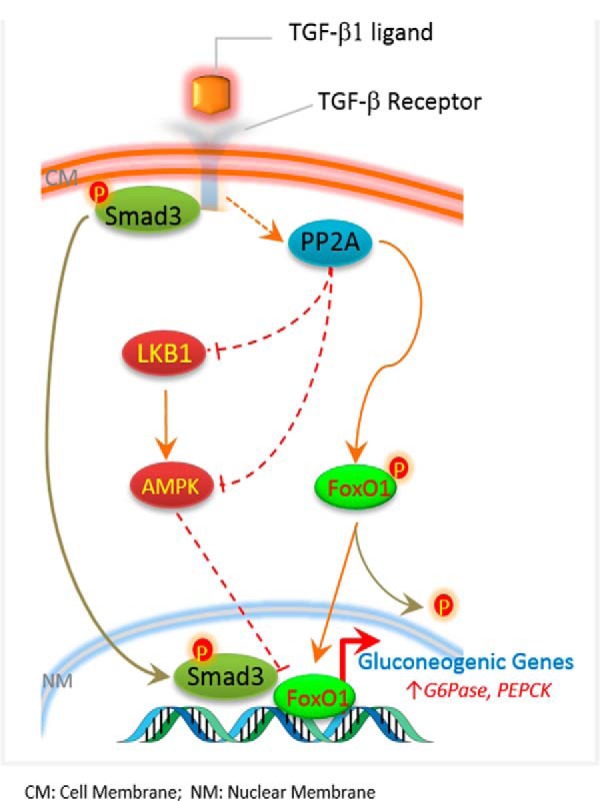
Proposed mechanistic model for TGF-β1/Smad3-mediated control of hepatic gluconeogenesis via targeting of PP2A, LKB1, AMPK, and FoxO1.
We used the mRNA and protein expression levels of two key gluconeogenic enzymes, PEPCK and G6Pase, as surrogates to monitor the levels of gluconeogenesis in response to changes in TGF-β1/Smad3 signaling. FoxO1 is known to promote gluconeogenesis via the transcriptional activation of PEPCK and G6Pase (16, 17). We observed that TGF-β/Smad3 signals regulate FoxO1 activity by modifying the PP2A-LKB1-AMPK axis. In addition to changing FoxO1 activity, it is plausible that Smad3 directly targets PEPCK and G6Pase at the transcriptional level either with or without Smad4 or other co-regulators of transcription. Indeed, our data implicating FoxO1 are suggestive of its co-regulatory role with Smad3 in gluconeogenic gene transcription. Additionally, it is plausible that TGF-β1/Smad3 targets the PEPCK and G6Pase enzymes at a post-transcriptional level. Further molecular characterization of the TGF-β regulation of gluconeogenic targets will reveal the precise mechanism of action involved in the process.
The finding that prolonged fasting or glucose deprivation of HepG2 and AML12 cells significantly increased TGF-β1 ligand secretion in media is suggestive of an important role for TGF-β1 signaling during fasting, perhaps to regulate glucose sensing in liver cells. Furthermore, the observation of elevated p-Smad3 levels during fasting and their normalization after refeeding (Fig. 1e) suggests that TGF-β1/Smad3 signaling is possibly influenced by glucose availability and may have an important role in liver cells during fasting and fed states. The levels of TGF-β1 were elevated in liver homogenates from DIO and Lepob/ob mice, which are chronic pathological models of obesity and diabetes. In contrast, although TGF-β1 signaling was elevated, the levels of TGF-β1 in the liver and in circulation were not significantly different under physiological conditions of feeding/fasting/refeeding in normal mice. This difference could be due to the extended period of diabetes and/or insulin resistance in DIO or Lepob/ob mice. The fed/fasted/refed model, on the other hand, represents a model of normal physiological gluconeogenesis. More work is needed to distinguish the TGF-β mechanism of action during normal and aberrant gluconeogenesis.
In addition to hepatocytes, the liver consists of many non-parenchymal cell types, including endothelial, Kupffer, stellate, biliary epithelial, and other immune cells. These non-parenchymal cells synthesize TGF-β, whereas hepatocytes store TGF-β (34). Chronic glucose deprivation of HepG2 and AML12 cells increased TGF-β1 secretion in media proportional to glucose production, suggestive of the ability of hepatocytes to produce TGF-β1 in response to glucose deprivation or fasting conditions. However, the possibility of TGF-β1 being produced in vivo by non-parenchymal cells, such as immune or endothelial cells, cannot be excluded. In either case, we suggest that TGF-β1 in the liver functions as a hepatokine during gluconeogenesis, both in normal physiology and during pathologic states of diabetes/obesity.
In C. elegans, the insulin receptor and TGF-β signaling collaboratively regulate nutrient and energy sensing during development and reproduction (20). We observed improved insulin signaling upon Smad3 deletion, which is consistent with a potential interaction between the insulin receptor-mediated pathway and the canonical TGFβ signaling pathway. Thus, the interaction of TGF-β signaling with other key signaling intermediates in the metabolism and regulation of glucose homeostasis appears to be evolutionarily conserved. We observed improved hepatic insulin sensitivity in the Smad3−/− mice, and as such, the increasing pAKT levels are reflective of this physiological state. Although it is not entirely clear how the increased hepatic insulin sensitivity is manifested in the Smad3−/− mice, we speculate that it may be due to cross-talk between TGF-β signaling and insulin receptor signaling, as has been demonstrated in C. elegans (35).
Although the role of TGF-β1 signaling in metabolic regulation is poorly understood, the interaction of TGF-β signaling with AMPK, a key nutrient-sensing kinase, has been studied in other cell systems. Interestingly, the AMPK-FoxO1 pathway serves an energy-sensing role during the regulation of metabolism and lifespan in C. elegans. Thus, AMPK (Aak-2) suppresses FoxO1 (Daf-16)-dependent transcription by phosphorylation of FoxO1 at multiple sites (15). The activation of AMPK via metformin and other stimuli is also known to suppress hepatic gluconeogenesis (13, 14), and our current observations indicate that TGF-β1 serves to activate hepatic gluconeogenesis by counteracting LKB1-AMPK signaling inactivation through dephosphorylation. AMPK-mediated suppression of gluconeogenesis involves the exit of FoxO1 from the nucleus to the cytoplasm via AMPK-mediated phosphorylation on multiple sites (15). Activated AMPKα translocates into the nucleus and interacts with FoxO1 to facilitate its phosphorylation and initiate the departure of FoxO1 from nucleus to cytoplasm. Multiple studies suggest that activated FoxO1 (dephosphorylated) in the nucleus binds to PEPCK and G6Pase promoters to activate their expression in prolonged fasting and insulin resistance states (12, 15, 37). TGF-β1 stimulation reduced FoxO1 phosphorylation, suggesting that TGF-β1-mediated dephosphorylation of FoxO1 facilitates its translocation into the nucleus (37). PP2A mediates the effects of TGF-β1 on LKB1-AMPk-FoxO1 dephosphorylation and the suppression of hepatic gluconeogenesis. In another study, PP2A activation is shown to deactivate hepatic AMPK through dephosphorylation to protect hepatocytes from lipotoxicity (32). FoxO1 and PP2A interact physically, and we also observed that Smad3 interacts with FoxO1 in the nuclear fraction suggesting that FoxO1 and Smad3 form a complex in the nucleus. The activation of TGF-β1/Smad3 signaling via systemic administration of TGF-β1 ligand or via transduction of Smad3 adenoviruses into the liver resulted in increased gluconeogenesis. Whether this effect is mediated entirely by the phosphorylation state of the target proteins or involves TGF-β/Smad3-dependent transcriptional mechanisms is unclear.
Our earlier studies have shown that Smad3 deletion favorably impacts pancreatic β-cells (24), adipose tissue (22), and skeletal muscle (23). Therefore, to exclude the influence of TGF-β1/Smad3 signaling on hepatic gluconeogenesis via improved whole-body metabolic function, we generated liver-specific Smad3 and TGF-β receptor I conditional knock-out (Smad3/TβRI LKO mice). The observed phenotype of improved glucose tolerance and suppressed hepatic gluconeogenesis in these mice is consistent with a primary role for TGF-β1/Smad3 signaling in the liver, independent of its actions on other metabolic tissues. We are currently investigating the overall phenotype of the Smad3/TβRI LKO mice with respect to susceptibility to metabolic disease and effects on other tissues.
Polymorphisms in the human SMAD3 locus, like the T29C polymorphism, which results in a Leu-Pro substitution at codon 10, have been correlated with increased insulin resistance and body mass index (38). Further, SMAD3 is identified in genome-wide association studies (GWAS) of T2D (39). Directed studies investigating the genetics and epigenetics of TGF-β1 signaling might reveal additional clues about the possible role of this pathway in T2D pathogenesis. Blockade of TGF-β1/Smad3 signals using shSmad3, anti-TGF-β1 receptor antibody, TβR1 inhibitors, and TβR1 and Smad3 knock-out mice suppressed endogenous glucose production from liver cells and corrected the abnormal hepatic gluconeogenesis in mice, which underscores the potential medical relevance of these findings.
Taken together, our findings provide molecular insight into the mechanism of TGF-β1 control of hepatic gluconeogenesis. These observations are central to our improved understanding of endogenous glucose production and how that process is impaired in diabetes, both of which are essential to the design of novel therapeutic strategies to combat metabolic disease.
Experimental Procedures
Animals
The generation of Smad3 KO and wild type (WT) mice has been described previously (40, 41). Animals (age 6–8 weeks) were fed with normal chow or with high fat diet (55% fat content (42), 5.45 kcal/g, catalog No. TD 97075, Harlan Teklad, Madison, WI) for induction of hepatic insulin resistance. Twenty-week-old male C57J/B6 mice fed for 14 weeks on high fat diet (DIO mice) and 10–12-week-old male Lepob/ob mice were procured from The Jackson Laboratory, Bar Harbor, ME, and used for anti-TGF-β antibody treatment studies. DIO C57J/B6 and Lepob/ob mice were injected intraperitoneally with 1.5 mg/kg body weight of anti-TGF-β1 antibody (1D11, Genzyme, Framingham, MA) and control 13C4 antibody (IgG). For fasting and refeeding studies, animals (12–14 weeks old) were fasted for 22–24 h and refed for 2 h before harvesting and tissue analysis. Age-matched ICR female mice were injected intraperitoneally with TGF-β1 ligand (5.0 mg/kg body weight) dissolved in PBS, or with PBS only in the case of control animals, for 6 days, and tissues were collected from 18-h fasted animals. TβR1 flox/flox (fl/fl) mice (43) were bred with Alb-ERT2-Cre+ve (26) to generate liver-specific deletion of TβR1. Smad3fl/fl mice were generated by floxing of exon 8 of the Smad3 locus. These mice were crossed with AlbERT2-Cre+ve mice to develop liver-specific Smad3 KO mice. TβR1 and Smad3 deletions were induced by an oral dose of tamoxifen solution in corn oil (110 mg/kg body weight continuously for 5 days), and experiments were performed 1 week after the tamoxifen oral dosages. All animal studies and protocols were approved by the NIDDK, National Institutes of Health Animal Care and Use Committee.
Pyruvate and Glucagon Tolerance Tests
The pyruvate tolerance test was performed in 18-h fasted mice by intraperitoneal injection of 1.5 g/kg body weight of sodium pyruvate (Sigma). A glucagon challenge test was performed in ad libitum fed mice upon intraperitoneal injection of 30 μg/kg of glucagon (Lilly). Tail blood was taken at different time points, i.e. before injection (0 min) and after 15, 30, 60, and 120 min of pyruvate/glucagon injections, and glucose levels were measured using a glucometer (Nipro Diagnostics, Fort Lauderdale, FL).
Cell Culture and Treatments
HepG2 cells were cultured in DMEM containing 5 mm glucose, 10% (v/v) FBS, and 1% antibiotics supplements at 37 °C in a humidified atmosphere of 5% CO2. AML12 cells were grown in a 1:1 mixture of DMEM and Ham's F-12 medium supplemented with 0.005 mg/ml insulin, 0.005 mg/ml transferrin, 5 ng/ml selenium, 40 ng/ml dexamethasone, 10% FBS, and 1% antibiotics supplements. TGF-β1 was obtained from R&D Systems or from Dr. Peter Sun (NIAID, National Institutes of Health, Bethesda, MD). Cells were cultured in medium with 10% FBS, which contains less than 0.5–1 ng/ml total TGF-β1 (more than 99% of TGF-β1 is in a latent form, which is not immediately available to the cells). During TGF-β1 stimulation, cells were washed twice with PBS and replaced with medium containing only 2% charcoal-treated FBS to further eliminate any residual TGF-β1 after which they were treated with/without 2–5 ng/ml TGF-β1 at different time intervals. The majority of the cell culture studies were conducted in glucose-deprived media and supplemented with pyruvate and lactate to induce gluconeogenesis as described below. All cell culture assays were performed in triplicates.
Glucose Production in Cells
Normal HepG2, AML12, and stable ShSmad3 HepG2 cells were plated in 6-well plates in a 5% CO2 incubator at 37 °C for 24–48 h. At 70–80% confluency, cells were incubated overnight in DMEM containing 2% charcoal-treated FBS and 1% antibiotics. Cells were washed three times with PBS to remove all traces of glucose and incubated in glucose-free media containing 2% charcoal-treated FBS plus phenol red for 2 h. Cells were treated with 5 ng/ml TGF-β1 ligand and/or TGF-β receptor I inhibitor (SB 431542) and PP2A inhibitor (okadaic acid) in glucose production assay medium (phenol red and glucose-free DMEM) containing 2 mm sodium pyruvate and 20 mm sodium lactate, pH 7.4, and incubated for up to 24 h. A small fraction of the medium (100 μl) was collected to measure glucose concentrations (Amplex Red glucose/glucose oxidase assay kit, Life Technologies). Glucose values were normalized with cellular total protein concentrations.
TGF-β1 Measurements
Human and mouse TGF-β1 levels were measured in HepG2 and AML12 cell supernatants, mouse liver homogenates, and plasma using R&D Systems' Quantikine ELISA kits following the manufacturer's instructions. Liver homogenate was prepared in homogenization buffer containing 10 mm Tris-Hcl, pH 7.6, 1% Triton X-100, 0.5% Nonidet P-40, 150 mm NaCl, 10 mm sodium orthovanadate, 10 mm sodium pyrophosphate, 100 mm sodium fluoride, 1 mm EDTA, 1 mm EGTA, and 1 tablet of protease inhibitor mixture (Roche Applied Science). Total protein was measured using a BCA protein assay kit, and TGF-β1 values were normalized to total protein content in media supernatant and liver homogenate.
PP2A Activity Assay
PP2A activity was measured using a PP2A immunoprecipitation phosphatase assay Kit (Millipore) following the manufacturer's instructions. Briefly, cells were lysed using lysis buffer containing 50 mm HEPES, pH 7.5, 150 mm NaCl, 1 mm EGTA, 10% glycerol, 1.5 mm magnesium chloride, 1% Triton X-100, 1 μg of leupeptin/ml, 50 units of aprotinin, and 1 mm phenylmethylsulfonyl fluoride by brief vortexing and pulsing in a sonicator followed by centrifugation for 3 min at full speed. Clear supernatants were incubated with anti-PP2A antibody and protein A-agarose for 2 h at 4 °C. Immunoprecipitates were resuspended in a p-nitrophenyl phosphate Ser-Thr assay buffer and incubated for 2 h at 4 °C. Subsequent steps were as suggested by the manufacturer. PP2A activity was determined by measuring the absorbance at 650 nm and comparing absorbance values of samples to the negative control containing no enzyme.
Real-time PCR Analysis
Total RNA was isolated from cells and mouse liver tissues using the RNeasy kit (Qiagen) following the manufacturer's protocol. Reverse transcription was performed using MultiScribe RT (Applied Biosystems), and gene expression levels were measured by real-time quantitative RT-PCR (7900HT and SDS, Applied Biosystems). PCR reactions (20 μl total volume) included cDNA (10 ng of initial RNA sample), each primer at 100–120 nm, and 10 μl of 2× SYBR Green Master Mix (Applied Biosystems). The PCR cycling conditions were as follows: 50 °C for 2 min, 95 °C for 10 min, and 40 cycles at 95 °C for 15 s, and 60 °C for 1 min, respectively. The expression of 18S served as an internal control. Four independent samples prepared from different mice (n = 4–6 mice) were used per genotype/condition. Similarly, three independent experiments using cell lines were performed, with each condition done in triplicates. The results were calculated adopting ΔΔCt analysis and expressed as -fold change in gene expression relative to 18S expression. Primer sequences used are provided in Table 1.
TABLE 1.
Primer sequences used for gene expression analysis
| Sequence No. | Gene namea | Forward primer sequence | Reverse primer sequence |
|---|---|---|---|
| 5′ → 3′ | 5′ → 3′ | ||
| 1 | mG6Pase | ACACCGACTACTACAGCAACAG | CCTCGAAAGATAGCAAGAGTAG |
| 2 | mPEPCK | AAGCATTCAACGCCAGGTTC | GGGCGAGTCTGTCAGTTCAAT |
| 3 | hG6Pase | ACTGGCTCAACCTCGTCTTTA | CGGAAGTGTTGCTGTAGTAGTCA |
| 4 | hPEPCK | GCAAGACGGTTATCGTCACCC | GGCATTGAACGCTTTCTCAAAAT |
| 5 | mMyc | ATGCCCCTCAACGTGAACTTC | CGCAACATAGGATGGAGAGCA |
| 6 | mSerpine1 | CAGAGCAACAAGTTCAACTACACTGA | CAGCGATGAACATGCTGAGG |
| 7 | hSerpine-1 | TAGACCGATTATTGACCGACCT | GTTTGCCACGAGAATCAAATCC |
| 8 | mSmad7 | GGCCGGATCTCAGGCATTC | TTGGGTATCTGGAGTAAGGAGG |
| 9 | hSmad7 | GGACAGCTCAATTCGGACAAC | GTACACCCACACACCATCCAC |
| 10 | mMmp1 | GGAAAGGCTTTTCGACTTGCT | GGGTTCCATTGATGGTCCAGAA |
| 11 | hMmp1 | AAAATTACACGCCAGATTTGCC | GGTGTGACATTACTCCAGAGTTG |
| 12 | mP21 | GGATGAAGTTGACGAAATCGTGG | TGTTCACGGGGGCTTTTAGAA |
| 13 | 18S | CGCCGCTAGAGGTGAAATTC | TTGGCAAATGCTTTCGCTC |
a m, mouse; h, human.
Western Blotting Analysis
Protein extracts for Western blotting analysis were prepared from cells and snap-frozen liver tissue by homogenization in buffer containing 10 mmol/liter Tris, pH 7.6, 1% Triton X-100, 0.5% Nonidet P-40, 150 mmol/liter NaCl, 10 mmol/liter sodium orthovanadate, 10 mmol/liter Na-pyrophosphate, 100 mmol/liter Na-fluoride, 1 mmol/liter EDTA, 1 mmol/liter EGTA, and a mixture of protease inhibitors (Roche Applied Science) as described elsewhere (36). Protein lysates were spun in an Eppendorf centrifuge, and the supernatants were stored at −80 °C until use. Protein concentrations were determined using the BCA protein assay. Twenty-five μg of protein was fractionated onto a 10% denaturing SDS-polyacrylamide gel and transferred to PVDF membranes. Blots were blocked in 5% skimmed milk powder solution in TBST (1× TBS and 0.1% Tween 20) for 1 h, washed briefly with TBST, incubated with the primary antibodies, i.e. total Smad3 (Abcam), PEPCK, G6Pase, FoxO1, PP2A-α, PP2A-β56, PP2A-Cα (Santa Cruz Biotechnology), tubulin (Sigma), phospho-Smad3, phospho-Akt, Akt, phospho-IRS1, IRS1, phospho-ERK1/2, ERK1/2, TGF-βRI, phospho-LKB1, LKB1, phospho-AMPKα, AMPKα, phospho-AMPKβ1/2, AMPKβ1/2, phospho-FoxO1, FoxO1 (Cell Signaling), and anti-Cre (Novagen), in TBST-BSA for 2 h to overnight (depending on antibody product sheet recommendations). HRP-coupled secondary antibodies were used before final detection of the conjugate by chemiluminescence and visualization by exposure to an X-ray film or ChemiDoc imaging system (Bio-Rad). α-Tubulin was used as a loading control.
Cytoplasmic and Nuclear Fractionation and Immunoprecipitation Assay
Cells were subjected to cytoplasmic and nuclear fractionation using the NE-PER nuclear and cytoplasmic extraction reagent (Pierce) from Thermo Scientific. Protein binding assay were performed using a Pierce co-immunoprecipitation kit (Thermo Scientific) following the manufacturer's instructions. In brief, an equal amount of protein from each sample was immunoprecipitated with anti-FoxO1 antibody followed by Western blotting analyses with anti-Smad3, anti-phospho-Smad3, and anti-PP2A-c antibodies. Anti-tubulin antibody was used as an internal control for the cytoplasmic fraction, and anti-histone 3 antibody served as an internal control for the nuclear fraction.
Statistical Analysis
All data are expressed as mean ± S.E. Statistical significance between groups was determined using two-tailed Student's t test or one-way analysis of variance. p values of <0.05 were considered statistically significant, and all tests were two-sided.
Author Contributions
H. Y. conducted the majority of the experiments, analyzed the data, prepared the figures, and wrote the initial draft of the manuscript. S. D. provided help with Western blotting experiments and discussions. S. T. C. provided critical insight and comments on the manuscript. S. G. R. conceived the idea for the project and drafted the paper with H. Y.
Acknowledgments
We thank Alice Franks, William Jou, Anthony Vieira, and Anup Reddy for technical support, Peter Sun (NIAID, National Institutes of Health) for providing TGF-β ligand, and Ranganath Muniyappa and Oksana Gavrilova for critical reading of the manuscript.
This work was supported by a grant from the National Institutes of Health Intramural Research Program. The authors declare that they have no conflicts of interest with the contents of this article. The content is solely the responsibility of the authors and does not necessarily represent the official views of the National Institutes of Health.
- T2D
- type 2 diabetes
- PEPCK
- phosphoenolpyruvate carboxykinase
- G6Pase
- glucose-6-phosphatase
- AMPK
- AMP-activated protein kinase
- TβR
- TGF-β receptor
- PP2A
- protein phosphatase 2A
- FoxO1
- Forkhead box protein O1
- DIO
- diet-induced obese
- PTT
- pyruvate tolerance test
- NC
- normal chow
- HFD
- high fat diet
- ShSmad3
- short hairpin RNA against Smad3
- OKA
- okadaic acid
- fl/fl
- flox, flox.
References
- 1. Pilkis S. J., el-Maghrabi M. R., and Claus T. H. (1988) Hormonal regulation of hepatic gluconeogenesis and glycolysis. Annu. Rev. Biochem. 57, 755–783 [DOI] [PubMed] [Google Scholar]
- 2. Chung S. T., Hsia D., Bacha F., Rodriguez L., Chacko S., and Haymond M. W. (2013) Increased gluconeogenesis is a major contributor to hyperglycemia in adolescents with newly diagnosed type 2 diabetes. Diabetes 62, A56–A56 [Google Scholar]
- 3. Osorio J. (2012) Metabolism: an Akt-independent pathway for regulation of gluconeogenesis. Nat. Rev. Endocrinol. 8, 257. [DOI] [PubMed] [Google Scholar]
- 4. Veneziale C. M., Donofrio J. C., and Nishimura H. (1983) The concentration of P-enolpyruvate carboxykinase protein in murine tissues in diabetes of chemical and genetic origin. J. Biol. Chem. 258, 14257–14262 [PubMed] [Google Scholar]
- 5. Valera A., Pujol A., Pelegrin M., and Bosch F. (1994) Transgenic mice overexpressing phosphoenolpyruvate carboxykinase develop non-insulin-dependent diabetes mellitus. Proc. Natl. Acad. Sci. U.S.A. 91, 9151–9154 [DOI] [PMC free article] [PubMed] [Google Scholar]
- 6. Sun Y., Liu S., Ferguson S., Wang L., Klepcyk P., Yun J. S., and Friedman J. E. (2002) Phosphoenolpyruvate carboxykinase overexpression selectively attenuates insulin signaling and hepatic insulin sensitivity in transgenic mice. J. Biol. Chem. 277, 23301–23307 [DOI] [PubMed] [Google Scholar]
- 7. Gómez-Valadés A. G., Méndez-Lucas A., Vidal-Alabró A., Blasco F. X., Chillon M., Bartrons R., Bermúdez J., and Perales J. C. (2008) Pck1 gene silencing in the liver improves glycemia control, insulin sensitivity, and dyslipidemia in db/db mice. Diabetes 57, 2199–2210 [DOI] [PMC free article] [PubMed] [Google Scholar]
- 8. Miller R. A., Chu Q., Le Lay J., Scherer P. E., Ahima R. S., Kaestner K. H., Foretz M., Viollet B., and Birnbaum M. J. (2011) Adiponectin suppresses gluconeogenic gene expression in mouse hepatocytes independent of LKB1-AMPK signaling. J. Clin. Invest. 121, 2518–2528 [DOI] [PMC free article] [PubMed] [Google Scholar]
- 9. O'Neill H. M., Holloway G. P., and Steinberg G. R. (2013) AMPK regulation of fatty acid metabolism and mitochondrial biogenesis: implications for obesity. Mol. Cell. Endocrinol. 366, 135–151 [DOI] [PubMed] [Google Scholar]
- 10. Hardie D. G., Hawley S. A., and Scott J. W. (2006) AMP-activated protein kinase: development of the energy sensor concept. J. Physiol. 574, 7–15 [DOI] [PMC free article] [PubMed] [Google Scholar]
- 11. Woods A., Dickerson K., Heath R., Hong S. P., Momcilovic M., Johnstone S. R., Carlson M., and Carling D. (2005) Ca2+/calmodulin-dependent protein kinase kinase-β acts upstream of AMP-activated protein kinase in mammalian cells. Cell Metab. 2, 21–33 [DOI] [PubMed] [Google Scholar]
- 12. Lee J. M., Seo W. Y., Song K. H., Chanda D., Kim Y. D., Kim D. K., Lee M. W., Ryu D., Kim Y. H., Noh J. R., Lee C. H., Chiang J. Y., Koo S. H., and Choi H. S. (2010) AMPK-dependent repression of hepatic gluconeogenesis via disruption of CREB·CRTC2 complex by orphan nuclear receptor small heterodimer partner. J. Biol. Chem. 285, 32182–32191 [DOI] [PMC free article] [PubMed] [Google Scholar]
- 13. Baur J. A., and Birnbaum M. J. (2014) Control of gluconeogenesis by metformin: does redox trump energy charge? Cell Metab. 20, 197–199 [DOI] [PMC free article] [PubMed] [Google Scholar]
- 14. Hou X., Song J., Li X. N., Zhang L., Wang X., Chen L., and Shen Y. H. (2010) Metformin reduces intracellular reactive oxygen species levels by upregulating expression of the antioxidant thioredoxin via the AMPK-FOXO3 pathway. Biochem. Biophys. Res. Commun. 396, 199–205 [DOI] [PubMed] [Google Scholar]
- 15. Greer E. L., Dowlatshahi D., Banko M. R., Villen J., Hoang K., Blanchard D., Gygi S. P., and Brunet A. (2007) An AMPK-FOXO pathway mediates longevity induced by a novel method of dietary restriction in C. elegans. Curr. Biol. 17, 1646–1656 [DOI] [PMC free article] [PubMed] [Google Scholar]
- 16. Hall R. K., Yamasaki T., Kucera T., Waltner-Law M., O'Brien R., and Granner D. K. (2000) Regulation of phosphoenolpyruvate carboxykinase and insulin-like growth factor-binding protein-1 gene expression by insulin: the role of winged helix/Forkhead proteins. J. Biol. Chem. 275, 30169–30175 [DOI] [PubMed] [Google Scholar]
- 17. Schmoll D., Walker K. S., Alessi D. R., Grempler R., Burchell A., Guo S., Walther R., and Unterman T. G. (2000) Regulation of glucose-6-phosphatase gene expression by protein kinase Bα and the Forkhead transcription factor FKHR: evidence for insulin response unit-dependent and -independent effects of insulin on promoter activity. J. Biol. Chem. 275, 36324–36333 [DOI] [PubMed] [Google Scholar]
- 18. Akhurst R. J., and Hata A. (2012) Targeting the TGFβ signalling pathway in disease. Nat. Rev. Drug Discov. 11, 790–811 [DOI] [PMC free article] [PubMed] [Google Scholar]
- 19. Zhang Y. E. (2009) Non-Smad pathways in TGF-β signaling. Cell Res. 19, 128–139 [DOI] [PMC free article] [PubMed] [Google Scholar]
- 20. Ogg S., Paradis S., Gottlieb S., Patterson G. I., Lee L., Tissenbaum H. A., and Ruvkun G. (1997) The Forkhead transcription factor DAF-16 transduces insulin-like metabolic and longevity signals in C. elegans. Nature 389, 994–999 [DOI] [PubMed] [Google Scholar]
- 21. Narbonne P., and Roy R. (2006) Inhibition of germline proliferation during C. elegans dauer development requires PTEN, LKB1, and AMPK signalling. Development 133, 611–619 [DOI] [PubMed] [Google Scholar]
- 22. Yadav H., Quijano C., Kamaraju A. K., Gavrilova O., Malek R., Chen W., Zerfas P., Zhigang D., Wright E. C., Stuelten C., Sun P., Lonning S., Skarulis M., Sumner A. E., Finkel T., and Rane S. G. (2011) Protection from obesity and diabetes by blockade of TGF-β/Smad3 signaling. Cell Metab. 14, 67–79 [DOI] [PMC free article] [PubMed] [Google Scholar]
- 23. Tiano J. P., Springer D. A., and Rane S. G. (2015) SMAD3 negatively regulates serum irisin and skeletal muscle FNDC5 and peroxisome proliferator-activated receptor γ coactivator 1-α (PGC-1α) during exercise. J. Biol. Chem. 290, 11431. [DOI] [PMC free article] [PubMed] [Google Scholar]
- 24. Lin H. M., Lee J. H., Yadav H., Kamaraju A. K., Liu E., Zhigang D., Vieira A., Kim S. J., Collins H., Matschinsky F., Harlan D. M., Roberts A. B., and Rane S. G. (2009) Transforming growth factor-β/Smad3 signaling regulates insulin gene transcription and pancreatic islet β-cell function. J. Biol. Chem. 284, 12246–12257 [DOI] [PMC free article] [PubMed] [Google Scholar]
- 25. Stopa M., Anhuf D., Terstegen L., Gatsios P., Gressner A. M., and Dooley S. (2000) Participation of Smad2, Smad3, and Smad4 in transforming growth factor β (TGF-β)-induced activation of Smad7: the TGF-β response element of the promoter requires functional Smad binding element and E-box sequences for transcriptional regulation. J. Biol. Chem. 275, 29308–29317 [DOI] [PubMed] [Google Scholar]
- 26. Hayhurst G. P., Lee Y. H., Lambert G., Ward J. M., and Gonzalez F. J. (2001) Hepatocyte nuclear factor 4α (nuclear receptor 2A1) is essential for maintenance of hepatic gene expression and lipid homeostasis. Mol. Cell. Biol. 21, 1393–1403 [DOI] [PMC free article] [PubMed] [Google Scholar]
- 27. Ramakrishnan S. K., Zhang H., Takahashi S., Centofanti B., Periyasamy S., Weisz K., Chen Z., Uhler M. D., Rui L., Gonzalez F. J., and Shah Y. M. (2016) HIF2α is an essential molecular brake for postprandial hepatic glucagon response independent of insulin signaling. Cell Metab. 23, 505–516 [DOI] [PMC free article] [PubMed] [Google Scholar]
- 28. Yakar S., Liu J. L., Stannard B., Butler A., Accili D., Sauer B., and LeRoith D. (1999) Normal growth and development in the absence of hepatic insulin-like growth factor I. Proc. Natl. Acad. Sci. U.S.A. 96, 7324–7329 [DOI] [PMC free article] [PubMed] [Google Scholar]
- 29. Greer E. L., Banko M. R., and Brunet A. (2009) AMP-activated protein kinase and FoxO transcription factors in dietary restriction-induced longevity. Ann. N. Y. Acad. Sci. 1170, 688–692 [DOI] [PMC free article] [PubMed] [Google Scholar]
- 30. Deng L., Shoji I., Ogawa W., Kaneda S., Soga T., Jiang D. P., Ide Y. H., and Hotta H. (2011) Hepatitis C virus infection promotes hepatic gluconeogenesis through an NS5A-mediated, FoxO1-dependent pathway. J. Virol. 85, 8556–8568 [DOI] [PMC free article] [PubMed] [Google Scholar]
- 31. Awad H., Nolette N., Hinton M., and Dakshinamurti S. (2014) AMPK and FoxO1 regulate catalase expression in hypoxic pulmonary arterial smooth muscle. Pediatr. Pulmonol. 49, 885–897 [DOI] [PubMed] [Google Scholar]
- 32. Wu Y., Song P., Xu J., Zhang M., and Zou M. H. (2007) Activation of protein phosphatase 2A by palmitate inhibits AMP-activated protein kinase. J. Biol. Chem. 282, 9777–9788 [DOI] [PubMed] [Google Scholar]
- 33. Landau B. R., Wahren J., Chandramouli V., Schumann W. C., Ekberg K., and Kalhan S. C. (1996) Contributions of gluconeogenesis to glucose production in the fasted state. J. Clin. Invest. 98, 378–385 [DOI] [PMC free article] [PubMed] [Google Scholar]
- 34. Schon H. T., and Weiskirchen R. (2014) Immunomodulatory effects of transforming growth factor-β in the liver. Hepatobiliary Surg. Nutr. 3, 386–406 [DOI] [PMC free article] [PubMed] [Google Scholar]
- 35. Shaw W. M., Luo S., Landis J., Ashraf J., and Murphy C. T. (2007) The C. elegans TGF-β dauer pathway regulates longevity via insulin signaling. Curr. Biol. 17, 1635–1645 [DOI] [PMC free article] [PubMed] [Google Scholar]
- 36. Yakar S., Liu J. L., Fernandez A. M., Wu Y., Schally A. V., Frystyk J., Chernausek S. D., Mejia W., and Le Roith D. (2001) Liver-specific igf-1 gene deletion leads to muscle insulin insensitivity. Diabetes 50, 1110–1118 [DOI] [PubMed] [Google Scholar]
- 37. Aoyama H., Daitoku H., and Fukamizu A. (2006) Nutrient control of phosphorylation and translocation of Foxo1 in C57BL/6 and db/db mice. Int. J. Mol. Med. 18, 433–439 [PubMed] [Google Scholar]
- 38. Rosmond R., Chagnon M., Bouchard C., and Björntorp P. (2003) Increased abdominal obesity, insulin and glucose levels in nondiabetic subjects with a T29C polymorphism of the transforming growth factor-β1 gene. Horm. Res. 59, 191–194 [DOI] [PubMed] [Google Scholar]
- 39. Perry J. R., McCarthy M. I., Hattersley A. T., Zeggini E., Wellcome Trust Case Control Consortium, Weedon M. N., and Frayling T. M. (2009) Interrogating type 2 diabetes genome-wide association data using a biological pathway-based approach. Diabetes 58, 1463–1467 [DOI] [PMC free article] [PubMed] [Google Scholar]
- 40. Datto M. B., Frederick J. P., Pan L., Borton A. J., Zhuang Y., and Wang X. F. (1999) Targeted disruption of Smad3 reveals an essential role in transforming growth factor β-mediated signal transduction. Mol. Cell. Biol. 19, 2495–2504 [DOI] [PMC free article] [PubMed] [Google Scholar]
- 41. Yang X., Letterio J. J., Lechleider R. J., Chen L., Hayman R., Gu H., Roberts A. B., and Deng C. (1999) Targeted disruption of SMAD3 results in impaired mucosal immunity and diminished T cell responsiveness to TGF-β. EMBO J. 18, 1280–1291 [DOI] [PMC free article] [PubMed] [Google Scholar]
- 42. della Vecchia N. F., Cerruti P., Gentile G., Errico M. E., Ambrogi V., D'Errico G., Longobardi S., Napolitano A., Paduano L., Carfagna C., and d'Ischia M. (2014) Artificial biomelanin: highly light-absorbing nano-sized eumelanin by biomimetic synthesis in chicken egg white. Biomacromolecules 15, 3811–3816 [DOI] [PubMed] [Google Scholar]
- 43. Larsson J., Blank U., Helgadottir H., Björnsson J. M., Ehinger M., Goumans M. J., Fan X., Levéen P., and Karlsson S. (2003) TGF-β signaling-deficient hematopoietic stem cells have normal self-renewal and regenerative ability in vivo despite increased proliferative capacity in vitro. Blood 102, 3129–3135 [DOI] [PubMed] [Google Scholar]