

Abstract
Recovery from organ-specific autoimmune diseases largely relies on the mobilization of endogenous repair mechanisms and local factors that control them. Natural killer (NK) cells are swiftly mobilized to organs targeted by autoimmunity and typically undergo numerical contraction when inflammation wanes. We report the unexpected finding that NK cells are retained in the brain subventricular zone (SVZ) during the chronic phase of multiple sclerosis in humans and its animal model in mice. These NK cells were found preferentially in close proximity to SVZ neural stem cells (NSCs) that produce interleukin-15 and sustain functionally competent NK cells. Moreover, NK cells limited the reparative capacity of NSCs following brain inflammation. These findings reveal that reciprocal interactions between NSCs and NK cells regulate neurorepair.
NK cells are among the first responders to danger signals and can be swiftly mobilized to target organs in the early stages of inflammation1–6. The homeostasis and function of NK cells, as well as their effects on other cell types, have been extensively characterized in many target organs of inflammation, where NK cells typically undergo compartment contraction when inflammation wanes3,4,7–10. However, little is known about the fate of NK cells recruited into the inflamed CNS. It has been proposed that, after homing to the inflamed CNS, NK cells become receptive to cells and factors that they have not previously encountered in the periphery1. However, the cellular and molecular interactions of NK cells with cells of the CNS that ultimately shape NK cell homeostasis and function in this target organ are not well understood.
The CNS is a distinct microenvironment that allows intimate interactions between the immune and nervous systems. Such interactions determine the magnitude of immune-mediated tissue damage in the CNS and perhaps the subsequent neurorepair mechanisms. Multiple sclerosis (MS) and its animal model experimental autoimmune encephalomyelitis (EAE) are classic organ-specific autoimmune diseases characterized by massive CNS inflammatory infiltrates that include NK cells1,11–13. NK cells limit local inflammatory and autoimmune responses and shape the immune-mediated damage to myelin during the initiation of EAE11–14. EAE in C57BL/6 mice is characterized by neurological deficits mediated by autoimmune- mediated damage to the myelin sheath, followed by spontaneous partial recovery with attenuated brain inflammation.
SVZ type B cells are NSCs that have the capacity to proliferate and differentiate into neurons and glia15, giving rise to transit-amplifying progenitors (type C cells) that, in turn, can differentiate into neuroblasts (type A cells) and migrate to sites of brain insult16,17. Thus, this cell lineage differentiation pathway proceeds from type B to type C to type A cells, with type B cells exhibiting properties of multipotent stem cells15. The finding that inflammation activates SVZ cells but that recovery from EAE is only partial suggests that the neurorepair functions of these cells during recovery from EAE are insufficient or even impaired18–20. However, the underlying mechanisms remain unclear.
In addition to their effects on neurons and glia, recent studies have indicated that neural stem or progenitor cells are capable of imparting immunomodulatory effects that can influence brain inflammation21–23. However, the target cells of NSC-mediated immunomodulation remain unclear. Considering the critical role of NK cells in controlling inflammatory responses in the CNS1,5,12,24,25, we investigated the possible interactions between NSCs and NK cells during CNS inflammation and their effects on neurorepair and recovery from EAE. We found that NSCs and NK cells engage in reciprocal interactions during CNS inflammation that control neurorepair during recovery from EAE, thus identifying these interactions as targets for immunotherapy of inflammatory diseases of the CNS.
RESULTS
Retention of NK cells in the SVZ during brain inflammation
Cells expressing the NK cell marker NKp46 densely populated brain sections from patients in the chronic stage of MS and were predominantly located in the SVZ (Fig. 1a–d,h), whereas NKp46+ cells were less abundant in the adjacent striatum (Fig. 1f–h) and absent in SVZ in controls without neurological disease (Fig. 1e). Further, NKp46+ cells resided in close proximity to periventricular ribbon cells expressing the astrocyte marker GFAP (Fig. 1b) and the neural stem/progenitor cell marker EGFR (Fig. 1c). The latter population includes NSCs; that is, type B cells. In particular, NKp46+ cells were in close proximity to GFAP+SOX2+ cells (Fig. 1d), which are NSCs. Thus, NK cells that have infiltrated the CNS are closely associated with NSCs, possibly interacting with these cells in the SVZ of the human brain.
Figure 1.
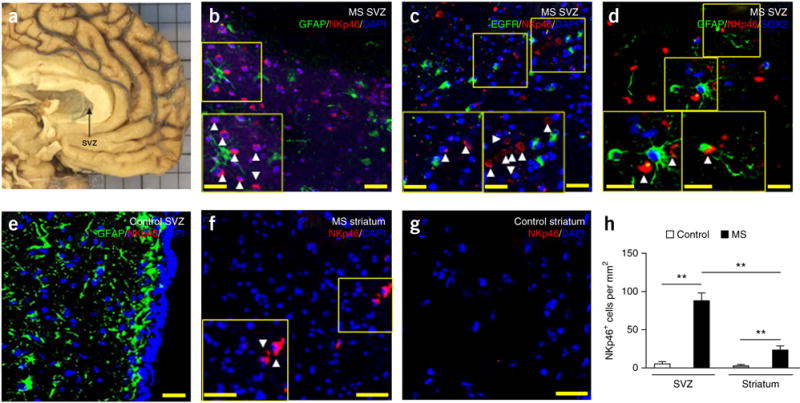
Retention of NK cells in the SVZ of MS patients. (a) Representative brain tissues containing SVZ (arrow) obtained from a patient with MS in clinical remission. (b–g) Infiltrated NKp46+ cells (red) in SVZ (b–d) and striatum (f) of brain sections from patients with MS, which were largely absent in SVZ (e) and striatum (g) of brain sections from controls without neurological disease. NK cells reside in close proximity to GFAP+, EGFR+ or GFAP+SOX2+ cells in the SVZ (green: GFAP in b,d,e or EGFR in c; red: NKp46 in b–g; blue: DAPI in b,c,e–g or SOX2 in d). Insets show higher magnification of corresponding boxed regions. Arrowheads, NKp46+ cells. (h) Quantification of NK cell infiltration in brain sections from the SVZ and striatum of patients with MS in clinical remission (n = 6) and in controls without neurological disease (n = 5). P < 0.001, MS SVZ versus control SVZ; P = 0.001, MS striatum versus control striatum; P = 0.003, MS SVZ versus MS striatum. F(1,18) = 11.93, two-way ANOVA. Scale bars: 40 μm (a–g), 20 μm (a–g, inset). Data are representative of three independent experiments. Error bars represent s.e.m.; **P < 0.01.
The homing of NK cells to the brain has been examined in EAE during the initiation and peak phase of the disease12–14. However, the fate of NK cells in the CNS during the late stages of EAE has to our knowledge not been previously studied. To investigate this aspect, and to facilitate the visualization of NK cells, we induced EAE in NK1.1-tdTomato Cd1d−/− mice, in which a red fluorescent reporter gene (tdTomato) has been knocked into an NK1.1 (Klrb1c) allele to specifically track NK cells, (in the absence of NK1.1-expressing, CD1d-dependent NKT cells)26. We found that, during the late stages of EAE in NK1.1-tdTomato Cd1d−/− mice NK cells accumulated in the SVZ, mainly within the neurogenic niche, in close proximity to GFAP+ and EGFR+ cells (Fig. 2a,b).
Figure 2.
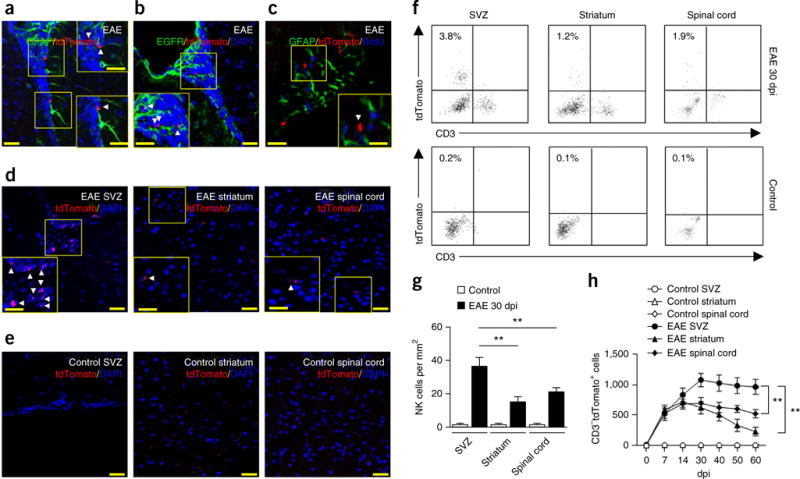
Preferential accumulation of NK cells in the SVZ during progression of brain inflammation. (a–e) Infiltrating NK1.1-tdTomato+ cells (red) in the SVZ of brain slices from NK1.1-tdTomato Cd1d−/− mouse brains at 30 dpi or healthy MOG-immunized and pertussis toxin–treated controls (control). NK cells resided in close proximity to GFAP+ or EGFR+ cells in the SVZ (a–c) at 30 dpi. (d) Infiltrating NK cells were seen in SVZ, but were relatively sparse in striatum or spinal cord sections. (e) NK cells were not noticeable in healthy MOG-immunized and pertussis toxin–treated controls. Green: GFAP in a,c, EGFR in b; red: tdTomato in a–e; blue: DAPI in a,b,d,e, BrdU in c. Scale bars: 40 μm (a–e), 20 μm (a–e, inset). Insets show higher magnification of corresponding boxed regions. Arrowheads, tdTomato+ cells. (f) Representative flow cytometry plots for CD3−NK1.1-tdTomato+ cells in the SVZ, striatum and spinal cord tissues of EAE mice (30 dpi) and healthy MOG-immunized and pertussis toxin–treated controls. All gates were set using FMO controls (Supplementary Fig. 1). (g) Quantification of infiltrating NK cells (tdTomato+) in brain sections from the SVZ of EAE mice (0–60 dpi) or healthy MOG-immunized and pertussis toxin–treated NK1.1-tdTomato Cd1d−/− controls. Average EAE disease grade for mice used for tissue analysis at the time of tissue collection was 2.3 ± 0.5. n = 6 mice per group. P = 0.007, EAE SVZ versus EAE striatum; P = 0.008, EAE SVZ versus EAE spinal cord. F(2,30) = 6.51, two-way ANOVA. (h) Time course of infiltrating NK cells in the SVZ, striatum and spinal cord of EAE mice. Cell infiltrates were isolated from brain homogenates. Kinetics of NK cell infiltration during EAE were quantified by flow cytometry. Absolute numbers of NK cells per SVZ, striatum or spinal cord tissue are shown. Average EAE disease grade for mice used for tissue analysis at the time of tissue collection was 3.3 ± 0.8 at 14 dpi, 2.2 ± 0.6 at 30 dpi, 1.9 ± 0.7 at 40 dpi and 1.7 ± 0.8 at 60 dpi. n = 8 mice per time point. P = 0.002, EAE SVZ versus EAE striatum; P = 0.001, EAE SVZ versus EAE spinal cord. F(30,294) = 7.48, two-way ANOVA. Data are representative of four independent experiments. Error bars represent s.e.m.; **P < 0.01.
A hallmark of NSCs is their state of quiescence, which is reflected by their ability to retain cell cycle S-phase labels such as BrdU for extended time periods. We found that NK cells were closely associated with GFAP+BrdU+ cells (Fig. 2c), suggesting potential interactions between NK cells and NSCs in the SVZ during EAE recovery.
We next analyzed the pattern and dynamics of NK cell accumulation in different regions of the brain. Histopathology showed that, during the late stages of EAE, NK cells accumulated in SVZ and were less abundant in spinal cord (Fig. 2d,g). Of interest, NK cells were sparse in SVZ-adjacent areas such as the striatum (Fig. 2d,g). NK cells were not noticeable in healthy controls immunized with myelin oligodendrocyte glycoprotein (MOG) (Fig. 2e,g). Moreover, flow cytometry analysis of isolated SVZ cells from dissected SVZ tissue of MOG-primed NK1.1-tdTomato mice revealed that NK cells (CD3−tdTomato+ cells) started to accumulate in the SVZ before the peak phase of EAE. Such accumulation was more prominent during the late stages (Fig. 2f,h), and NK cells were still detectable as late as 60 days post-immunization (dpi) (Fig. 2h). All gates were set using fluorescence minus one (FMO) controls (Supplementary Fig. 1). This pattern of NK cell infiltration into the SVZ during EAE in mice is reminiscent of our findings in MS patients.
NSC-derived factors maintain NK cell homeostasis
We quantified inflammatory cytokines and chemokines in the CNS of EAE mice. Interferon (IFN)-γ, tumor necrosis factor (TNF)-α and interleukin (IL)-1β were greatly reduced during the late stages as compared with the peak phase of EAE (Supplementary Fig. 2). Accumulation of NK cells within the SVZ in the context of attenuated brain inflammation raised the possibility that SVZ-derived factors sustain NK cells. Therefore, we collected SVZ cells, including NSCs and other progenitors27, from wild-type mice and analyzed factors produced by distinct SVZ subsets. Representative plots are shown in Figure 3a. Briefly, SVZ astrocytes were separated from SVZ cells according to GFAP expression. From the GFAP+ pool, we isolated SVZ NSCs (type B cells, GFAP+EGFR+CD24−) from other SVZ astrocytes (GFAP+EGFR−CD24−) on the basis of epidermal growth factor receptor (EGFR) expression. Finally, from the GFAP− cell fraction, transit-amplifying cells (type C, GFAP−EGFR+CD24−) and neuroblasts (type A, GFAP−EGFR−CD24low) were isolated. All gates were set using FMO controls (Supplementary Fig. 3). We measured various cytokines and other signaling factors using a multiplex immunoassay method in cell lysates collected from cultured type B, C and A cells, as well as other SVZ astrocytes sorted from adult mouse SVZ at 0, 14 or 30 dpi. Of the 32 factors analyzed, each neural stem or progenitor cell (NSPC) subset produced a distinct profile of signaling factors, as indicated by unbiased cluster analysis (Fig. 3b). Several factors (IL-4, IL-15, vascular endothelial growth factor (VEGF), monocyte chemotactic protein 1 (MCP-1)), including factors with potential to regulate the survival and function of NK cells, were produced in larger amounts by NSCs (type B cells).
Figure 3.
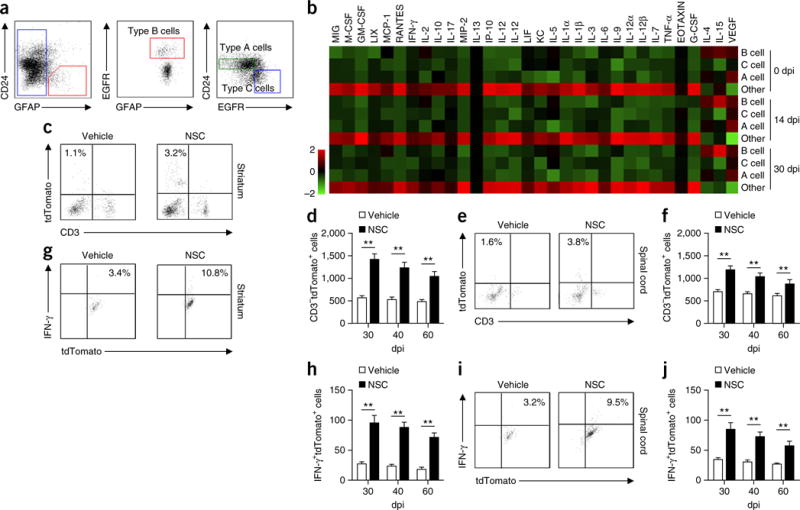
NSCs have a distinct cytokine profile during progression of brain inflammation. (a) Representative flow cytometry for sorting SVZ cell types from wild-type adult mice. SVZ astrocytes were separated on the basis of GFAP expression by SVZ cells. From the GFAP+ pool, activated stem cell astrocytes (type B NSCs; GFAP+EGFR+CD24−) were isolated from other SVZ astrocytes (GFAP+EGFR−CD24−) on the basis of EGFR expression. From the GFAP− cell fraction, transit-amplifying cells (type C, GFAP−EGFR+CD24−) and neuroblasts (type A, GFAP−EGFR−CD24low) were isolated. All gates were set using FMO controls (Supplementary Fig. 3). (b) Heat map shows the cytokine and chemokine profiles of lysates from cultured SVZ type B, C and A cells and other SVZ astrocytes after sorting from SVZ of EAE or naive control mice. Results were based on clustering of immunoassay measurements of the listed proteins. Red shades represent increased expression of proteins relative to other cell types; green shades, decreased expression. Results were from three independent experiments. In a,b, average EAE disease grade for mice used for tissue analysis at the time of tissue collection was 3.5 ± 0.7 at 14 dpi and 2.3 ± 0.5 at 30 dpi. (c) Representative flow cytometry shows that injection of cultured SVZ NSCs or vehicle into striatum of EAE mice increased NK cell counts (7 d after injection) at 30 dpi in striatum. All gates were set using FMO controls (Supplementary Fig. 1). (d) Absolute numbers of NK cells per striatum after injection of cultured SVZ NSCs into striatum of EAE mice at 30, 40, or 60 dpi. n = 8 mice per group at each time point. P < 0.001, 30 dpi; P < 0.001, 40 dpi; P = 0.003, 60 dpi. F(2,42) = 3.06, two-way ANOVA. (e) Representative flow cytometry. Injection of cultured SVZ NSCs or vehicle into spinal cord of EAE mice increased NK cell counts (7 d after injection) at 30 dpi in spinal cord. All gates were set using FMO controls (Supplementary Fig. 1). (f) Absolute numbers of NK cells per spinal cord after injection of cultured SVZ NSCs into spinal cord of EAE mice at 30, 40, or 60 dpi. n = 8 mice per group at each time point. P < 0.001, 30 dpi; P = 0.003, 40 dpi; P = 0.005, 60 dpi. F(2,42) = 2.83, two-way ANOVA. (g) Representative flow cytometry. Injection of cultured SVZ NSCs or vehicle into striatum of EAE mice (30 dpi) increased IFN-γ production by NK cells (7 d after injection) in striatum. All gates were set using FMO controls (Supplementary Fig. 1). (h) Absolute numbers of IFN-γ+ NK cells per striatum after injection of cultured SVZ NSCs into striatum of EAE mice at 30, 40, or 60 dpi. n = 8 mice per group at each time point. P < 0.001, 30 dpi; P < 0.001, 40 dpi; P = 0.001, 60 dpi. F(2,42) = 2.61, two-way ANOVA. (i) Representative flow cytometry. Injection of cultured SVZ NSCs or vehicle into the spinal cord of EAE mice (30 dpi) increased IFN-γ production by NK cells (7 d after injection) in the spinal cord. (j) Absolute numbers of IFN-γ+ NK cells per spinal cord after injection of cultured SVZ NSCs into the spinal cord of EAE mice at 30, 40, or 60 dpi. n = 8 mice per group at each time point. P < 0.001, 30 dpi; P < 0.001, 40 dpi; P = 0.002, 60 dpi. F(2,42) = 3.32, two-way ANOVA. In c–j, average EAE disease grade for mice used for tissue analysis at the time of tissue collection was 2.3 ± 0.6 (vehicle) and 2.0 ± 0.5 (NSC) in striatum, 2.3 ± 0.7 (vehicle) and 1.9 ± 0.6 (NSC) in the spinal cord at 30 dpi; 2.2 ± 0.6 (vehicle) and 1.9 ± 0.7 (NSC) in striatum, 2.3 ± 0.6 (vehicle) and 1.6 ± 0.5 (NSC) in the spinal cord at 40 dpi; 1.9 ± 0.6 (vehicle) and 1.5 ± 0.5 (NSC) in striatum, 2.0 ± 0.5 (vehicle) and 1.4 ± 0.6 (NSC) in the spinal cord at 60 dpi. Data are representative of three independent experiments. Error bars represent s.e.m.; **P < 0.01.
Focal inflammatory responses largely shape the fate of NSCs23,28. Conversely, we tested whether NSC-derived factors can influence NK cell activity and NK cell–orchestrated focal inflammatory responses. For this purpose, we stereotactically injected either mouse NSCs (sorted from EAE SVZ at 30 dpi and cultured for 72 h) or vehicle into the striatum or spinal cord, where there are relatively few NSCs as compared with the SVZ. Following NSC injection during the recovery phase of EAE, we found that injected NSCs favored NK cell (CD3−tdTomato+) accumulation in the striatum (Fig. 3c,d) and spinal cord (Fig. 3e,f), with many cells expressing IFN-γ (CD3−tdTomato+IFN-γ+) (Fig. 3g–j). Together, these data suggest that NSCs sustain accumulation of NK cells with IFN-γ production capacity in the brain during the late stages of EAE.
IL-15 produced by NSCs sustains NK cells
We next sought to identify whether there might be any specific NSC-derived immune factors involved in NK cell regulation. We focused on IL-15 because it has been shown to be critical to NK cell homeostasis and function29,30. Strikingly, we found that NSCs released abundant IL-15 relative to other CNS cells (Supplementary Fig. 4). ELISA for IL-15 from lysates of cultured SVZ cells (sorted B, C and A type cells and other astrocytes from EAE SVZ at 30 dpi) showed that NSCs produced more IL-15 than other SVZ cells (Fig. 4a). Immunostaining for IL-15 in brain sections containing SVZ revealed that IL-15 was expressed by SVZ GFAP+BrdU+ cells during recovery from EAE (Fig. 4b), and the majority of IL-15-expressing cells in SVZ were GFAP+ (Supplementary Fig. 4). These data suggest that NSCs are a major source of IL-15 during the late stages of EAE, at which time the intensity of the inflammatory responses becomes less prominent (Supplementary Fig. 2).
Figure 4.
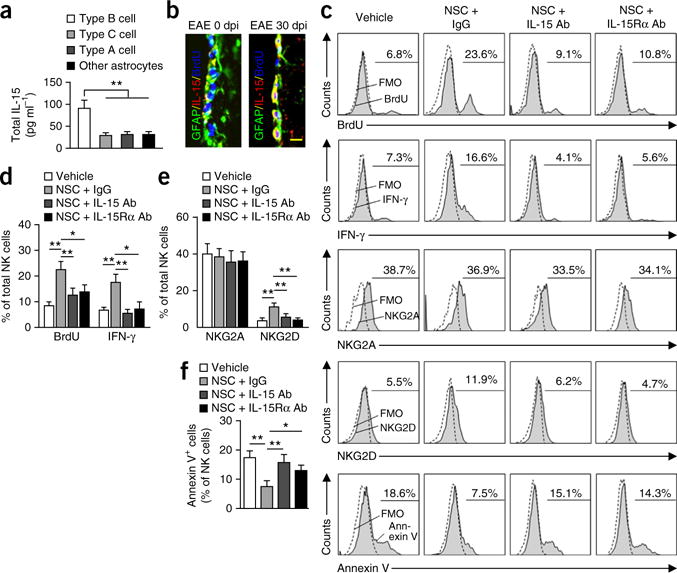
NSC-derived IL-15 is necessary to maintain NK cell proliferation, survival and IFN-γ production. (a) IL-15 ELISA from lysates of sorted SVZ NSCs. NSCs are a major source of IL-15 during the late stages of EAE (30 dpi). Average EAE disease grade for mice used for tissue analysis at the time of tissue collection was 2.2 ± 0.5 at 30 dpi. n = 12 per group. P = 0.001, type B cells versus type C; P = 0.003, type B cells versus type A; P = 0.004, type B cells versus other astrocytes. F(3,44) = 6.68, one-way ANOVA. (b) Representative immunostaining for IL-15. GFAP+ cells in SVZ of EAE mice express IL-15 at 30 dpi. Scale bar, 20 μm. Average EAE disease grade for mice used for tissue analysis at the time of tissue collection was 2.3 ± 0.6 at 30 dpi. n = 12 per group. (c) Representative flow cytometry for BrdU+, IFN-γ+, NKG2A+, NKG2D+ or annexin V+ NK cells after culture with vehicle, NSCs + immunoglobulin G (IgG) control, NSCs + IL-15 antibody, or NSCs + IL-15Rα antibody for 72 h. NSCs were sorted from 30-dpi EAE SVZ using flow cytometry. All gates were set using FMO controls. (d,e) Quantitation of NK cells cultured with NSCs for 72 h shows significant increases of BrdU+, IFN-γ+ or NKG2D+ NK cells (gated on CD3−tdTomato+ cells) as compared with vehicle-treated controls. Blockade of IL-15 or IL-15Rα with IL-15 or IL-15Rα antibody attenuates the effects of NSCs on NK cells. n = 12 per group. BrdU: P = 0.003. NSC + IgG versus vehicle; P = 0.007 (NSC + IgG versus NSC + IL-15 antibody; P = 0.02, NSC + IgG versus NSC + IL-15Rα antibody. F(3,44) = 4.62, one-way ANOVA. IFN-γ: P = 0.002, NSC + IgG versus vehicle; P = 0.006, NSC + IgG versus NSC + IL-15 antibody; P = 0.03, NSC + IgG versus NSC + IL-15Rα antibody. F(3,44) = 5.39, one-way ANOVA. NKG2D: P = 0.004, NSC + IgG versus vehicle; P = 0.007, NSC + IgG versus NSC + IL-15 mAb; P = 0.005, NSC + IgG versus NSC + IL-15Rα antibody. F(3,44) = 3.77, one-way ANOVA. (f) Blockade of IL-15 or IL-15Rα with IL-15 or IL-15Rα antibody abolishes the effects of NSCs on NK cell survival. n = 12 per group. P = 0.005, NSC + IgG versus vehicle; P = 0.008, NSC + IgG versus NSC + IL-15 antibody; P = 0.03, NSC + IgG versus NSC + IL-15Rα antibody. F(3,44) = 3.58, one-way ANOVA. In d–f, average EAE disease grade for mice used for isolation of NSCs at the time of tissue collection (30 dpi) was 2.3 ± 0.7. Results are from four individual experiments. Error bars represent s.e.m.; *P < 0.05, **P < 0.01.
Next we tested whether NSC-derived IL-15 is necessary for the effects of NSCs on NK cells. Upon coculture with NSCs (sorted type B cells from EAE SVZ at 30 dpi) for 72 h, the percentages of proliferating NK cells (CD3−tdTomato+BrdU+), IFN-γ-expressing NK cells (CD3−tdTomato+IFN-γ+) and NKG2D (CD314)-expressing NK cells (CD3−tdTomato+NKG2D+) were increased (Fig. 4c–e). Moreover, the effects of NSCs on NK cells were blocked by incubation with an IL-15-neutralizing antibody or an IL-15 receptor α (IL-15Rα)-blocking antibody (Fig. 4c–e). In addition, blockade of IL-15 or IL-15Rα abolished the effects of NSCs on NK cell survival (Fig. 4f). To further study the impact of NSC-derived IL-15 on NK cells in vivo, we generated a lentivirus construct expressing an IL-15 small hairpin RNA from the nestin (Nes) promoter (Supplementary Fig. 5a). Intraventricular injection of lenti-shIL-15 abrogated IL-15 production from nestin-expressing cells in SVZ (Supplementary Fig. 5b,c). Loss of IL-15 in these cells resulted in reduced NK cell retention, BrdU incorporation and IFN-γ expression by NK cells in SVZ during the late stage of EAE (Supplementary Fig. 5d–f). Thus, NSC-derived IL-15 sustains NK cells in the SVZ.
The surface-bound form of IL-15 is responsible for cellular signaling to neighboring cells29–31. To determine whether NSCs are a relevant source of surface-bound IL-15, we evaluated the presence of surface IL-15 on NSCs by flow cytometry. Increased surface expression of IL-15 by NSCs was observed during the peak phase of EAE. Such an increase was also found throughout the late stages of EAE (Fig. 5a,b).
Figure 5.
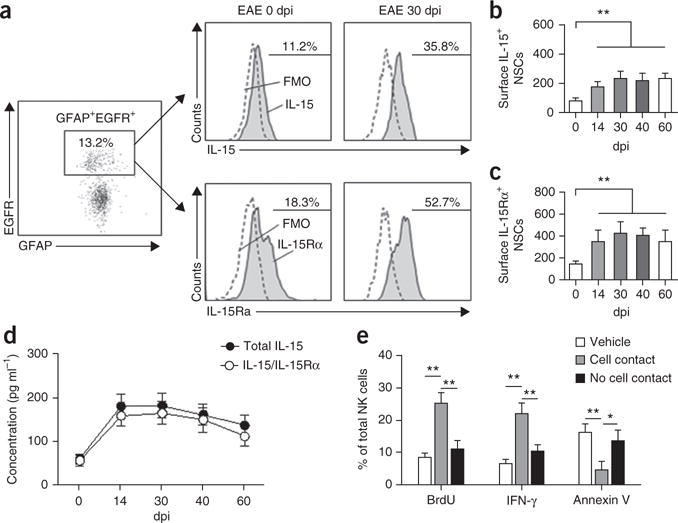
Coordinated upregulation of IL-15 and IL-15Rα in NSCs during progression of brain inflammation. (a) Representative flow cytometry shows increased IL-15+ and IL-15Rα+ NSCs (GFAP+EGFR+) in EAE SVZ at 30 dpi. All gates were set using FMO controls. (b) Changes of surface IL-15 expression by GFAP+EGFR+ cells isolated from EAE SVZ (0–60 dpi). n = 12 per group. P = 0.005, 0 dpi versus 14 dpi; P = 0.002, 0 dpi versus 30 dpi; P = 0.003, 0 dpi versus 40 dpi; P = 0.003, 0 dpi versus 60 dpi. F(4,55) = 15.36, one-way ANOVA. (c) Changes of surface IL-15Rα in GFAP+EGFR+ cells isolated from EAE SVZ at 0–60 dpi. n = 12 per group. P = 0.003, 0 dpi versus 14 dpi; P = 0.001, 0 dpi versus 30 dpi; P = 0.002, 0 dpi versus 40 dpi; P = 0.002, 0 dpi versus 60 dpi. F(4,55) = 16.03, one-way ANOVA. In b,c, average EAE disease grade for mice used for tissue analysis at the time of tissue collection was 3.3 ± 0.9 at 14 dpi, 2.5 ± 0.7 at 30 dpi, 2.2 ± 0.9 at 40 dpi and 1.9 ± 0.6 at 60 dpi. Absolute numbers of cells per SVZ are shown. (d) ELISA of total IL-15 and heteromeric IL-15/IL-15Rα complexes in lysates of cultured flow cytometry–sorted NSCs from EAE SVZ at 0–60 dpi. n = 9 per group at each time point. Average EAE disease grade for mice used for tissue analysis at the time of tissue collection was 3.1 ± 0.6 at 14 dpi, 2.2 ± 0.8 at 30 dpi, 1.8 ± 0.6 at 40 dpi and 1.5 ± 0.7 at 60 dpi. (e) BrdU+, IFN-γ+ or annexin V+ NK cells were counted by flow cytometry in cultures of NK cells with flow cytometry–sorted NSCs from 30-dpi EAE SVZ in the same well (with cell contact) or spatially separated (without cell contact) by a membrane (0.4-μm pores). Average EAE disease grade for mice used for NSC collection was 2.3 ± 0.6 at 30 dpi. All gates were set using FMO controls (Supplementary Fig. 6). n = 9 per group. BrdU: P = 0.001, cell contact versus vehicle; P = 0.003, contact versus no contact. F(2,24) = 5.26, one-way ANOVA. IFN-γ: P = 0.001, cell contact versus vehicle; P = 0.005, contact versus no contact. F(2,24) = 5.37, one-way ANOVA. Annexin V: P = 0.008, contact versus vehicle; P = 0.02, contact versus no contact. F(2,24) = 3.86, one-way ANOVA. Results (b–e) are from three independent experiments. Error bars represent s.e.m.; *P < 0.05; **P < 0.01.
Previous findings have indicated that both IL-15 and IL-15Rα need to be expressed by the same cell for trans-presentation of IL-15 (refs. 29–31). Thus, we sought to investigate whether IL-15Rα was upregulated and affected functional IL-15 production by NSCs during EAE. IL-15Rα surface expression by NSCs increased during EAE progression (Fig. 5a,c). Further, ELISA of cell lysates from sorted NSCs (dpi 0–60) suggested that most IL-15 was chaperoned by IL-15Rα (Fig. 5d). Together, these data suggested that IL-15 and IL-15Rα are coordinately expressed and upregulated in NSCs during EAE progression.
Finally, to determine whether NSCs provide IL-15 in trans to target NK cells, we cultured NSCs with NK cells in Transwell plates. In agreement with recent evidence on the role of surface-bound IL-15 (refs. 29–31), we observed a cell-cell contact–dependent maintenance of NK cell proliferation, function and survival in vitro supported by NSCs (Fig. 5e). All gates were set using FMO controls (Supplementary Fig. 6). Thus, membrane-bound IL-15 trans-presented by IL-15Rα maintains NK cell homeostasis and function.
Mechanisms of increased IL-15 trans-presentation by NSCs
Since IL-15Rα is essential for the trans-presentation of IL-15, its surface upregulation on NSCs during EAE may influence the capacity of NSCs to modulate NK cell function. To study the mechanisms of IL-15Rα upregulation, we analyzed mRNA expression of Il15ra (encoding IL-15Rα) in SVZ NSCs during EAE. Although Il15ra mRNA levels remained unaltered over the course of the disease (Fig. 6a), an elevation in surface IL-15Rα protein was observed on NSCs from mice with EAE (sorted from EAE SVZ and cultured for 48 h, 30 dpi; Fig. 6b,c).
Figure 6.
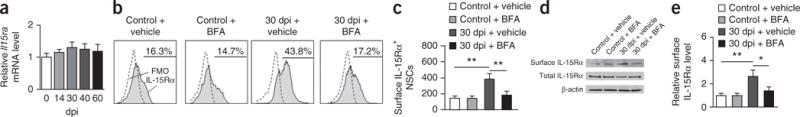
IL-15Rα upregulation in NSCs during the late stages of brain inflammation. (a) Real-time PCR shows IL-15Rα mRNA levels in NSCs obtained from EAE SVZ (0–60 dpi) as compared with those from naive controls. Data in each group were internally normalized to Gapdh mRNA levels. n = 9 per group. Average EAE disease grade for mice used for tissue analysis at the time of tissue collection was 3.6 ± 0.9 at 14 dpi, 2.6 ± 0.7 at 30 dpi, 2.5 ± 0.9 at 40 dpi and 2.2 ± 0.8 at 60 dpi. (b) Flow cytometry plots of NSCs isolated from SVZ of EAE mice (30 dpi) or naive controls. In vivo treatment with BFA inhibited EAE-induced increases of surface IL-15Rα+ NSCs. All gates were set using FMO controls. (c) Effects of BFA on the number of surface IL-15Rα+ NSCs obtained from EAE or control SVZ treated as indicated. Absolute numbers of cells per SVZ are shown. Average EAE disease grade for mice used for tissue analysis at the time of tissue collection was 2.6 ± 0.6 (vehicle) and 1.8 ± 0.5 (BFA) at 30 dpi. n = 9 per group. P = 0.003, 30 dpi + vehicle versus control + vehicle; P = 0.005, 30 dpi + vehicle versus 30 dpi + BFA. F(3,32) = 3.68, one-way ANOVA. (d) Immunoblotting show the expression of surface or total IL-15Rα protein in NSCs isolated from SVZ of EAE mice (30 dpi) or naive controls. Full-length blots are presented in Supplementary Figure 7. (e) Effects of BFA on surface IL-15Rα protein levels in NSCs from EAE SVZ treated as indicated. Average EAE disease grade for mice used for tissue analysis at the time of tissue collection was 2.5 ± 0.5 (vehicle) and 1.9 ± 0.6 (BFA) at 30 dpi. n = 9 per group. P = 0.005, 30 dpi + vehicle versus control + vehicle; P = 0.02, 30 dpi + vehicle versus 30 dpi + BFA. F(3,32) = 3.36, one-way ANOVA. Results (a–e) are representative of three independent experiments. Error bars represent s.e.m.; *P < 0.05; **P < 0.01.
To provide further support for this finding, we inhibited protein trafficking and monitored changes in the surface expression of IL-15Rα using brefeldin A (BFA), which blocks protein transport from the endoplasmic reticulum to the Golgi32,33. Exposure of NSCs to BFA in vivo prevented the increases in number of IL-15Rα+ NSCs (Fig. 6b,c) and surface IL-15Rα expression (Fig. 6d,e and Supplementary Fig. 7). These data suggest that increased trafficking of IL-15Rα to the cell surface in NSCs during EAE may contribute to increased IL-15 trans-presentation.
Elimination of NK cells promotes NSC proliferation
Recent studies have shown reduced proliferation of SVZ NSCs during late stages of EAE18,20. To investigate the possible role of infiltrating NK cells in this phenomenon, we used an anti-NK1.1 monoclonal antibody (mAb) (PK136) to deplete NK cells during EAE12,26,34 and examined NSC proliferation with a BrdU retention protocol (Fig. 7a and refs. 35,36). In mice treated with anti-NK1.1 mAb (14 dpi), we observed an increase in the numbers of BrdU+ cells in SVZ of NKT cell– deficient Cd1d−/− mice during the late stages of EAE (30, 40, 60 dpi) but not at the peak phase of disease (Fig. 7c,d). Quantification of GFAP+BrdU+ cells confirmed an increase in the frequency of GFAP+BrdU+ NSCs during the late stages of EAE in mice treated with NK1.1 mAb (Supplementary Fig. 8a–c). In addition, GFAP+caspase-3+ cells were also reduced (Supplementary Fig. 8d,e).
Figure 7.
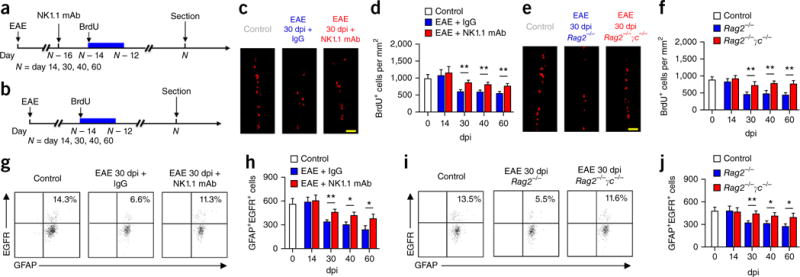
NK cells eliminate NSCs during the late stages of brain inflammation. (a) Protocol for BrdU injection and NK cell depletion in Cd1d−/− mice. (b) Protocol for BrdU injection in Rag2−/− and Rag2−/−γc−/− mice. (c) Representative images show increased numbers of BrdU+ cells in EAE SVZ (30 dpi) of Cd1d−/− mice treated with anti-NK1.1 mAb as compared to mice injected with isotype control IgG. Control, 0 dpi. Scale bar, 40 μm. (d) Significantly increased BrdU+ cells in Cd1d−/− EAE mice treated with anti-NK1.1 mAb during the late stages of EAE (30–60 dpi) as compared to mice injected with IgG, but not during the peak phase (14 dpi). Control, 0 dpi. Results show positive cells per mm2 of SVZ. n = 12 mice per group at each time point. Average EAE disease grade for mice used for tissue analysis at the time of tissue collection was 3.2 ± 0.5 (IgG) and 3.8 ± 0.6 (NK1.1 mAb) at 14 dpi, 2.5 ± 0.6 (IgG) and 1.7 ± 0.5 (NK1.1 mAb) at 30 dpi, 2.3 ± 0.8 (IgG) and 1.4 ± 0.5 (NK1.1 mAb) at 40 dpi and 2.2 ± 0.6 (IgG) and 1.3 ± 0.7 (NK1.1 mAb) at 60 dpi. n = 12 mice per group at each time point. P = 0.005, 30 dpi; P = 0.007, 40 dpi; P = 0.008, 60 dpi. F(3,88) = 3.33, two-way ANOVA. (e) Representative images show more BrdU+ cells in 30-dpi EAE SVZ of Rag2−/−γc−/− mice than Rag2−/− mice. Control, 0 dpi. Scale bar, 40 μm. (f) Significantly increased BrdU+ cells in Rag2−/−γc−/− EAE mice during the late stages of EAE (30–60 dpi) as compared with numbers in Rag2−/− mice, but not during the peak phase (14 dpi). Average EAE disease grade for mice used for tissue analysis at the time of tissue collection was 3.1 ± 0.8 (Rag2−/−) and 3.3 ± 0.7 (Rag2−/−γc−/−) at 14 dpi, 2.6 ± 0.7 (Rag2−/−) and 1.7 ± 0.6 (Rag2−/−γc−/−) at 30 dpi, 2.5 ± 0.7 (Rag2−/−) and 1.6 ± 0.6 (Rag2−/−γc−/−) at 40 dpi and 2.3 ± 0.6 (Rag2−/−) and 1.3 ± 0.5 (Rag2−/−γc−/−) at 60 dpi. Results are presented as positive cells per mm2 of SVZ. n = 12 mice per group at each time point. Control, 0 dpi. P = 0.006, 30 dpi; P = 0.005, 40 dpi; P = 0.003, 60 dpi. F(3,88) = 4.64, two-way ANOVA. (g) Flow cytometry. Counts of SVZ NSCs (GFAP+EGFR+) are increased in wild-type EAE mice 30 dpi treated with anti-NK1.1 mAb. All gates were set using FMO controls (Supplementary Fig. 3). Control, 0 dpi. (h) Counts of SVZ NSCs were increased in wild-type EAE mice 30–60 dpi treated with anti-NK1.1 mAb. Absolute numbers of cells per SVZ are shown. Control, 0 dpi. Average EAE disease grade for mice used for tissue analysis at the time of tissue collection was 3.1 ± 0.6 (IgG) and 3.7 ± 0.8 (NK1.1 mAb) at 14 dpi, 2.3 ± 0.7 (IgG) and 1.6 ± 0.6 (NK1.1 mAb) at 30 dpi, 2.3 ± 0.5 (IgG) and 1.5 ± 0.6 (NK1.1 mAb) at 40 dpi and 2.2 ± 0.5 (IgG) and 1.3 ± 0.5 (NK1.1 mAb) at 60 dpi. n = 12 mice per group at each time point. P = 0.005, 30 dpi; P = 0.02, 40 dpi; P = 0.03, 60 dpi. F(3,88) = 3.39, two-way ANOVA. (i) Flow cytometry shows more NSCs in EAE SVZ (30 dpi) of Rag2−/−γc−/− mice than Rag2−/− mice. All gates were set using FMO controls (Supplementary Fig. 3). (j) There were significantly more NSCs in Rag2−/−γc−/− than in Rag2−/− EAE mice during the late stages of EAE (30–60 dpi), but not during the peak phase (14 dpi). Absolute numbers of cells per SVZ are shown. Average EAE disease grade for mice used for tissue analysis at the time of tissue collection was 3.0 ± 0.6 (Rag2−/−) and 3.2 ± 0.5 (Rag2−/−γc−/−) at 14 dpi, 2.5 ± 0.7 (Rag2−/−) and 1.6 ± 0.5 (Rag2−/−γc−/−) at 30 dpi, 2.3 ± 0.6 (Rag2−/−) and 1.5 ± 0.5 (Rag2−/−γc−/−) at 40 dpi and 2.2 ± 0.7 (Rag2−/−) and 1.3 ± 0.5 (Rag2−/−γc−/−) at 60 dpi. n = 12 mice per group at each time point. P = 0.007, 30 dpi; P = 0.03, 40 dpi; P = 0.02, 60 dpi. F(3,88) = 3.53, two-way ANOVA. Results (c–j) are representative of three independent experiments. Error bars represent s.e.m.; *P < 0.05; **P < 0.01.
These results indicate that SVZ-infiltrating NK cells reduce the proliferation and number of NSCs during EAE, particularly during the late stages of EAE. To provide further support for this conclusion, we counted fresh NSCs from SVZ of EAE mice by flow cytometry. A dramatic reduction in the number of NSCs was found during the late stages of EAE (30, 40 and 60 dpi, Fig. 7g,h). Further, depletion of NK cells increased the number of SVZ NSCs (30, 40 and 60 dpi; Fig. 7g,h), suggesting that depletion of NK cells during EAE recovery promotes NSC survival. To investigate the possibility that the effects of NK cells on NSCs are indirect and depend on other cell types such as T cells, NKT cells or B cells, we adoptively transferred encephalitogenic 2D2 Cd1d−/− T cells into Rag2−/− mice (devoid of T, NKT and B cells) and Rag2−/−γc−/− (Rag2−/−Il2rg−/−) mice (devoid of T, NKT, B and NK cells). 2D2 T cells were collected from MOG35–55 peptide– specific TCR transgenic mice deficient in CD1d (2D2 Cd1d−/−), used for the exclusion of NKT cells. BrdU was injected to track NSC proliferation during EAE progression (Fig. 7b). We found that BrdU incorporation was higher in SVZ of Rag2−/−γc−/− mice than in Rag2−/− mice (Fig. 7e,f), confirming that the effects of NK cells on SVZ NSCs during EAE are independent of T, NKT and B cells. In further support of this conclusion, quantitation of SVZ NSCs obtained from Rag2−/− and Rag2−/−γc−/− mice during EAE showed reduced numbers of NSCs in Rag2−/− mice during EAE recovery (Fig. 7i,j). Furthermore, depletion of NK cells during EAE recovery did not affect the rapidly proliferating progenitors (type C and type A cells) (Supplementary Fig. 8g,h). However, antibody-mediated (anti-NK1.1 mAb) or genetic (Rag2−/− γc−/−) depletion of NK cells before EAE initiation promoted proliferation of SVZ progenitors, including NSCs (type B cells), during the late stages of EAE (Supplementary Fig. 9). In summary, these data indicate that NK cells inhibit NSCs in a T- and B-cell-independent manner during late stages of EAE.
NK cells target SVZ type B cells with ‘altered self’
To explore the possibility that NK cells may eliminate SVZ NSCs during EAE, sorted SVZ NSCs (GFAP+EGFR+CD24−) from EAE mice at 30 dpi were cultured for 24 h with NK cells. We found that NSCs obtained during the peak phase of EAE were more resistant to NK cell cytotoxicity than those obtained during the late stages of EAE (Supplementary Fig. 10a).
NK cells employ perforin and granzyme B to lyse cells, which is associated with an influx of intracellular Ca2+. We therefore used the Ca2+ chelator Fura-2 AM to analyze intracellular Ca2+ dynamics of cultured NSCs (sorted from EAE SVZ at 30 dpi) after exposure to activated NK cells in vitro. Under control conditions (no NK cell treatment), constant intracellular Ca2+ concentrations (ratio of 340 nm to 380 nm emissions in the selected region of interest) were observed over 15 min in NSCs from naive controls. As a positive control, we used the Ca2+ pore-forming agent ionomycin37, which induced a strong Ca2+ influx (Supplementary Fig. 10b–d). Treatment with activated NK cells at a ratio of 10:1 increased intracellular Ca2+ concentration in NSCs from EAE 30 dpi mice (Supplementary Fig. 10c,d) but not in NSCs from EAE 14 dpi mice, indicating that NK cells can lyse NSCs during the late stages of EAE.
Finally, to test whether NK cell–mediated inhibition of NSCs was associated with altered intrinsic proliferation of NSCs, NK cells were cultured with NSCs isolated from EAE mice (30 dpi). Cell proliferation was determined by additional BrdU incorporation in vitro and co-labeling with GFAP. An increase in caspase-3+GFAP+ cells was observed in the presence of NK cells (Supplementary Fig. 10e), but the relative numbers of BrdU+GFAP+ cells cultured with NK cells remained unaltered (Supplementary Fig. 10f), suggesting that NK cells had no substantial influence on the proliferation of NSCs. Thus, the capacity of NK cells to suppress BrdU incorporation in NSCs is due mainly to direct cytotoxic effects of NK cells against SVZ cells.
Effects on immune tolerance
To investigate the mechanisms governing the differential susceptibility to NK cell–mediated cytotoxicity during the peak versus late stages of EAE exhibited by NSCs, we first characterized and compared the expression of different MHC class I molecules (H2-K, H2-D, RAE-1, CD1d, Qa1, MULT-1, H2-M3 and H60) on SVZ NSPCs freshly dissociated from EAE mice and controls. SVZ type B, C and A cells constitutively expressed MHC class I molecules that can either inhibit or activate NK cells (Fig. 8a). We performed the same analyses at 14 and 30 dpi (peak versus late stages of EAE) and observed dynamic changes in the expression of inhibitory NK cell receptor NKG2A (CD94) ligands such as Qa1 during EAE progression (Fig. 8a). Expression of Qa1 by NSCs was first increased during the peak of EAE disease (14 dpi) and then diminished during the late stages (30, 40, 60 dpi) (Fig. 8b,c), whereas expression of NKG2D ligands such as RAE-1 and MULT-1 was not affected (Fig. 8c).
Figure 8.
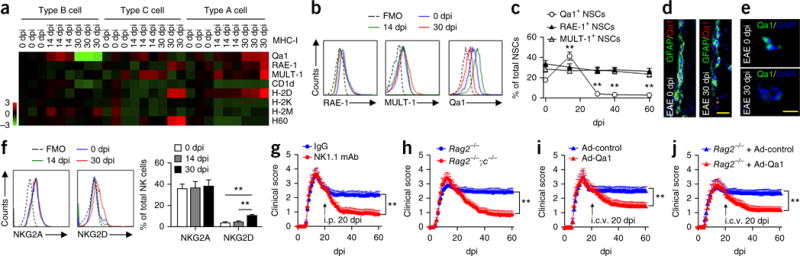
Altered expression of MHC class I molecules in NSPCs and effects of NK cell removal on EAE. (a) Heat map shows the expression profiles of MHC class I molecules in type B, C and A cells isolated from the SVZ of wild-type EAE mice at 0, 14, and 30 dpi. Expression of MHC class I molecules was measured by flow cytometry. Heat map was generated by normalizing the percentages of SVZ type B, C and A cells that express MHC class I molecules at 0, 14 or 30 dpi to those of naive controls. Red shades represent increased expression of proteins relative to naive controls; green shades, decreased. n = 6 mice per data plot. (b) Representative flow cytometry for Qa1+, RAE-1+ or MULT-1+ NSCs (type B cells) from SVZ of control and EAE mice at 0, 14 and 30 dpi. All gates were set using FMO controls. (c) Quantitation of Qa1+ NSCs shows reduced expression of Qa1, but not RAE-1 or MULT-1, in NSCs from EAE mice at 30, 40 and 60 dpi. n = 6 mice per data plot. P < 0.001, 14 dpi versus 0 dpi; P < 0.001, 30 dpi versus 0 dpi; P < 0.001, 40 dpi versus 0 dpi; P < 0.001, 60 dpi versus 0 dpi. F(4,25) = 33.74, one-way ANOVA. In a–c, average EAE disease grade for mice used for tissue analysis at the time of tissue collection was 3.6 ± 1.0 at 14 dpi, 2.7 ± 0.9 at 30 dpi, 2.6 ± 0.7 at 40 dpi and 2.5 ± 0.6 at 60 dpi. (d) Qa1+GFAP+ (yellow) cells in control and EAE SVZ sections 30 dpi. Scale bar, 20 μm. (e) Immunofluorescence for Qa1 in sorted NSCs isolated from control and EAE SVZ 30 dpi. Scale bar, 20 μm. (f) Left, flow cytometry expression of NKG2A and NKG2D on NK cells isolated from SVZ at 14 or 30 dpi and spleen at 0 dpi. All gates were set using FMO controls. Right, expression 14, 30, 40 and 60 dpi. n = 6 mice per group. P = 0.001, 30 dpi versus 0 dpi; P = 0.003, 30 dpi versus 14 dpi. F(2,15) = 8.62, one-way ANOVA. In f, average EAE disease grade for mice used for tissue analysis at the time of tissue collection was 3.2 ± 0.8 at 14 dpi, 2.6 ± 0.8 at 30 dpi, 2.5 ± 0.9 at 40 dpi and 2.3 ± 0.8 at 60 dpi. Results in a–f are from three individual experiments. (g) Effects of NK cell depletion with anti-NK1.1 mAb on the recovery of EAE in Cd1d−/− mice. n = 15 mice per group. P < 0.001, F(1,1708) = 173.3, two-way ANOVA. (h) Absence of NK cells improves EAE outcome during the late stages of EAE. Rag2−/− and Rag2−/−γc−/− mice were injected with 5 × 10⁶ 2D2 T cells on day 0. Rag2−/−γc−/− mice exhibited faster recovery starting 25 d after transfer of 2D2 T cells. n = 15 mice per group. P < 0.001, F(1,1708) = 192.7, two-way ANOVA. (i) Overexpression of Qa1 by intracerebroventricular (i.c.v.) injection (20 dpi) of an adenovirus (Ad) encoding Qa1 promotes EAE recovery in Cd1d−/− mice. n = 15 mice per group. P < 0.001, F(1,1708) = 95.42, two-way ANOVA. (j) Overexpression of Qa1 by intraventricular injection (20 d after 2D2 T cell transfer) of an adenovirus encoding Qa1 promotes EAE recovery in Rag2−/− mice. n = 15 mice per group. P < 0.001, F(1,1708) = 88.5, two-way ANOVA. Data shown in g–j were obtained from three independent experiments. Error bars represent s.e.m.; **P < 0.01.
We profiled the expression of Qa1 by SVZ type B cells (sorted from EAE SVZ at 30 dpi and cultured for 24 h) and found that expression of Qa1 (the ligand for NKG2A) was reduced on GFAP+ cells (including type B cells) in SVZ sections (568 ± 93 cells per mm2 at 0 dpi versus 220 ± 64 per mm2 at 30 dpi, t(14) = 3.08, P < 0.01, n = 8 mice per group; average EAE disease grade for mice used for tissue analysis at the time of tissue collection, 2.6 ± 0.7 at 30 dpi; Fig. 8d) and in sorted NSCs (155 ± 10 cells per SVZ at 0 dpi versus 17 ± 12 cells per SVZ at 30 dpi, t(14) = 8.84, P < 0.001, n = 8 mice per group; average EAE disease grade for mice used for tissue analysis at the time of tissue collection, 2.3 ± 0.5 at 30 dpi; Fig. 8e). Neither expression of NKG2A on NK cells obtained from EAE SVZ (peak versus late stages; Fig. 8f) nor other inhibitory receptors on NK cells, including Ly49D, Ly49A and Ly49C, was changed during EAE (data not shown). Thus, a loss of tolerance against NSCs may lead to their increased elimination by NK cells during EAE recovery.
Removal of NK cells facilitates recovery
Having found that NK cells modulate NSC activity, we reasoned that manipulation of NK cells during the late stages of EAE might have a different outcome as compared with manipulation of these cells during the initiation phase of EAE. To this aim, we used two experimental approaches. First, we depleted NK cells with anti-NK1.1 mAb in EAE mice starting at 20 dpi (before the late stages). Removal of NK cells facilitated the recovery from neurological deficits (Fig. 8g). In the second approach, we induced EAE in Rag2−/− and NK cell–deficient Rag2−/−γc−/− mice by intravenous transfer of 2D2 MOG peptide–specific T cells. During the late stages, reduced neurological deficits were observed in Rag2−/−γc−/− mice than in Rag2−/− mice (Fig. 8h). This suggests that NK cells hinder EAE recovery independently of T, NKT and B cells.
The effects of NK cells on EAE recovery correlated with increased SVZ proliferation in vivo (Supplementary Fig. 9). To investigate the role of NSCs, we constructed an adenoviral vector to overexpress Qa1 in SVZ cells (Supplementary Fig. 11). After intraventricular injection of the Qa1-encoding adenovirus at 20 dpi, in vivo tolerance of NK cells to NSCs was restored (Supplementary Fig. 12), with a subsequent facilitation of EAE recovery (Fig. 8i,j). Consistent with the improvement in the number of NSCs, we found an increase in the number of proliferating NG2+ oligodendrocyte precursors and subsequently more mature oligodendrocytes expressing 2′,3′-cyclic nucleotide 3′-phosphodiesterase as compared with that in phosphate-buffered saline–treated animals (Supplementary Figs. 13 and 14). These results suggest the possibility that NK cells impair EAE recovery by inhibiting NSCs. Of note, NG2+ oligodendrocyte precursors expressing Qa1 were relatively resistant to NK cell lysis (Supplementary Fig. 15). In addition, NSC-derived IL-15 had no prominent effect on proliferation and differentiation of NG2+ oligodendrocyte precursors (Supplementary Fig. 15). These data suggest that better recovery from EAE after elimination of NK cells may not be due to direct effects of NK cells or NSCs on oligodendrocyte precursors. Altogether, our findings indicate that removal of NK cells facilitates recovery from neurological deficits following brain inflammation.
DISCUSSION
In contrast to the traditionally held view that, following their initial expansion, NK cells enter a contraction phase once local inflammation decreases3,4,9,10, we found that NK cells were maintained by NSCs within the SVZ during the chronic phase of MS and in mice during the late stages of EAE. In both circumstances, the magnitude of inflammatory and autoimmune responses was suppressed while NK cells were retained within the CNS. Although lacking conventional signals that drive NK cells, NSCs provided IL-15 in trans to NK cells, which was both necessary and sufficient to support functionally competent NK cells. Thus, the brain microenvironment, which includes NSCs, is unique in supporting NK cell homeostasis.
The finding that NK cells preferentially accumulated in the SVZ compared with adjacent areas such as the striatum strongly suggested that factor(s) predominantly derived from the SVZ bridge interactions between NK cells and cells of the SVZ. In line with previous findings that IL-15/IL-15Rα complexes are critical for NK cell survival and function29,31,38,39, we observed that NSC-derived IL-15/IL-15Rα complexes were necessary and sufficient for the observed NSC-mediated effects on NK cell homeostasis, although additional mediators may be involved. Surface increases in the expression of IL-15 on NSCs during EAE enhanced expression of this cytokine in the SVZ, both during the peak and late stages of EAE, indicating that this cytokine is upregulated for extended periods of time during EAE. SVZ NSCs were identified as a major source of IL-15 during EAE, although other SVZ cells such as astrocytes might serve as an additional source.
NSC-derived IL-15 was mostly present in a heteromeric form as IL-15/IL-15Rα complexes. The coordinated upregulation of surface IL-15 and IL-15Rα during EAE supported the possible requirement of IL-15Rα for IL-15 elaboration. Sensitivity to BFA of cell surface IL-15Rα expression indicated that the process had a post-translational basis, likely involving changes in protein trafficking upon enhanced transit of IL-15Rα from the endoplasmic reticulum to the Golgi apparatus. Additionally, Transwell culture studies indicated that the IL-15-dependent maintenance of NK cell proliferation, function and survival by NSCs was cell contact dependent.
The physical proximity of NK cells to NSCs in the SVZ region during chronic stages of brain inflammation, as manifested with EAE in the present studies, has significant clinical implications. Recent studies reported reduced proliferation of NSCs during EAE18,20,40,41, suggesting impaired tissue repair capacity during EAE recovery. Indeed, we found reduced SVZ proliferation and decreased numbers of slowly dividing type B (GFAP+BrdU+) cells in the SVZ of EAE mice. Notably, we found that infiltrating NK cells directly eliminated SVZ NSCs through a mechanism that involved loss of immune tolerance. Self-tolerance of NK cells is mainly controlled by MHC class I molecules expressed on target cells. Expression of MHC class I molecules on NSCs was dynamically altered during the course of brain inflammation. We found that NK cells remained tolerant to SVZ NSCs during the peak phase of EAE, with increased expression of Qa1. In contrast, tolerance to NSCs was ablated during the late stages (30–60 dpi) owing to downregulation of Qa1. Therefore, the differential role played by NK cells during different phases of EAE may critically depend on dynamic alterations in their tolerance to NSCs and may involve Qa1, a ligand of the inhibitory NK cell receptor NKG2A. Under such circumstances, NK cells eliminate SVZ NSCs and impede neurorepair mechanisms during the late stages of EAE. As a consequence of the cellular interactions between NSCs and NK cells, restoration of NK cell tolerance or NK cell depletion promotes oligodendrogenesis and recovery from immune-mediated damage to myelin sheaths. Of note, although being arbitrary, the EAE scoring system is largely based on spinal cord deficits because quantification of symptoms derived from brain damage is challenging. However, results from brain pathology and neuroimaging can supply more accurate assessments of the stage of disease.
Our findings advance the understanding of the role of NK cells in the progression and recovery from brain inflammation. Because interactions between NSCs and NK cells may hinder the reparative efficacy of NSCs, disruption of these interactions might facilitate regenerative processes during neurological inflammatory disorders.
METHODS
Methods and any associated references are available in the online version of the paper.
ONLINE METHODS
Human brain sections
Human brain sections were acquired from Sun Health Research Institute (Sun City, AZ). Among the 11 brains studied, 6 were from relapsing-remitting MS patients who died during MS clinical remission. The other 5 were from individuals who died from non-neurological diseases; these were used as controls. The subjects without neurological disease enrolled in the study had no past history of neurological or neuropsychiatric diseases; this was confirmed by histopathological examination. MS patients and control subjects did not differ significantly for mean age at death (MS patients, 71.8 + 6.3 y; controls, 81.8 + 5.6 y, mean ± s. e. m.; P > 0.05, unpaired t-test). Brain tissues were collected within 4 h after death.
Mice
Female C57BL/6 (B6, H-2b), Rag2−/− and Rag2−/−γc−/− mice were purchased from Taconic (Santa Maria, CA). Cd1d−/− and UBC-GFP mice were purchased from The Jackson Laboratory (Sacramento, CA). 2D2-TCR transgenic mice42 and NK1.1-tdTomato mice were kindly provided by V. Kuchroo (Brigham and Women’s Hospital and Harvard Medical School, Boston, MA) and W. Yokoyama (Washington University, St. Louis, MO), respectively. 2D2 Cd1d−/− mice were generated by crossing 2D2 and Cd1d−/− mice. NK1.1-tdTomato Cd1d−/− mice were generated by crossing NK1.1-tdTomato and Cd1d−/− mice. All mutant mice were backcrossed to the B6 background for 8–12 generations and were housed in pathogen-free conditions at the animal facilities of the Barrow Neurological Institute (Phoenix, AZ) or at the Tianjin Neurological Institute (Tianjin, China). For all experiments, 6- to 12-week-old, age-matched female littermates were used between experimental groups. All mice were randomly assigned to each experiment. All mice were housed no more than 5 animals per cage under standardized light-dark cycle conditions with access to food and water ad libitum. All animal studies were approved by the Animal Care and Use Committees of the Barrow- St. Joseph or Tianjin Neurological Institute.
EAE induction, in vivo antibody administration and drug treatment
To induce EAE, C57BL/6 wild-type, NK1.1-tdTomato or Cd1d−/− mice were injected subcutaneously in the hind flank with 200 μg of MOG35−55 peptide in complete Freund’s adjuvant (Difco, Detroit, MI) containing 500 μg of nonviable, desiccated Mycobacterium tuberculosis. On the day of and 2 d after immunization, the mice were inoculated with 200 ng of pertussis toxin (List Biologic, Campbell, CA) intra-peritoneally (i.p.). For adoptive transfer of EAE with 2D2 T cells, splenocytes were isolated from MOG TCR transgenic (2D2) Cd1d−/− mice (devoid of NKT cells). After removal of red blood cells by lysis with ammonium chloride, T cells were collected using the Pan T Cell Isolation Kit (Miltenyi Biotec, San Diego, CA) and suspended in RPMI medium containing 1% l-glutamine, 1% FCS and penicillin/streptomycin (1:100 dilution; 516106, Millipore, Billerica, MA). 2D2 Cd1d−/− T cells were stimulated with 10 μg ml−1 MOG35−55 peptide for 48 h and then expanded in 5 ng ml−1 IL-2 and IL-7 for 5 d. Lymphoblasts were stimulated with 1 μg ml−1 of plate-bound anti-CD3 and 1 μg ml−1 of anti-CD28 in the presence of 10 ng ml−1 IL-12 and 25 ng ml−1 IL-18 for 24 h. 2D2 T cells (2 × 10⁵–106) were transferred into each recipient Rag2−/− or Rag2−/−γc−/− mouse. For both actively and passively induced EAE, mice were monitored daily for neural deficiency on an arbitrary scale of 0 to 5 with 0.5 increments, as previously described12,14. The assessment of clinical scores was performed in a double-blinded manner.
mAbs to mouse NK1.1 (PK136) were produced from hybridomas (American Type Culture Collection, Manassas, VA). Mouse IgG2a (Sigma-Aldrich, St. Louis, MO) was used as isotype control antibody. For depletion of NK1.1+ cells in vivo, 50 μg of anti-NK1.1 mAb was injected i.p. into each mouse at the indicated time points and every 5 d thereafter until termination of experiments12,34. Depletion of NK1.1+ cells was confirmed by flow cytometry and was consistently >90% (refs. 12,34).
BFA (B6542, Sigma-Aldrich) was prepared in DMSO (20 mg ml−1 stock) and further diluted to 0.5 mg ml−1 in PBS. 200 μl BFA or vehicle PBS was injected intravenously daily into EAE or naive control mice starting from day 0. After the last injection of BFA or PBS, SVZ tissues were collected from EAE mice (30 dpi) or controls for flow cytometry or immunoprecipitation analyses.
Bromodeoxyuridine (BrdU) labeling and immunostaining
For short-term labeling, mice received i.p. injections of 120 mg kg−1 BrdU in PBS every 2 h for 10 h and were sacrificed 2 h after the last injection. For long-term labeling, mice were injected i.p. with 150 mg kg−1 twice per day for 2 d and perfused 2 weeks later (14 d washout time) for the identification of long-term proliferative responses (BrdU retention)35,36. To determine the generation of oligodendrocyte progenitors, mice were given i.p. injections of 120 mg kg−1 BrdU in PBS every 2 h for 10 h and were sacrificed 1 week after the last injection (7 d washout time). For determination of differentiation into oligodendrocytes, mice were injected i.p. with 150 mg kg−1 BrdU twice per day for 2 d and were killed 2 weeks after the last injection (14 d washout time).
Brains were perfusion-fixed with 4% paraformaldehyde, followed by overnight postfixation in the same fixative at 4 °C. Sections (30 μm) were prepared on the next day using a vibratome (Thermo Sci. HM550, Kalamazoo, MI). After three rinses in PBS, sections were incubated in 2 N HCl for 30 min (for BrdU staining). The sections were rinsed, preincubated with 5% blocking serum in 0.3% Triton X-100 for 1 h, then incubated overnight with one of the primary antibodies, followed by a 1 h incubation at room temperature with Alexa Fluor–conjugated secondary antibodies. The following primary antibodies were used: rat anti-BrdU antibody (1:100; sc-56258, Santa Cruz, CA), goat anti-IL-15 antibody (1:100, sc-1296, Santa Cruz), goat anti-Qa1 antibody (1:100, sc-26168, Santa Cruz), mouse anti-EGFR antibody (1:100, 13G8, 04-290, Millipore), goat anti-NKp46 antibody (1:100, M20, sc-18161, Santa Cruz), goat anti-Sox-2 antibody (1:100, ab97959, Abcam, Cambridge, MA), rabbit anti-Iba1 antibody (1:100, WEM2922, Wako Chemicals USA, Richmond, VA), rabbit anti-Caspase3 antibody (1:100, H-277, sc7148, Santa Cruz), mouse anti-Flag antibody (1:100, FG4R, MA1-91878, Thermo Scientific, Fremont, CA), mouse anti-CNPase (2′,3′-cyclic nucleotide 3′-phosphodiesterase) antibody (1:100, 11-5B, ab6319, Abcam), goat or mouse anti-NG2 antibody (1:100, ab5076 or ab50009, Abcam), mouse anti-MASH1 antibody (1:100, 24B72D11, 14-5794-80, eBioscience, San Diego, CA), rabbit anti-DCX (1:100, H280, 28939, Millipore) or chicken anti-GFAP (1:100, AB5541, Millipore) at 4 °C. This was followed by incubation with species-specific Alexa Fluor (488, 405 and 555)-conjugated secondary antibodies (1:1,000, cat. no. A10667, A21432, A11070, A11039 and A21434, Invitrogen, Grand Island, NY; ab175671, ab175651, ab150073, ab150105, ab150110, ab175670, ab150129, ab150074, Abcam; 703-545-155, Jackson ImmunoResearch Laboratories, Inc., West Grove, PA).
For analysis of BrdU-retaining GFAP+ cells in the SVZ, every sixth 30-μm coronal section throughout the SVZ was processed for BrdU or for BrdU and GFAP immunohistochemistry. For all sections between rostrocaudal levels, a stack of ten overlapping optical slices was captured from the most dorsal of the septal SVZ, starting immediately ventral to the corpus callosum. LSM Browser software was used to identify BrdU+ or BrdU+GFAP+ cells in the SVZ. The software was also used to confirm in three dimensions that cells were double-labeled. BrdU-retaining cells in lateral SVZ regions were counted in the same sections used for the analysis35,36,43. Quantification was performed in a double-blinded manner.
Flow cytometry, NSC sorting and cell culture
Single-cell suspensions (106 cells) were prepared from spleen or dissociated from micro-dissected SVZ and stained with fluorochrome-conjugated antibodies12,27. Antibodies were labeled with one of the following fluorescent tags: FITC, PE, APC or PerCP. The following antibodies were used: CD3 (145-2C11, 553061, BD Biosciences, San Jose, CA), NKG2A (18d3, 12-0941-83, eBioscience), NKG2D (CX5, 562347, BD Biosciences), NK1.1 (PK136, 551114, BD Biosciences), IFN-γ (XMG1.2, 562018, BD Biosciences), Qa1 (6A8.6F10.1A6, 559829, BD Biosciences), CD1d (1B1, 553846, BD Biosciences), MULT-1 (5D10, 12-5863-82, eBioscience), RAE-1 (186107, FAB17582P, R&D Systems, Minneapolis, MN), H60 (205326, FAB1155P, R&D Systems), H-2K (AF6-88.5, 553570, BD Biosciences), H-2D (KH95, 553574, BD Biosciences), H2-M (2E5A, 552405, BD Biosciences), NG2 (ab81104, Abcam), CNPase (11-5B, ab6319, Abcam), IL-15 (ab7213, Abcam), IL-15Rα (DNT15Ra, 46-7149-82, eBioscience), BrdU (51-23614L, BD Pharmingen), annexin V (51-65874X, BD Pharmingen). Fluorescence minus one (FMO) controls were included. Flow cytometric data were collected on a FACSAria flow cytometer and analyzed with Diva software.
SVZs from 2- to 3-month-old mice were dissected and dissociated as described elsewhere27. Briefly, mice were anesthetized and decapitated, and brains were removed. SVZs were dissected on ice and dissociated in DMEM (Invitrogen, Grand Island, NY) containing 2.5 U ml−1 papain, 1 U ml−1 dispase II and 250 U ml−1 DNase 1 (Worthington Biochemical, NJ) for 45 min at 37 °C. Dissociated cells were purified on two Percoll (Sigma-Aldrich, St. Louis, MO) gradients, 35 and 65%. Cells were simultaneously incubated for 30 min with FITC-conjugated anti-mCD24 (M1/69, 553261, BD Pharmingen), PE-conjugated anti-GFAP (1B4, 561483, BD Pharmingen) and Alexa Fluor 647-conjugated anti-EGFR (E-35351, Invitrogen). Different cell populations were isolated in a single sort using a BD FACS Aria with 13 psi pressure and 100-μm nozzle aperture. Data were collected by using a linear digital signal process. Gates were set manually by using control samples. Flow cytometric data were collected on a FACSAria flow cytometer and analyzed with Diva software. Isotype-matched negative control antibodies were used for all stains12.
As described27, sorted type B, C or A cells or other astrocytes derived from adult mouse SVZ were cultured on 35-mm-diameter culture dishes coated with poly-l-ornithine (Invitrogen, CA) and laminin (Sigma-Aldrich, St. Louis, MO) in DMEM/F-12, supplemented with 15 mM HEPES, 2 mM l-glutamine, 100 U ml−1 penicillin, 100 mg ml−1 streptomycin, (Invitrogen, Grand Island, NY), 20 ng ml−1 EGF and 20 ng ml−1 basic FGF (Sigma-Aldrich, St. Louis, MO). For the culture of type C or A cells, Neurobasal medium was supplemented with B27 (1:50; Invitrogen, Grand Island, NY), 2 mM l-glutamine, 100 U ml−1 penicillin, 100 mg ml−1 streptomycin, 20 ng ml−1 EGF and 20 ng ml−1 FGF (Sigma-Aldrich, St. Louis, MO). Sorted oligodendrocyte precursors were cultured in proliferation medium (Neurobasal medium with 2% B27, 2 mM l-glutamine, 10 ng ml−1 human platelet-derived growth factor and 10 ng ml−1 human basic fibroblast growth factor) or differentiation medium (Neurobasal medium lacking growth factors).
Luminex assay and ELISA
FACS-sorted mouse SVZ cells (1 × 10⁶) were cultured for 24 h in 1 ml of culture medium in 96-well plates and subsequently lysed with 25 μl cell lysis buffer (Millipore, Billerica, MA). The relative concentrations of cytokines and chemokines from cell lysates were measured in supernatants using antibody-based multiplex immunoassays (Luminex, Austin, TX). Measurements were performed from at least three independent samples, as described44.
IL-15 was detected using a chemiluminescence immunoassay (R&D Systems, Minneapolis, MN) that detects both IL-15 and IL-15/IL-15Rα. To measure exclusively IL-15/IL-15Rα complexes, an ELISA specific for IL-15/IL-15Rα was used (eBioscience). VEGF, IL-4 and MCP-1 were detected using ELISA kits (Pierce Biotechnology, Rockford, IL). The standard curve was determined by cubic-spline curve fit using Prism 5.0 software. Intra-assay precision was evaluated by testing six samples of known quantity in triplicate. Interassay precision was evaluated by testing six samples of known quantity in three independent assays.
Quantitative real-time PCR and surface isolation of IL-15Rα
Quantitative real-time PCR and surface isolation of IL-15Rα were performed as described elsewhere43,45–47. Total RNA from NSCs cultures was extracted using column purification (Qiagen, Gaithersburg, MD) as described43,45. First-strand cDNA was generated with random primers using iScript cDNA synthesis kits (Bio-Rad). Real-time analysis was performed on a Bio-Rad ICycler system (Bio-Rad) using the following conditions: initial denaturation for 10 min at 95 °C, 40 cycles of 15 s denaturation at 95 °C, 30 s annealing at 60 °C, 1 min extension at 72 °C. Analysis was performed according to the ΔΔCt method using Gapdh as housekeeping gene. The primer sequences of Il15ra were 5′-AAACAGAGGCCAACTGGATAG-3′ and 5′-CTTTGCAACTGGGATGAAAGTC-3′.
For immunoprecipitation of IL-15Rα, cultured NSCs, grown on a 10-cm culture dish, were lysed with a buffer containing 50 mM Tris, pH 8.0, 150 mM NaCl, 1% Nonidet P-40, 0.5% sodium deoxycholate, 0.1% SDS, and 1 mM PMSF. The cell lysate was incubated with an anti-IL-15Rα antibody (R&D, Emeryville, CA). The immunoprecipitates were washed 3–5 times with lysis buffer and subjected to western blotting. Cell surface biotinylation in cultured NSCs was performed using the Pierce Cell Surface Protein Isolation kit (Thermo Scientific) according to the manufacturer’s protocol. In brief, cells grown on 10-cm culture dishes were washed with PBS and incubated with EZ-Link sulfo-NHS-SS-biotin for 30 min at 4 °C, followed by the addition of a quenching solution. Cells were lysed with 500 μl of a buffer containing Halt protease inhibitor mixture. Lysates were used for western blotting. Biotinylated IL-15Rα was isolated with NeutrAvidin agarose gel, eluted with 400 μl sample buffer containing DTT, and subjected to western blotting with anti-IL-15Rα antibody (sc-1524, Santa Cruz, CA).
51Cr-release assay
NK cell cytotoxicity was evaluated with a standard 51Cr-release assay. FACS-sorted and cultured NSCs were used as target cells and labeled with 51Cr. Various effector:target cell ratios were used12,26.
Stereotactic injection
Stereotactic injection was performed as previously described12,21,48,49 with slight modifications. Briefly, under sterile conditions, mice were anesthetized with isoflurane and secured in a stereotactic frame (David Kopf Instruments, Tujunga, CA). Holes the size of the injection needle were drilled in the skull, and injections were performed unilaterally with 2 μl of vector or with a syringe pump (KD Scientific, Holliston, MA) that delivered vector at a constant volume of 0.5 μl min−1. The needle was left in place for 3 min after each injection to minimize upward flow of viral solution after raising the needle. For ventricular injections, 10 μl of adenovirus or 2 μl of lentivirus was injected at coordinates 0.4 mm rostral and 1.0 mm lateral to bregma and at a 2 mm depth. For striatal injections, 5 × 10⁵ cultured NSCs suspended in 5 μl PBS were injected at coordinates 0.4 mm rostral and 2 mm lateral to bregma, and at a 2.5 mm depth. For intraspinal injections, 5 × 10⁵ cultured NSCs suspended in 6 μl PBS were injected at three spinal levels.
Construction of an shIL-15 lentivirus vector
A synthetic nestin promoter was composed of partial intron 2 and exon 3 sequences of the human nestin gene and the HSP68 minimal promoter. pCDH-CMV-MCS-EF1-copGFP (System Biosciences, Mountain View, CA) was used as template vector and the CMV promoter was replaced by the nestin promoter. Thereafter, EF1-copGFP was replaced by EGFP and a multiple cloning site (MCS) at the 3′-terminal end of the EGFP gene. The miR-30 based shIL-15 cassette was inserted into the MCS and the construct verified by sequencing. The same vector without insertion of mi-shIL-15 was used as control. The recombinant lentivirus was produced as we previously described12,26.
Construction of an adenoviral vector encoding Qa1
The construction of adenoviral vectors encoding Qa1 was performed as described with modifications12. Full-length Qa1 cDNA was amplified by RT-PCR from RNA isolated from splenocytes of B6 mice. After verification of the sequence, cDNA was ligated into the DUAL-CCM+ shuttle vector with a C-terminal Flag epitope tag under the control of a CMV promoter (Vector Biolabs, Philadelphia, PA). Recombinant adenovirus was custom-generated by Vector Biolabs (Vector Biolabs, Philadelphia, PA).
Cytokine array
Cytokines in CNS tissue homogenates were measured using a Multi-Analyte ELISArray kit (SA Biosciences, Valencia, CA). Protein homogenates were extracted from mouse brains using the Halt Protease Inhibitor Cocktail kit (Thermo Fisher Scientific, Fremont, CA) and centrifuged at 78,500g for 1 h at 4 °C, and supernatants were collected and stored at −70 °C until the assay. The levels of cytokines and chemokines were detected simultaneously at 1:20 dilutions according to the manufacturer’s instructions, and reactions analyzed at a wavelength of 450 nm using a 96-well microplate reader (Model 680; Bio-Rad Laboratories, Hercules, CA).
Statistical analyses
Data are presented as means ± s.e.m. Differences were considered significant at P < 0.05. Statistical differences among groups were evaluated by two-tailed unpaired Student’s t-test for two groups and by one-way analysis of variance (ANOVA) followed by Tukey post hoc test for three or more groups. Two-way ANOVA accompanied by a Bonferroni post hoc test was used for multiple comparisons. No statistical methods were used to predetermine sample sizes, but our sample sizes are similar to those generally employed in the field. The data distribution was assumed to be normal, but this was not formally tested. All statistical analyses were performed using Prism 5.0 software (GraphPad, San Diego, CA).
Supplementary Material
Acknowledgments
We thank Y. Yan for technical help. This study was supported in part by National Basic Research Program of China grant 2013CB966900; National Science Foundation of China grants 81230028, 81301044 and 81471535; the National Key Clinical Specialty Construction Program of China; US National Institutes of Health grants R01NS082745, R01CA175391 and R01DK081536; and American Heart Association grant 16SDG27250236; and a National Multiple Sclerosis Society research grant.
Footnotes
AUTHOR CONTRIBUTIONS
Q.L., N.S. and F.-D.S. designed the studies; Q.L. and W.-N.J. performed the studies; A.L.C. and L.V.K. advised on design, execution of experiments and interpretation of results; and Q.L., A.L.C., L.V.K. and F.-D.S. wrote and edited the manuscript.
COMPETING FINANCIAL INTERESTS
The authors declare no competing financial interests.
A Supplementary Methods Checklist is available.
Note: Any Supplementary Information and Source Data files are available in the online version of the paper.
References
- 1.Shi FD, Ljunggren HG, La Cava A, Van Kaer L. Organ-specific features of natural killer cells. Nat Rev Immunol. 2011;11:658–671. doi: 10.1038/nri3065. [DOI] [PMC free article] [PubMed] [Google Scholar]
- 2.Vivier E, et al. Innate or adaptive immunity? The example of natural killer cells. Science. 2011;331:44–49. doi: 10.1126/science.1198687. [DOI] [PMC free article] [PubMed] [Google Scholar]
- 3.Sun JC, Lanier LL. NK cell development, homeostasis and function: parallels with CD8+ T cells. Nat Rev Immunol. 2011;11:645–657. doi: 10.1038/nri3044. [DOI] [PMC free article] [PubMed] [Google Scholar]
- 4.Yokoyama WM, Kim S, French AR. The dynamic life of natural killer cells. Annu Rev Immunol. 2004;22:405–429. doi: 10.1146/annurev.immunol.22.012703.104711. [DOI] [PubMed] [Google Scholar]
- 5.Schleinitz N, Vély F, Harlé JR, Vivier E. Natural killer cells in human autoimmune diseases. Immunology. 2010;131:451–458. doi: 10.1111/j.1365-2567.2010.03360.x. [DOI] [PMC free article] [PubMed] [Google Scholar]
- 6.Flodström-Tullberg M, Bryceson YT, Shi FD, Höglund P, Ljunggren HG. Natural killer cells in human autoimmunity. Curr Opin Immunol. 2009;21:634–640. doi: 10.1016/j.coi.2009.09.012. [DOI] [PubMed] [Google Scholar]
- 7.Sun JC, Beilke JN, Bezman NA, Lanier LL. Homeostatic proliferation generates long-lived natural killer cells that respond against viral infection. J Exp Med. 2011;208:357–368. doi: 10.1084/jem.20100479. [DOI] [PMC free article] [PubMed] [Google Scholar]
- 8.Jaeger BN, et al. Neutrophil depletion impairs natural killer cell maturation, function, and homeostasis. J Exp Med. 2012;209:565–580. doi: 10.1084/jem.20111908. [DOI] [PMC free article] [PubMed] [Google Scholar]
- 9.Sun JC, Beilke JN, Lanier LL. Adaptive immune features of natural killer cells. Nature. 2009;457:557–561. doi: 10.1038/nature07665. [DOI] [PMC free article] [PubMed] [Google Scholar]
- 10.Robbins SH, Tessmer MS, Mikayama T, Brossay L. Expansion and contraction of the NK cell compartment in response to murine cytomegalovirus infection. J Immunol. 2004;173:259–266. doi: 10.4049/jimmunol.173.1.259. [DOI] [PubMed] [Google Scholar]
- 11.Zhang B, Yamamura T, Kondo T, Fujiwara M, Tabira T. Regulation of experimental autoimmune encephalomyelitis by natural killer (NK) cells. J Exp Med. 1997;186:1677–1687. doi: 10.1084/jem.186.10.1677. [DOI] [PMC free article] [PubMed] [Google Scholar]
- 12.Hao J, et al. Central nervous system (CNS)-resident natural killer cells suppress Th17 responses and CNS autoimmune pathology. J Exp Med. 2010;207:1907–1921. doi: 10.1084/jem.20092749. [DOI] [PMC free article] [PubMed] [Google Scholar]
- 13.Hao J, et al. Interleukin-2/interleukin-2 antibody therapy induces target organ natural killer cells that inhibit central nervous system inflammation. Ann Neurol. 2011;69:721–734. doi: 10.1002/ana.22339. [DOI] [PMC free article] [PubMed] [Google Scholar]
- 14.Huang D, et al. The neuronal chemokine CX3CL1/fractalkine selectively recruits NK cells that modify experimental autoimmune encephalomyelitis within the central nervous system. FASEB J. 2006;20:896–905. doi: 10.1096/fj.05-5465com. [DOI] [PubMed] [Google Scholar]
- 15.Alvarez-Buylla A, Garcia-Verdugo JM. Neurogenesis in adult subventricular zone. J Neurosci. 2002;22:629–634. doi: 10.1523/JNEUROSCI.22-03-00629.2002. [DOI] [PMC free article] [PubMed] [Google Scholar]
- 16.Faiz M, et al. Substantial migration of SVZ cells to the cortex results in the generation of new neurons in the excitotoxically damaged immature rat brain. Mol Cell Neurosci. 2008;38:170–182. doi: 10.1016/j.mcn.2008.02.002. [DOI] [PubMed] [Google Scholar]
- 17.James R, Kim Y, Hockberger PE, Szele FG. Subventricular zone cell migration: lessons from quantitative two-photon microscopy. Front Neurosci. 2011;5:30. doi: 10.3389/fnins.2011.00030. [DOI] [PMC free article] [PubMed] [Google Scholar]
- 18.Tepavčević V, et al. Inflammation-induced subventricular zone dysfunction leads to olfactory deficits in a targeted mouse model of multiple sclerosis. J Clin Invest. 2011;121:4722–4734. doi: 10.1172/JCI59145. [DOI] [PMC free article] [PubMed] [Google Scholar]
- 19.Rasmussen S, et al. Reversible neural stem cell niche dysfunction in a model of multiple sclerosis. Ann Neurol. 2011;69:878–891. doi: 10.1002/ana.22299. [DOI] [PMC free article] [PubMed] [Google Scholar]
- 20.Pluchino S, et al. Persistent inflammation alters the function of the endogenous brain stem cell compartment. Brain. 2008;131:2564–2578. doi: 10.1093/brain/awn198. [DOI] [PMC free article] [PubMed] [Google Scholar]
- 21.Mosher KI, et al. Neural progenitor cells regulate microglia functions and activity. Nat Neurosci. 2012;15:1485–1487. doi: 10.1038/nn.3233. [DOI] [PMC free article] [PubMed] [Google Scholar]
- 22.Yang J, et al. Adult neural stem cells expressing IL-10 confer potent immunomodulation and remyelination in experimental autoimmune encephalitis. J Clin Invest. 2009;119:3678–3691. doi: 10.1172/JCI37914. [DOI] [PMC free article] [PubMed] [Google Scholar]
- 23.Kokaia Z, Martino G, Schwartz M, Lindvall O. Cross-talk between neural stem cells and immune cells: the key to better brain repair? Nat Neurosci. 2012;15:1078–1087. doi: 10.1038/nn.3163. [DOI] [PubMed] [Google Scholar]
- 24.Poli A, et al. NK cells in central nervous system disorders. J Immunol. 2013;190:5355–5362. doi: 10.4049/jimmunol.1203401. [DOI] [PubMed] [Google Scholar]
- 25.Bielekova B, et al. Regulatory CD56(bright) natural killer cells mediate immunomodulatory effects of IL-2Ralpha-targeted therapy (daclizumab) in multiple sclerosis. Proc Natl Acad Sci USA. 2006;103:5941–5946. doi: 10.1073/pnas.0601335103. [DOI] [PMC free article] [PubMed] [Google Scholar]
- 26.Gan Y, et al. Ischemic neurons recruit natural killer cells that accelerate brain infarction. Proc Natl Acad Sci USA. 2014;111:2704–2709. doi: 10.1073/pnas.1315943111. [DOI] [PMC free article] [PubMed] [Google Scholar]
- 27.Pastrana E, Cheng LC, Doetsch F. Simultaneous prospective purification of adult subventricular zone neural stem cells and their progeny. Proc Natl Acad Sci USA. 2009;106:6387–6392. doi: 10.1073/pnas.0810407106. [DOI] [PMC free article] [PubMed] [Google Scholar]
- 28.Yirmiya R, Goshen I. Immune modulation of learning, memory, neural plasticity and neurogenesis. Brain Behav Immun. 2011;25:181–213. doi: 10.1016/j.bbi.2010.10.015. [DOI] [PubMed] [Google Scholar]
- 29.Huntington ND, et al. IL-15 trans-presentation promotes human NK cell development and differentiation in vivo. J Exp Med. 2009;206:25–34. doi: 10.1084/jem.20082013. [DOI] [PMC free article] [PubMed] [Google Scholar]
- 30.Lee GA, et al. Different NK cell developmental events require different levels of IL-15 trans-presentation. J Immunol. 2011;187:1212–1221. doi: 10.4049/jimmunol.1100331. [DOI] [PubMed] [Google Scholar]
- 31.Lucas M, Schachterle W, Oberle K, Aichele P, Diefenbach A. Dendritic cells prime natural killer cells by trans-presenting interleukin 15. Immunity. 2007;26:503–517. doi: 10.1016/j.immuni.2007.03.006. [DOI] [PMC free article] [PubMed] [Google Scholar]
- 32.Oda K, et al. Brefeldin A arrests the intracellular transport of a precursor of complement C3 before its conversion site in rat hepatocytes. FEBS Lett. 1987;214:135–138. doi: 10.1016/0014-5793(87)80028-5. [DOI] [PubMed] [Google Scholar]
- 33.Broutman G, Baudry M. Involvement of the secretory pathway for AMPA receptors in NMDA-induced potentiation in hippocampus. J Neurosci. 2001;21:27–34. doi: 10.1523/JNEUROSCI.21-01-00027.2001. [DOI] [PMC free article] [PubMed] [Google Scholar]
- 34.Shi FD, et al. Natural killer cells determine the outcome of B cell-mediated autoimmunity. Nat Immunol. 2000;1:245–251. doi: 10.1038/79792. [DOI] [PubMed] [Google Scholar]
- 35.Lee N, et al. Ciliary neurotrophic factor receptor regulation of adult forebrain neurogenesis. J Neurosci. 2013;33:1241–1258. doi: 10.1523/JNEUROSCI.3386-12.2013. [DOI] [PMC free article] [PubMed] [Google Scholar]
- 36.Suyama S, et al. Purinergic signaling promotes proliferation of adult mouse subventricular zone cells. J Neurosci. 2012;32:9238–9247. doi: 10.1523/JNEUROSCI.4001-11.2012. [DOI] [PMC free article] [PubMed] [Google Scholar]
- 37.Liu C, Hermann TE. Characterization of ionomycin as a calcium ionophore. J Biol Chem. 1978;253:5892–5894. [PubMed] [Google Scholar]
- 38.Brilot F, Strowig T, Roberts SM, Arrey F, Münz C. NK cell survival mediated through the regulatory synapse with human DCs requires IL-15Ralpha. J Clin Invest. 2007;117:3316–3329. doi: 10.1172/JCI31751. [DOI] [PMC free article] [PubMed] [Google Scholar]
- 39.Bergamaschi C, et al. Intracellular interaction of interleukin-15 with its receptor alpha during production leads to mutual stabilization and increased bioactivity. J Biol Chem. 2008;283:4189–4199. doi: 10.1074/jbc.M705725200. [DOI] [PubMed] [Google Scholar]
- 40.Aharoni R, Arnon R, Eilam R. Neurogenesis and neuroprotection induced by peripheral immunomodulatory treatment of experimental autoimmune encephalomyelitis. J Neurosci. 2005;25:8217–8228. doi: 10.1523/JNEUROSCI.1859-05.2005. [DOI] [PMC free article] [PubMed] [Google Scholar]
- 41.Sajad M, et al. Cytokinetics of adult rat SVZ after EAE. Brain Res. 2011;1371:140–149. doi: 10.1016/j.brainres.2010.11.050. [DOI] [PubMed] [Google Scholar]
- 42.Bettelli E, et al. Reciprocal developmental pathways for the generation of pathogenic effector TH17 and regulatory T cells. Nature. 2006;441:235–238. doi: 10.1038/nature04753. [DOI] [PubMed] [Google Scholar]
- 43.Liu Q, et al. Interleukin-17 inhibits adult hippocampal neurogenesis. Sci Rep. 2014;4:7554. doi: 10.1038/srep07554. [DOI] [PMC free article] [PubMed] [Google Scholar]
- 44.Jang H, et al. Inflammatory effects of highly pathogenic H5N1 influenza virus infection in the CNS of mice. J Neurosci. 2012;32:1545–1559. doi: 10.1523/JNEUROSCI.5123-11.2012. [DOI] [PMC free article] [PubMed] [Google Scholar]
- 45.Liu Q, Xie X, Lukas RJ, St John PA, Wu J. A novel nicotinic mechanism underlies β-amyloid-induced neuronal hyperexcitation. J Neurosci. 2013;33:7253–7263. doi: 10.1523/JNEUROSCI.3235-12.2013. [DOI] [PMC free article] [PubMed] [Google Scholar]
- 46.Kemper K, et al. The AC133 epitope, but not the CD133 protein, is lost upon cancer stem cell differentiation. Cancer Res. 2010;70:719–729. doi: 10.1158/0008-5472.CAN-09-1820. [DOI] [PubMed] [Google Scholar]
- 47.Suzuki M, et al. Defective membrane expression of the Na+HCO3− cotransporter NBCe1 is associated with familial migraine. Proc Natl Acad Sci USA. 2010;107:15963–15968. doi: 10.1073/pnas.1008705107. [DOI] [PMC free article] [PubMed] [Google Scholar]
- 48.Carbajal KS, Schaumburg C, Strieter R, Kane J, Lane TE. Migration of engrafted neural stem cells is mediated by CXCL12 signaling through CXCR4 in a viral model of multiple sclerosis. Proc Natl Acad Sci USA. 2010;107:11068–11073. doi: 10.1073/pnas.1006375107. [DOI] [PMC free article] [PubMed] [Google Scholar]
- 49.Cearley CN, Wolfe JH. A single injection of an adeno-associated virus vector into nuclei with divergent connections results in widespread vector distribution in the brain and global correction of a neurogenetic disease. J Neurosci. 2007;27:9928–9940. doi: 10.1523/JNEUROSCI.2185-07.2007. [DOI] [PMC free article] [PubMed] [Google Scholar]
Associated Data
This section collects any data citations, data availability statements, or supplementary materials included in this article.