

Abstract
Starches isolated from four ayocote bean varieties were modified by thermal treatment to determinate the effect of the treatment on the structural changes of ayocote bean starch. Scanning electron microscopy indicates that the starch granules have oval and round shapes, with heterogeneous sizes and fractures when the extraction method is used. The presence of new bands at 2850 and 1560 cm−1 in the FT-IR spectra showed that the thermal treatment of ayocote beans induced an interaction between the protein or lipid and the amylose or amylopectin, while the sharpest band at 3400 cm−1 indicated a dehydration process in the starch granule in addition to the presence of the band at 1260 cm−1, indicating the product of the retrogradation process. The thermal treatment reduced the crystallinity as well as short-range order. Raman spectroscopy revealed that acute changes occurred in the polysaccharide bonds after thermal treatment. This study showed that the thermal treatment affected the structural properties of ayocote bean starches, the interactions of the lipids and proteins with starch molecules and the retrogradation process of starch.
Keywords: Retrograded starch, Ayocote beans, Spectroscopic methods
Introduction
The species of Phaseolus are the most important food pulse consumed in the countries of Central America, South America, Central Africa and East Africa (Gathu et al. 2012) because they contain a high concentration of starch. They are less of a staple food in many other countries; however, they can be cultivated to substitute for the conventional sources of starch. In the human diet of developing countries, beans are, after cereals, the most important source of starch and protein and are good sources of dietary fiber, minerals, vitamins and polyunsaturated fatty acids (Audu and Aremu 2011). In particular, the ayocote bean (Phaseolus coccineus), a cultivated species of the genus Phaseolus, is exceptional for several reasons.
The ayocote bean is generally consumed after cooking; however, this process undergoes several reactions, causing the gelatinization of starch. The primary reactions are depolymerization followed by repolymerization with the formation of new bonds between the carbon atoms of glucose units, which are different from those present in native starch (Łabanowska et al. 2013a). The crystalline nature of starch is due to the amylose-amylopectin ratio, and any food processing, such as cooking and cooling of starchy foods, can lead to retrogradation (Flores-Morales et al. 2012).
Raman spectroscopy has been used for rapid data collection, and it provides more selective spectral features than other methods (Feng et al. 2013). However, there are only a few studies describing the use of Raman or Infrared spectroscopy to determine changes in starch after the cooking process, and these works focused on the changes that occurred in the polysaccharide structure and the bond modifications in starch and in its fractions with the cooking process (Łabanowska et al. 2013b). Therefore, the goal of this study was to examine the changes after thermal treatment of four ayocote bean varieties. Two spectroscopic methods, FT-IR and Raman spectroscopy, were applied to study the changes that occurred in starch structure after thermal treatment, and a microscopy method was also used to study these changes.
Materials and methods
Vegetal material
Ayocote beans were obtained from Zacatlan, Puebla, Mexico. Before the chemical analysis was performed, the ayocote beans of each variety were milled into a fine powder and sieved through a 40-mesh (425 μm) sieve.
Physical characterization of ayocote beans
The physical properties of ayocote beans were characterized by measuring the dimensions and densities, the thousand-grain weight and the hectoliter weight.
Chemical characterization of ayocote beans
The methods of the Association of Official Analytical Chemists (AOAC 1995) were used to determine the crude protein, moisture, ash and crude fat content. The nitrogen content was determined using the Kjeldahl method, and the result was multiplied by a factor 6.25 to determine the crude protein content. All results are expressed on a dry weight basis.
Hydrothermal processing of ayocote beans
The ayocote beans (10% w/v) were dispersed in distilled water under agitation for 1 h at 20 °C, boiled in a water bath at 90 °C for 25 min, stored overnight in a freezer at −40 °C, freeze-dried in a freeze dryer (Freezone Plus 6, Labconco, USA) at −40 °C and 0.30 mPa until reaching a constant weight (approximately 72 h), and then ground with a domestic coffee grinder. The dried ayocote bean powders were sealed airtight and stored at 4 °C until further analyses.
Starch extraction
Aqueous extraction
Starch was extracted using the wet method described by Schoch and Maywald (1968). Ayocote beans (30 g) (with or without thermal treatment) were suspended in six times their volume of water at pH 6.5 for 12 h, and then, the water was decanted, and the beans were pulverized in a high-speed blender for 5 min. The pulp was suspended in ten times its volume of water, stirred for 5 min and filtered using 60-mesh and 200-mesh sieves sequentially. The filtrate was allowed to stand for 3 h to allow the starch to settle, and the top liquid was decanted and discarded. Water was added to the sediment, and the mixture was stirred again for 5 min. The filtration procedure was repeated, and the starch from the filtrate was allowed to settle; this process was repeated three times. After decanting the top liquid, the sediment (starch) was sun dried for 24 h and then packaged in 25-g glass bottles.
Ethanolic extraction
Ayocote bean powder (20 g) (with or without thermal treatment) was suspended in six times its volume of 96% ethanol solution; then, it was centrifuged at 3000 rpm, and the supernatant was discarded. The precipitated starch was deposited in a 40-mesh sieve and washed successively with a 96% ethanol solution. The filtration procedure was repeated, and the starch from the filtrate was allowed to settle; this process was repeated three times. After decanting the top liquid, the sediment (starch) was sun dried for 24 h and packaged in 25-g glass bottles.
Starch characterization
Scanning electron microscopy (SEM)
Samples of native starches were examined using a JEOL (JEOL, type EX-1200, Japan) scanning electron microscope fitted with a Kevex Si(Li) X-ray detector. The analyses were performed under vacuum at an accelerating voltage of 15 kV. The samples were mounted on double-sided carbon tape and covered with approximately 10 nm of gold in a Denton sputter coater.
Fourier transform infrared (FT-IR) spectroscopy
The FT-IR spectrum of ayocote bean starch was acquired on a Perkin Elmer FT-IR spectrophotometer (Perkin Elmer, Inc., MA, USA) using a potassium bromide (KBr) disc prepared from powered samples mixed with dry KBr. The spectra were recorded (16 scans) in the transparent mode from 4000 to 400 cm−1.
Raman spectroscopy
The Raman measurements were obtained on a Perkin-Elmer (Perkin Elmer, Inc., MA, USA) NIR FT-Raman Spectrometer 2000R equipped with a Nd:YAG laser emitting at a 1064-nm wavelength and equipped with an InGaAs detector. The 180° backscattering refractive geometry was used. The spectrometer was managed through the Spectra software provided by Perkin-Elmer. The spectral data of ayocote bean starches were obtained at a resolution of 4 cm−1 and at a nominal laser power of 500 mW. For each spectrum, 20 scans were accumulated to ensure an acceptable signal-to-noise ratio. All Raman spectra were collected at room temperature.
Statistical analysis
The quantitative data are expressed as the mean ± standard deviation, and the analysis of variance (ANOVA) was performed, followed by Tukey’s test. SAS software was used for the data analysis, and all experimental determinations were performed in triplicate.
Results and discussion
Physical characterization
Light brown ayocote beans had the lowest hectoliter weight, while black ayocote beans showed the highest however, no statistical differences were observed between purple, black and dark brown varieties. There were significant differences in ayocote bean dimensions. Purple beans and light brown beans (19.30 mm) had the longest length, while the shortest for black bean (17.10 mm) was observed. The variety with the widest bean width was the light brown bean (12.80 mm), while the black bean had the smallest width (11.80 mm). The variety with the highest seed thickness was the light brown bean (8.50 mm), while the lowest seed thickness belonged to the black bean (7.50 mm).
The variability in bean size may have affected the cooking time and uniformity of seed cooking, and many authors have indicated that the canning quality and hydration coefficients statistically different in both large and small seeded genotypes of beans (Gathu et al. 2012; Warsame and Kimani 2014). The differences in hydration capacity were attributed to inherent differences in permeability to water, which was associated to bean size (Basra 2006). Lowest hectoliter weight of the ayocote bean (64.88) corresponded to the light brown variety; in addition to density was associated with the fat content, the carbohydrate content and quality indices (Méndez et al. 2012). In general, it was observed that the purple and light brown ayocote bean varieties had the best physical characteristics.
Chemical composition
Significant differences (p < 0.05) in chemical compositions proximate of ayocote bean samples were observed (Table 1). The protein content of ayocote bean varieties, which ranged from 21.73 to 23.80%, the highest for black variety, and lowest for the light brown variety was observed. The difference in protein content is associated with the fertilizer application and the growing locations, which influenced the yield and protein concentration of some seeds (Malik et al. 2012). The crude fiber and ash content ranged from 4.21 to 6.22% and from 3.50 to 4.11%, respectively.
Table 1.
Chemical composition (%) of ayocote bean varieties (mean ± standard deviation of triplicate analyses)
| Component | Purple | Black | Dark brown | Light brown |
|---|---|---|---|---|
| Moisture | 9.62 ± 011c | 9.37 ± 0.20d | 10.34 ± 0.06a | 10.32 ± 0.10b |
| Crude fat | 3.78 ± 0.11a | 3.50 ± 0.02b | 3.42 ± 0.12c | 3.25 ± 0.18d |
| Crude protein | 21.93 ± 0.68c | 23.80 ± 0.87a | 22.97 ± 0.34b | 21.73 ± 0.37d |
| Crude fiber | 6.22 ± 0.10a | 4.79 ± 0.08c | 4.21 ± 0.07d | 5.18 ± 0.12b |
| Ash | 3.77 ± 0.13c | 3.50 ± 0.87d | 4.11 ± 0.13a | 4.08 ± 0.01b |
| Total carbohydrate | 64.30d | 64.41c | 65.29b | 65.76a |
Means followed by same superscript within a row do not differ significantly (P < 0.05)
The values for the lipid content in ayocote beans varied significantly (p < 0.05) and were higher for purple variety. The lipid content in all ayocote seeds was similar to that observed for common beans (Audu and Aremu 2011) on a dry basis.
Effect of different extraction methods on the yield and morphology of ayocote bean starch
The starch yield in ayocote beans was significantly different (p < 0.05) for each extraction method for the four varieties; the starch yield was higher for aqueous method than ethanolic method. Aqueous extraction yields of starch ranged from 32.30 to 34.10%. The aqueous extraction gave starch yield are similar to those reported by Tovar et al. (1990), who obtained values between 30.4 and 35.2%. The ethanolic extraction yields of starch ranged from 25.53 to 26.13%.
SEM images and the granule sizes of ayocote bean starch extracted by the two isolation methods are shown in Fig. 1. The granules were round and oval, exhibiting some fractures. These fractures were more evident in the starch obtained from the ethanolic method (Fig. 1b) for the four varieties, suggesting that the effect of the ethanolic method is more extensive. Considering the varieties, there were no significant differences detected among starch particle sizes. The mean granule size ranged from 23 to 25 μm for aqueous isolation and from 25 to 65 μm for the starches isolated with ethanol.
Fig. 1.

SEM micrograph of ayocote bean starches. a Starch granules extracted with water b starch granules extracted with ethanol
The maximum variability was observed for the purple variety of the ayocote bean starches, with an average granule size of 25 and 65 μm for starch reported by the aqueous and ethanolic method, respectively. Starch extracted from black, dark brown and light brown varieties showed minor variations in size. For the four varieties, the isolation method appeared to affect the granule size because the starch isolated by the aqueous method did not show the presence of granules larger than 25 μm, which can be considered as medium/small granules (Correia et al. 2012). It was also observed that some of the starch granules of the purple variety isolated with ethanol were larger than 60 μm; thus, the ethanolic extraction method induced a larger size range of starch granules than the aqueous method, or rather, that during the extraction with water, the components associated with the starch granule are lost/destroyed and removed over the aqueous phase by non-starch polysaccharides.
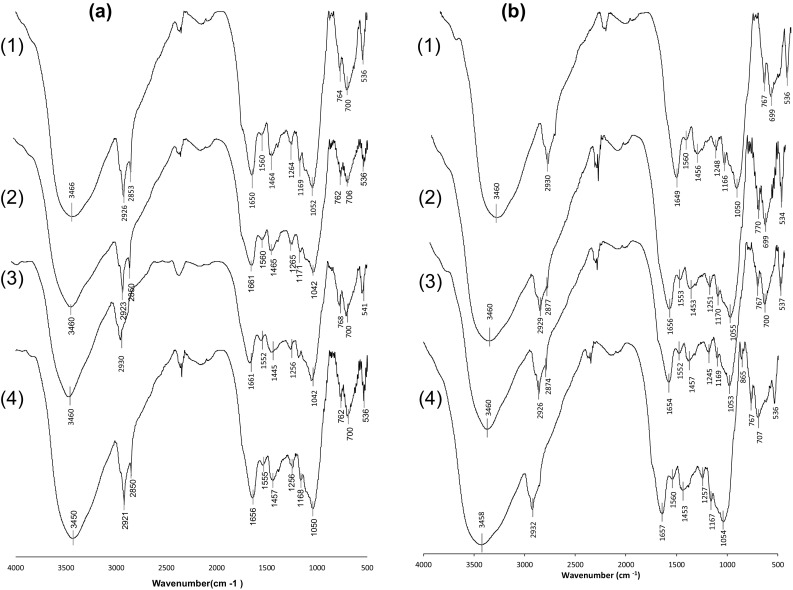
Infrared spectroscopy analysis of structural changes due to the extraction process
The FT-IR spectra of the ayocote bean starch samples without hydrothermal treatment extracted with water or ethanol are shown in Fig. 2. It can be observed that the spectra of starches extracted with water show an acute band around 3400 cm−1 (Fig. 2 a), while that in the spectra of starches extracted with ethanol was smother, implying the formation of more hydrogen bonds in the samples (Fig. 2 b) due to the stretching vibration of the O–H bond. The starch obtained with ethanol or water from the dark brown variety showed the presence of a light band near 2860 cm−1, indicating that the spatial structure of the protein was attached to the starch, overlapping the stretching vibration of the C–H bond from the glucose units and the −CH2 symmetric stretching vibration of proteins, considering that the bands around 2930 cm−1 may be attributed to not only starch but also protein (Lian et al. 2014). It is important to mention that the ayocote beans have a high protein content; therefore, a light band around 1560 cm−1 was observed in the starch extracted with water from the purple and light brown varieties (Fig. 2a; 1 and (2)), which was associated to the groups from proteins attached to both the surface and the interior of the starch granules (Flores-Morales et al. 2012).
Fig. 2.
FT-IR patterns of ayocote bean starches without thermal treatment. a extracted with water, b extracted with ethanol. (1) Dark brown variety; (2) Light brown variety; (3) Purple variety; (4) Black variety
Authors have indicated that starch presents a significant peak around 1660 cm−1, which corresponded to the scissor vibrations of –OH from hydration water on the amorphous regions of starch (Pascoal et al. 2013). In the samples extracted with ethanol (Fig. 2b), the peak’s intensity showed distinct variations compared to that from starch extracted with water; the enhancement of this band in the starch extracted with ethanol implies changes in the crystallinity, indicating a loss of amorphous structure due to amylose hydrolysis (Dutta et al. 2011). The results showed that the interaction of starch with ethanol involved the hydrolysis of glycosidic bonds, and authors have indicated that the degree of hydrolysis was inversely proportional to the concentration of the starch suspended in ethanol (Robyt et al. 1996).
The spectra of starches extracted with water (Fig. 2a) showed the characteristic peak of the polysaccharides corresponding to the O–H in-plane bending around 1440 cm−1; however, in the starches extracted with ethanol, this peak was displaced to approximately 1460 cm−1, apparently due to the interaction of the fatty acids and starch in a complex system (Lopez-Rubio et al. 2009; Nobrega et al. 2012). According to other authors, the presence of two bands around 1460 and 1380 cm−1 was characteristic of the angular deformation of the C–H bonds in starch (Fan et al. 2012; Guo et al. 2014; Parvinzadeh Gashti et al. 2013; Pascoal et al. 2013).
The starches extracted with water or ethanol showed three characteristic peaks between 1000 and 1256 cm−1, which were attributed to the stretching vibration of C–O–C and C–O–H from glycosidic bonds. The first peak near 1000 cm−1 was ascribed to the C–O stretching of C–O–C in starch, the second peak around 1165 cm−1 was attributed to C–C and C–O–H bond stretching, while the third peak near 1245 cm−1 was associated with the ordered structures of starch (Guo et al. 2014). The primary difference in these three peaks between starches extracted with water or ethanol was that the peak around 1165 cm−1 increased in intensity for the starches extracted with ethanol, indicating that the crystallinity of the polymer was modified. These results were consistent with the modification in the intensity of the peak at 1660 cm−1 observed in the samples extracted with ethanol.
The type of solvent used in the extraction process resulted in a slight change in the ratio of the band intensities of 1047/1022 cm−1 (1.06–0.98) for starch extracted with water and ethanol, respectively, which according to other authors, indicated a decrease in the crystallinity (Kaur et al. 2013). However, the ratio of 1047/1035 cm−1 was not changed as a result of the solvent (water or ethanol). The changes in the crystalline and amorphous region in starch due to the solvent were independent. A similar behavior was reported when different water contents were used in the thermal treatment of potato starch, affecting only the ratio of 1047/1022 cm−1, while no changes were detected in the ratio of 1047/1035 cm−1 over the range of 10–40% water (van Soest et al. 1995).
Ultimately, the bands around 864 and 770 cm−1, which were related to the stretching vibration of C–O–C and C–O–H from glycosidic bonds, confirmed the α–configuration of the glycosidic linkage typical for starch (Capek et al. 2010), and these bands were best observed in the starch extracted with ethanol. The skeletal modes of the pyranose ring showed a weak absorption at 575 cm−1 (Fan et al. 2012; Zhang et al. 2009).
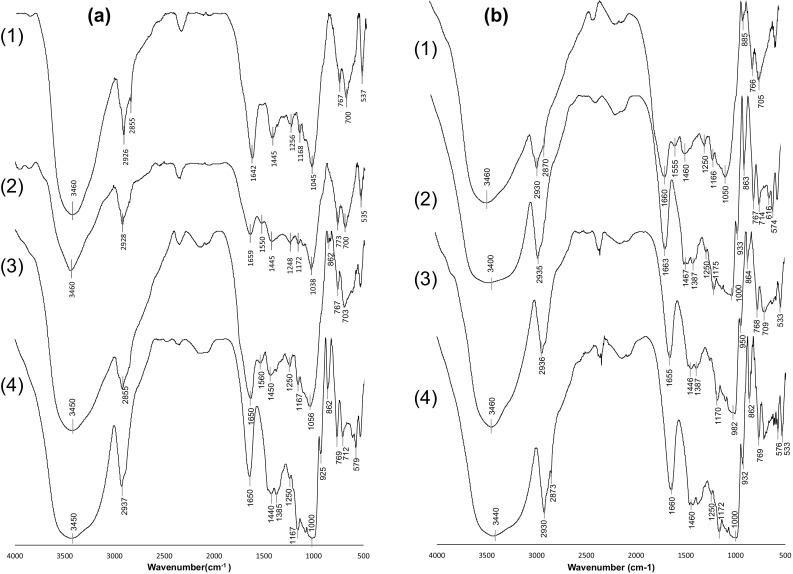
Infrared spectroscopy analysis of structural changes due to thermal treatment
The FT-IR spectra for the starch of ayocote beans after thermal treatment are shown in Fig. 3. A broad, strong peak between 3200 and 3600 cm−1 and a sharper peak at approximately 3400 cm−1 in ayocote bean starches after the thermal treatment was observed. This was possibly due to the presence of fewer hydrogen bonds compared with those in native starch, which was derived from a smaller number of molecules of hydration water, with the effect being more evident in starches extracted with ethanol (Fig. 3b) than in starches extracted with water (Fig. 3a).
Fig. 3.
FT-IR patterns of ayocote bean starches after thermal treatment. a extracted with water, b extracted with ethanol. (1) Dark brown variety; (2) Light brown variety; (3) Purple variety; (4) Black variety
In addition, the appearance of new bands at around 2850 and 1560 cm−1 in thermally treated starch, which was assigned to protein in some cases (Lian et al. 2014), suggested that the ayocote bean protein or lipid may have combined with amylose during thermal treatment. However, Xijun et al. (2014) mentioned that the absence of a C–H stretching vibration near 2850 cm−1 in the IR spectra of starches hydrolyzed by lipase or protease and was attributed to an interaction of amylose and amylopectin without lipid or protein. However, other authors have indicated that the band observed at 2930 cm−1 may be affected by thermal treatment due to starch retrogradation, and for this reason, two absorption bands appeared afterwards (2930 and 2850 cm−1), which were assigned to CH2 vibrations. In addition, the enhancement of the peak around 1260 cm−1 in the starch obtained from thermally treated beans was also a product of the retrogradation process; similar changes were observed in stored tortilla starch (Flores-Morales et al. 2012).
Another change observed in the thermally treated starch was the enhancement of the peaks ranging from 2100 to 2370 cm−1 that may be a combination of bands originating from amides due to the high level of protein and unsaturated fatty acids in the ayocote beans. It was mentioned that the C–H stretching vibrations resulted primarily from the CH2 groups in fats but with a considerable contribution from the C–H bonds in carbohydrates and proteins (Holse et al. 2011). Thus, the interactions among proteins—fatty acids—carbohydrates may have been responsible for this modification.
The ratio between the band intensities of 1047/1022 cm−1 for starches without thermal treatment ranged between 0.98 and 1.06 (for starch extracted with ethanol or water), while the ratio obtained for starches with thermal treatment decreased to values between 0.89 and 0.91 (for starch extracted with water or ethanol). However, the thermal treatment also influenced the ratio between the band intensities of 1047/1035 cm−1. The ratio for starches without thermal treatment was similar for both cases, those extracted with water or ethanol (0.97), while for starches with thermal treatment, a decrease in the ratio to 0.93 and 0.95 (for starch extracted with water or ethanol, respectively) was observed.
Compared with the extraction process, the thermal treatment caused a decrease in the intensity of both band ratios at 1047/1035 cm−1 and 1047/1022 cm−1 and was more evident in the starch extracted with water, which according to other authors, indicated a decrease in crystallinity as well as short-range order (Kaur et al. 2013; van Soest et al. 1995).
Raman spectroscopy analysis of structural changes due to the extraction process
The Raman spectra of the starch samples taken without thermal treatment are presented in Fig. 4. All spectra of starches obtained from unheated ayocote beans are highly similar; consequently, all of the principal characteristic bands for starch are observed, and it is visible that the positions of the observed bands were almost the same but with different intensities.
Fig. 4.
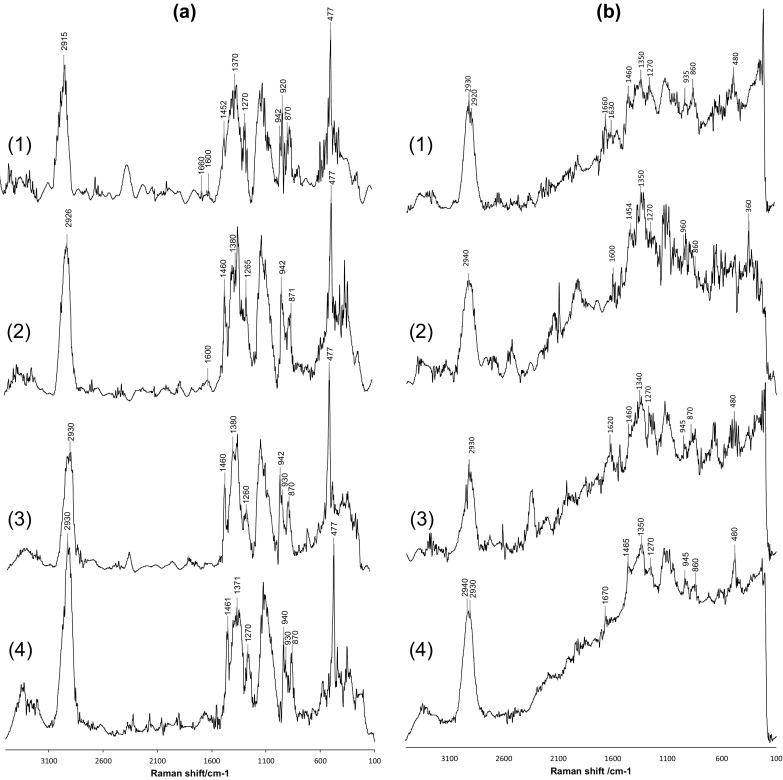
The Raman spectra of ayocote bean starches without thermal treatment. a extracted with water, b extracted with ethanol. (1) Dark brown variety; (2) Light brown variety; (3) Purple variety; (4) Black variety
The patterns in the Raman spectra of starches extracted by the aqueous and ethanolic method were highly similar (Fig. 4a, b) among all ayocote bean varieties, but some differences in the relative intensity were observed in the patterns of Raman spectra of starches extracted with ethanol (Fig. 4b) compared with those extracted with water (Fig. 4a). However, all of the principal characteristic bands for starch were observed, which were associated with amylose and amylopectin; however, unresolved bands were observed in the region near 1700 cm−1, corresponding to glucose, the building block of starch chains.
Some differences in the spectra of starch extracted with ethanol or water were observed in the band around 2930 cm−1. Starch extracted with water showed the most well-defined peak however, starch extracted with ethanol showed a bifurcation in at least three varieties and some authors have reported this bifurcation to CH and CH2 stretching vibrations (Galat 1980).
In the starch extracted with ethanol (Fig. 4b), a band around 1620 cm−1 was observed that originate from C = C stretching in aromatic amino acids (Holse et al. 2011). This may be appropriate considering the high proportion of protein in the ayocote bean seeds; however, other authors have indicated that this band with varying intensity could be correlated with the amount of amylose present in the starch (Flores-Morales et al. 2012).
The characteristic bands for polysaccharides around 1460 cm−1 attributed to δ(CH2) twisting and CH bending and the band near 1370 cm−1 assigned to δ(CH2) and C–OH bending (Łabanowska et al. 2013b) were the most well-defined in the starch extracted with water. A light band at 1260 cm−1 attributed to CH2OH-related deformation, which is characteristic of the amylose V-form (Kizil et al. 2002), was imperceptible in the starch extracted with ethanol.
The band around 942 cm−1 and accompanied by a second peak around 930 cm−1, assigned to the νa and νs of the (C–O–C) α-1,4-glycosidic linkage (Nobrega et al. 2012), was more well defined in the Raman spectra of the starch extracted with water than that extracted with ethanol. In addition, starch extracted with ethanol, a change in intensity and in position was observed. Authors have indicated that a change in the location of the bands assigned to glycosidic linkages can be attributed to the presence of an α-1,6-glycosidic linkage of the amylopectin that shifts the bands to higher wavenumbers around 945 cm−1 (Kizil et al. 2002). The same behavior was observed in other bands characteristic of starches: the band around 870 cm−1 assigned to νs (C–O–C) (Bel Haaj et al. 2013) showed a shift to 860 cm−1 in the starch extracted with ethanol. This change may be related to a decrease in crystallinity caused by the dissolvent. The band around 477 cm−1 is attributed to the skeletal mode of the pyranose ring and was assigned to the (C–O–C) ring mode and the δ(C–C–O) mode, which was present in a lower intensity in the Raman spectra of starches extracted with ethanol. This vibration mode is not stable in the presence of ethanol, influencing the relative intensity and energy of the chemical bonds and groups (Fan et al. 2012).
Raman spectroscopy analysis of structural changes due to thermal treatment
The degradation of ayocote bean starch induced by the thermal treatment was monitored by Raman spectroscopy (Fig. 5). After thermal treatment of starch at 95 °C, the spectra showed a significant increase (approximately threefold) of the background, principally in the range from 1600 to 500 cm−1, indicating that the degradation process diminished the number of carbohydrates. Specifically, the C–C and C–O stretching region (1300–800 cm−1) was sensitive to the degradation process, showing a reduction in the intensity of almost all bands. This result unequivocally indicated structural modifications, leading to the degradation of starch polymers, and this effect was more evident in starch extracted with ethanol after the thermal treatment (Fig. 5b).
Fig. 5.
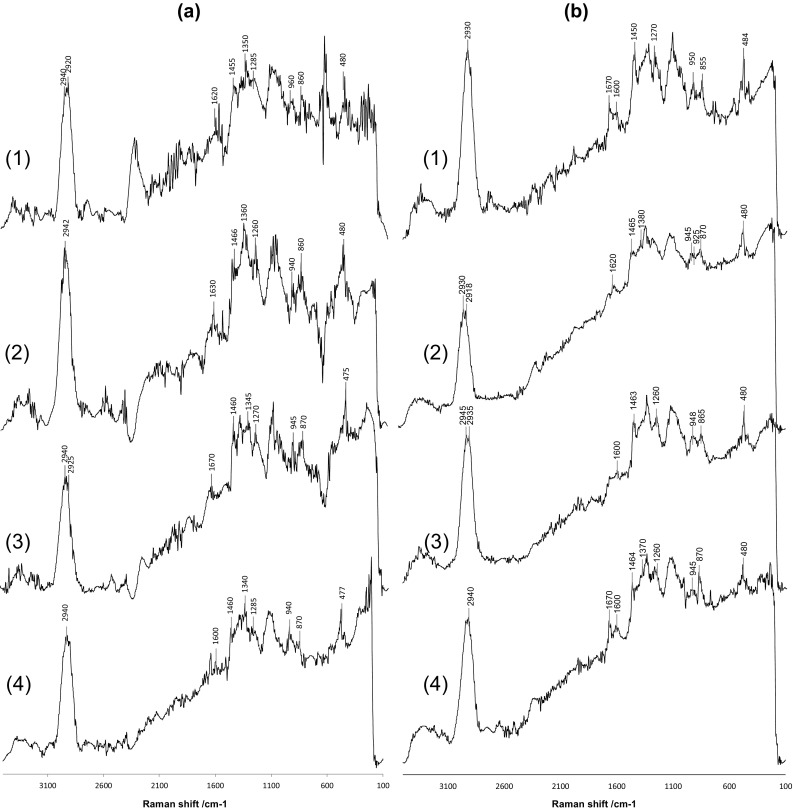
The Raman spectra of ayocote bean starches after thermal treatment. a extracted with water, b extracted with ethanol. (1) Dark brown variety; (2) Light brown variety; (3) Purple variety; (4) Black variety
In particular, the thermal treatment affected the band at 1460 cm−1, which was assigned to the CH2 twisting mode, and the band at 1260 cm−1, was ascribed to a complex mode involving the CH2OH side chain. This effect was more evident in the starch that was extracted with ethanol and thermally treated; however, the largest effect was observed in the band around 1260 cm−1. Similar results were reported by Łabanowska et al. (2013b), who mentioned a significant decrease in the band intensities might be due to the changes in the hydrogen bond network involving CH2OH groups. Other authors indicated that retrograded starch displayed significant changes in the bands assigned to the general starch structures due to the very low sensitivity of the OH groups to Raman excitation (Flores-Morales et al. 2012).
The band at 940 cm−1 assigned to the νa and νs of the (C–O–C) α-1,4-glycosidic linkage lowered its intensity to a higher degree due the easier glycosidic bond cleavage in starch derived from the thermal treatment. This was principally observed in the starch thermally treated and extracted with water (Fig. 5a). The band at around 940 cm−1 was imperceptible in the Raman spectra of the starch thermally treated and extracted with ethanol, confirming that the solvent is the determining factor in the starch modifications.
New bands appear in the Raman spectra of the thermally treated starch at 1676 and 1600 cm−1. These bands were likely due to the nominal C = O stretching and O–H stretching vibrational modes, and according to Flores-Morales et al. (2012), may be due to the presence of lipid chains associated with resistant starch. This confirms the data obtained from the FT-IR spectra of the thermally treated starch.
Conclusion
Starch of the four varieties of ayocote beans showed homogeneity in morphology and structure; however, the extraction method with ethanol damages the starch granules, as observed by the presence of clusters without a defined granular structure and deformation of the starch granule surface. In addition, changes in the FT-IR and Raman spectra patterns were observed due to the extraction solvent. The starch of ayocote beans showed structural changes associated with retrogradation due to the thermal treatment. These changes can be observed using IR and Raman spectroscopy.
Acknowledgements
The authors would like to acknowledge the Tecnológico Nacional de México for the financial support of project number 5938.16-P.A-P and the Autonomous University of Hidalgo State for their technical services during this study.
References
- AOAC . Official methods of analysis of AOAC international. 16. Rockville: AOAC; 1995. [Google Scholar]
- Audu SS, Aremu MO. Effect of processing on chemical composition of red kidney bean (Phaseolus vulgaris L.) flour. Pak J Nutr. 2011;10:1069–1075. doi: 10.3923/pjn.2011.1069.1075. [DOI] [Google Scholar]
- Basra AS. Handbook of seed science and technology. New York: Food Products Press; 2006. [Google Scholar]
- Bel Haaj S, Magnin A, Pétrier C, Boufi S. Starch nanoparticles formation via high power ultrasonication. Carbohydr Polym. 2013;92:1625–1632. doi: 10.1016/j.carbpol.2012.11.022. [DOI] [PubMed] [Google Scholar]
- Capek P, Drábik M, Turjan J. Characterization of starch and its mono and hybrid derivatives by thermal analysis and FT-IR spectroscopy. J Therm Anal Calorim. 2010;99:667–673. doi: 10.1007/s10973-009-0194-1. [DOI] [Google Scholar]
- Correia P, Cruz-Lopes L, Beirão-da-Costa L. Morphology and structure of chestnut starch isolated by alkali and enzymatic methods. Food Hydrocoll. 2012;28:313–319. doi: 10.1016/j.foodhyd.2011.12.013. [DOI] [Google Scholar]
- Dutta H, Paul SK, Kalita D, Mahanta CL. Effect of acid concentration and treatment time on acid-alcohol modified jackfruit seed starch properties. Food Chem. 2011;128:284–291. doi: 10.1016/j.foodchem.2011.03.016. [DOI] [PubMed] [Google Scholar]
- Fan D, Ma W, Wang L, Huang J, Zhao J, Zhang H, Chen W. Determination of structural changes in microwaved rice starch using Fourier transform infrared and Raman spectroscopy. Starch Stärke. 2012;64:598–606. doi: 10.1002/star.201100200. [DOI] [Google Scholar]
- Feng X, Zhang Q, Cong P, Zhu Z. Preliminary study on classification of rice and detection of paraffin in the adulterated samples by Raman spectroscopy combined with multivariate analysis. Talanta. 2013;115:548–555. doi: 10.1016/j.talanta.2013.05.072. [DOI] [PubMed] [Google Scholar]
- Flores-Morales A, Jiménez-Estrada M, Mora-Escobedo R. Determination of the structural changes by FT-IR, Raman, and CP/MAS13C NMR spectroscopy on retrograded starch of maize tortillas. Carbohydr Polym. 2012;87:61–68. doi: 10.1016/j.carbpol.2011.07.011. [DOI] [PubMed] [Google Scholar]
- Gałat A. Study of the Raman scattering and infrared absorption spectra of branched polysaccharides. Acta Biochim Pol. 1980;27:135–142. [PubMed] [Google Scholar]
- Gathu EW, Karuri EG, Njage PMK. Physical characterization of new advanced drought tolerant common bean (Phaseolus vulgaris) lines for canning quality. American J Food Technol. 2012;7:22–28. doi: 10.3923/ajft.2012.22.28. [DOI] [Google Scholar]
- Guo J, Liu L, Lian X, Li L, Wu H. The properties of different cultivars of Jinhai sweet potato starches in China. Int J Biol Macromol. 2014;67:1–6. doi: 10.1016/j.ijbiomac.2014.03.002. [DOI] [PubMed] [Google Scholar]
- Holse M, Larsen FH, Hansen Å, Engelsen SB. Characterization of marama bean (Tylosema esculentum) by comparative spectroscopy: NMR, FT-Raman, FT-IR and NIR. Food Res Int. 2011;44:373–384. doi: 10.1016/j.foodres.2010.10.003. [DOI] [Google Scholar]
- Kaur S, Kaur A, Singh N, Sodhi NS. Effect of shearing on functional properties of starches isolated from Indian kidney beans. Starch/Stärke. 2013;65:808–813. doi: 10.1002/star.201200180. [DOI] [Google Scholar]
- Kizil R, Irudayaraj J, Seetharaman K. Characterization of irradiated starches by using FT-Raman and FTIR spectroscopy. J Agric Food Chem. 2002;50:3912–3918. doi: 10.1021/jf011652p. [DOI] [PubMed] [Google Scholar]
- Łabanowska M, Wesełucha-Birczyńska A, Kurdziel M, Puch P. Thermal effects on the structure of cereal starches. EPR and Raman spectroscopy studies. Carbohydr Polym. 2013;92:842–848. doi: 10.1016/j.carbpol.2012.09.087. [DOI] [PubMed] [Google Scholar]
- Łabanowska M, Wesełucha-Birczyńska A, Kurdziel M, Sepioło K. The mechanism of thermal activated radical formation in potato starch studied by electron paramagnetic resonance and Raman spectroscopies. Carbohydr Polym. 2013;91:339–347. doi: 10.1016/j.carbpol.2012.08.039. [DOI] [PubMed] [Google Scholar]
- Lian X, Wang C, Zhang K, Li L. The retrogradation properties of glutinous rice and buckwheat starches as observed with FT-IR,13C NMR and DSC. Int J Biol Macromol. 2014;64:288–293. doi: 10.1016/j.ijbiomac.2013.12.014. [DOI] [PubMed] [Google Scholar]
- Lopez-Rubio A, Clarke JM, Ben Scherer B, Topping DL, Gilbert EP. Structural modifications of granular starch upon acylation with short-chain fatty acids. Food Hydrocoll. 2009;23:1940–1946. doi: 10.1016/j.foodhyd.2009.01.003. [DOI] [Google Scholar]
- Malik AH, Holm L, Johansson E. Soil and starter fertilizer and its effect on yield and protein composition of malting barley. J Soil Sci Plant Nutr. 2012;12:835–849. [Google Scholar]
- Méndez JP, García FP, Sandoval OAA, Marzo MAM, Gutiérrez ADR. Establishment of quality indices and indicators (QIMB), for fast evaluation of quality to Barley cultivated in the south of the State of Hidalgo, Mexico. Am Eurasian J Agric Environ Sci. 2012;12:1023–1029. [Google Scholar]
- Nobrega MM, Olivato JB, Müller CMO, Yamashita F. Biodegradable starch-based films containing saturated fatty acids: thermal, infrared and Raman spectroscopic characterization. Polímeros. 2012;22:467–474. doi: 10.1590/S0104-14282012005000068. [DOI] [Google Scholar]
- Parvinzadeh Gashti M, Stir M, Bourquin M, Hulliger J. Mineralization of calcium phosphate crystals in starch template inducing a brushite kidney stone biomimetic composite. Cryst Growth Des. 2013;13:2166–2173. doi: 10.1021/cg4002434. [DOI] [Google Scholar]
- Pascoal AM, Di-Medeiros MC, Batista KA, Leles MI, Lião LM, Fernandes KF. Extraction and chemical characterization of starch from S. Lycocarpum fruits. Carbohydr Polym. 2013;98:1304–1310. doi: 10.1016/j.carbpol.2013.08.009. [DOI] [PubMed] [Google Scholar]
- Robyt JF, Choe J, Hahn RS, Fuchs EB. Acid modification of starch granules in alcohols: effects of temperature, acid concentration, and starch concentration. Carbohydr Res. 1996;281:203–218. doi: 10.1016/0008-6215(95)00347-9. [DOI] [Google Scholar]
- Schoch TJ, Maywald EC. Preparation and properties of various legume starches. Cereal Chem. 1968;45:564–573. [Google Scholar]
- Tovar J, Bjoerck IM, Asp NG. Starch content and alpha-amylolysis rate in precooked legume flours. J Agric Food Chem. 1990;38:1818–1823. doi: 10.1021/jf00099a007. [DOI] [Google Scholar]
- van Soest JJ, Tournois H, de Wit D, Vliegenthart JF. Short-range structure in (partially) crystalline potato starch determined with attenuated total reflectance Fourier-transform IR spectroscopy. Carbohyd Res. 1995;279:201–214. doi: 10.1016/0008-6215(95)00270-7. [DOI] [Google Scholar]
- Warsame AO, Kimani PM. Canning quality of new drought-tolerant dry bean (Phaseolus vulgaris L.) lines. American J Food Technol. 2014;9:311–317. doi: 10.3923/ajft.2014.311.317. [DOI] [Google Scholar]
- Xijun L, Haibo S, Lin L, Hong W, Nan Z. Characterizing the chemical features of lipid and protein in sweet potato and maize starches. Starch Stärke. 2014;66:361–368. doi: 10.1002/star.201300145. [DOI] [Google Scholar]
- Zhang L, Xie W, Zhao X, Liu Y, Gao W. Study on the morphology, crystalline structure and thermal properties of yellow ginger starch acetates with different degrees of substitution. Thermochim Acta. 2009;495:57–62. doi: 10.1016/j.tca.2009.05.019. [DOI] [Google Scholar]