Abstract
Membrane-integral pyrophosphatases (mPPases) couple the hydrolysis of pyrophosphate (PPi) to the pumping of Na+, H+, or both these ions across a membrane. Recently solved structures of the Na+-pumping Thermotoga maritima mPPase (TmPPase) and H+-pumping Vigna radiata mPPase revealed the basis of ion selectivity between these enzymes and provided evidence for the mechanisms of substrate hydrolysis and ion-pumping. Our atomistic molecular dynamics (MD) simulations of TmPPase demonstrate that loop 5–6 is mobile in the absence of the substrate or substrate-analogue bound to the active site, explaining the lack of electron density for this loop in resting state structures. Furthermore, creating an apo model of TmPPase by removing ligands from the TmPPase:IDP:Na structure in MD simulations resulted in increased dynamics in loop 5–6, which results in this loop moving to uncover the active site, suggesting that interactions between loop 5–6 and the imidodiphosphate and its associated Mg2+ are important for holding a loop-closed conformation. We also provide further evidence for the transport-before-hydrolysis mechanism by showing that the non-hydrolyzable substrate analogue, methylene diphosphonate, induces low levels of proton pumping by VrPPase.
I. INTRODUCTION
Three types of convergently evolved enzymes hydrolyze inorganic pyrophosphate (PPi): type I and type II soluble pyrophosphatases (sPPases) and membrane-integral pyrophosphatases (mPPases). PPi is generated by at least 190 cellular reactions including DNA biosynthesis and aminoacyl-tRNA generation; thus, tight control of PPi levels in the cell is crucial to prevent product inhibition of these reactions.1–5 sPPases are present in all cells and are primarily responsible for managing cellular PPi levels, with a kcat of ∼200–2000 s−1.6 In contrast, mPPases are slower (kcat of 3–20 s−1), only found in select species,6 and utilize the hydrolysis of PPi to pump ions across a membrane, generating an electrochemical gradient.
Excluding multicellular animals, such as mammals, mPPases are found in organisms across all three domains of life. Plants and algae express mPPases in vacuolar membranes7–9 that, along with the vacuolar (V-type) H+-ATPase, acidify the organelle and are involved in development and stress resistance.10–13 mPPases are also found in the membranes of the acidocalcisome, a relatively small organelle found in protozoan parasites that plays a crucial role during the transition between environments with varying osmotic pressures.14–16 Furthermore, mPPases are present in many bacterial species, several of which are opportunistic human pathogens, such as members of genus Bacteroides.17–19 Overexpression of mPPases in bacteria confers resistance to heat, hydrogen peroxide, and salt stress.20
mPPases are selective in the ions they pump across the membrane: Na+, H+, or both (dual-pumping mPPases). Na+-pumping mPPases, thought to be the ancestral form of the enzyme, and dual-pumping mPPases occur in bacteria, with the former also found in archaea; both of these require potassium for optimal activity.17,21 Plants and protozoans, conversely, contain only H+-pumping mPPases.8 The H+-pumping mPPases are further subdivided into those that require potassium ions for optimal activity and those that do not (K+-dependent and K+-independent types, respectively). The difference is due to a key lysine residue (K12.46, using the Ballesteros and Weinstein numbering system, as previously described22) that can functionally replace K+ in the active site.23
Recently, structures of two mPPases, the Na+-pumping Thermotoga maritima mPPase (TmPPase) and the H+-pumping, K+-dependent Vigna radiata mPPase (VrPPase), have been solved in different conformations by X-ray crystallography.24–26 These static snapshots of different states through the catalytic cycle, such as the resting state and the substrate analogue-bound state, provide insight into the possible mechanism of hydrolysis and ion-pumping. However, proteins can sometimes be forced into non-native conformations due to crystallographic contacts, resulting in artefacts.27 We have generated atomistic molecular dynamics (MD) simulations of the membrane-integral TmPPase within a lipid bilayer that highlight the importance of interactions displayed in the crystal structures, thus strengthening evidence for our proposed model of the catalytic mechanism. In addition, we have recently provided experimental data that support the hypothesis that ion pumping precedes PPi hydrolysis in mPPases,26 and here, we provide further experimental support for this mechanism of action.
A. Overview of mPPase structures
TmPPase has been solved in the resting state (TmPPase:Ca:Mg; PDB: 4AV3),24 substrate analogue imidodiphosphate (IDP)-bound state (TmPPase:IDP:Na; PDB: 5LZQ),26 phosphate analogue tungstate (WO4)-bound state (TmPPase:WO4; PDB: 5LZR),26 and a product-bound state (TmPPase:Pi2; PDB: 4AV6).24 VrPPase has been solved in a substrate analogue imidodiphosphate (IDP)-bound state (VrPPase:IDP; PDB: 4A01) and a single phosphate-bound state (VrPPase:Pi; PDB: 5GPJ).25
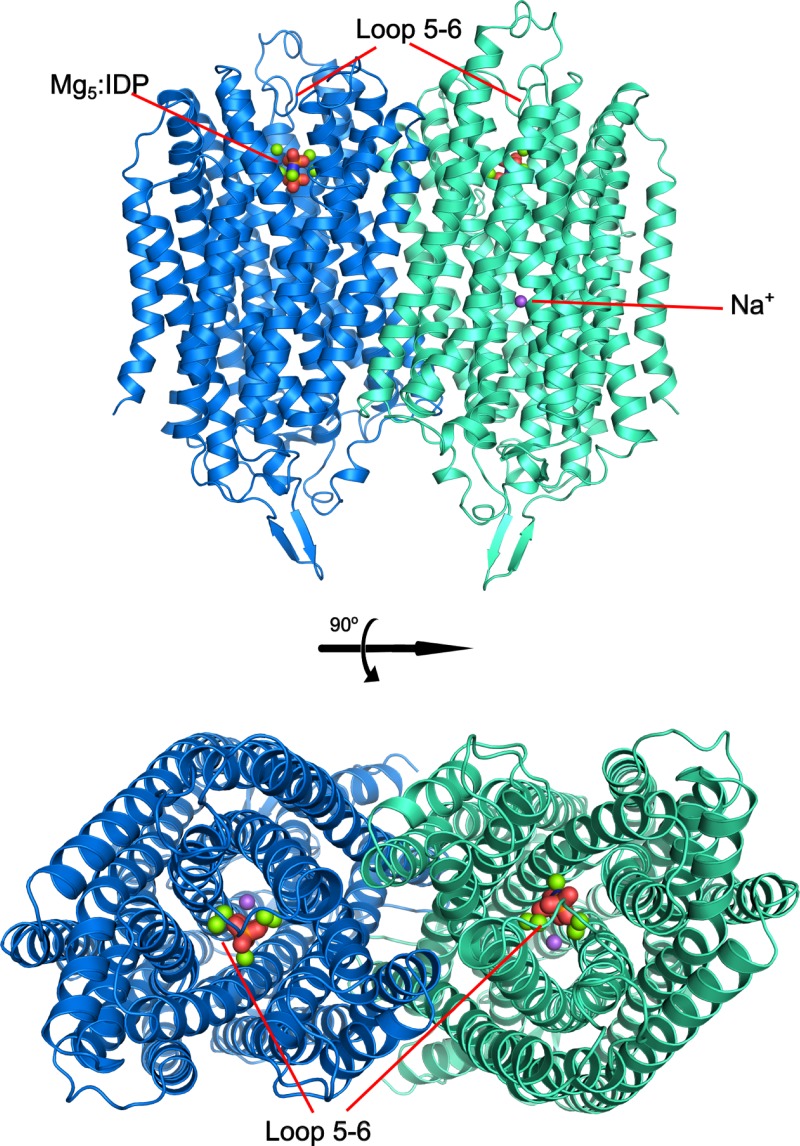
These structures reveal that TmPPase and VrPPase are, overall, very similar (Fig. 1);24,25 for instance, the Cα root-mean-square deviation (RMSD) of the IDP-bound states is only 0.862 Å for 725 aligned residues.
FIG. 1.
Overall protein structure of TmPPase in the substrate-analogue-bound state (PDB ID: 5LZQ). The protein is shown as a dimer with each protomer depicted in a different color. IDP is shown in red with Mg2+ and Na+ shown as green and purple spheres, respectively.
II. RESULTS
A. MD simulations support the mechanism of substrate binding and hydrolysis
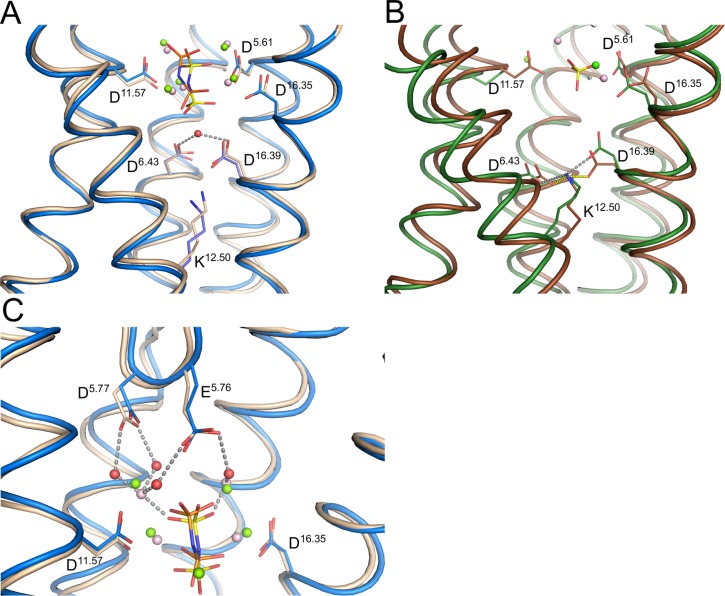
The recently solved structures of mPPase have allowed us to build a comprehensive model for the mechanism of PPi hydrolysis, which we believe occurs via activation of a nucleophilic water molecule. In both TmPPase:IDP:Na and VrPPase:IDP, the nucleophilic water is coordinated by D6.43, a conserved Asp on TMH 6, and D16.39, a conserved Asp on TMH 16 (Ballesteros and Weinstein numbering system22) (Fig. 2(a)). However, in the TmPPase resting structure (TmPPase:Ca:Mg) and the VrPPase single phosphate-bound structure (VrPPase:Pi), D6.43 in particular, is coordinated by K12.50, a key Lys on TMH 12 (Fig. 2(b)). This interaction prevents it from coordinating the nucleophilic water by holding TMH 6 in a strained conformation, thus preventing enzyme activation. The structures also suggest that binding of IDP by both TmPPase and VrPPase leads to a closing of loop 5–6 (the loop between TMH 5 and 6) and loop 13–14 over the active site. A lack of electron density for loop 5–6 in the TmPPase resting state structure suggests that this loop is disordered in the resting state, but the electron density shows that loop 5–6 is closed over the active site in the substrate analogue-bound structures.24–26 Residues E5.76 and D5.77 on loop 5–6 in both VrPPase:IDP and TmPPase:IDP:Na interact with the substrate-analogue Mg5:IDP complex via water molecules in the hydrolytic center, which may contribute to the stability of the loop-closed conformation (Fig. 2(c)). We hypothesize that closing of these loops over the active site is a critical step in the catalytic cycle, coupling correct substrate binding to conformational changes that lead to hydrolysis. The downward movement of TMH 12 that is associated with loop-closure breaks the coordination of K12.50 with D6.43 and D16.39 and releases the torsional deformation of TMH 6, akin to a “molecular mousetrap.” This leads to a reorientation of TMH 6 and allows D6.43 and D16.39 to activate the nucleophilic water, leading to PPi hydrolysis.24–26
FIG. 2.
Structural overview of different regions of the mPPase hydrolytic region in different catalytic states. Comparison of the base of the hydrolytic center in (a) TmPPase:IDP:Na (blue) and VrPPase:IDP (light brown); and in (b) TmPPase:Ca:Mg (green) and VrPPase:Pi (brown). (c) Comparison of the cytosolic side of the hydrolytic center in TmPPase:IDP:Na and VrPPase:IDP. In all structures, water molecules are depicted as red spheres, including the nucleophilic water in (a). Mg2+ and Ca2+ are depicted as green spheres in TmPPase and salmon spheres in VrPPase. IDP and phosphate are depicted with orange phosphorous atoms for TmPPase structures and yellow for VrPPase structures.
However, this proposed mechanism is based on the presently available crystal structures of mPPases, which are static snap-shots and do not provide a complete picture of the intermediate steps of the catalytic mechanism. Furthermore, protein crystals represent lattices of ordered molecules that have reached equilibrium by attaining a global minimum of free-energy. Sometimes, proteins crystallize in a non-native conformation, forgoing biologically relevant interactions to establish crystallographic contacts that lower the free energy of the system.27 Finally, proteins in the solution are subject to thermal noise, which can have dramatic effects on the protein shape and conformation. Knowledge of the nature and magnitude of these conformational changes can be key to understanding biological mechanisms.
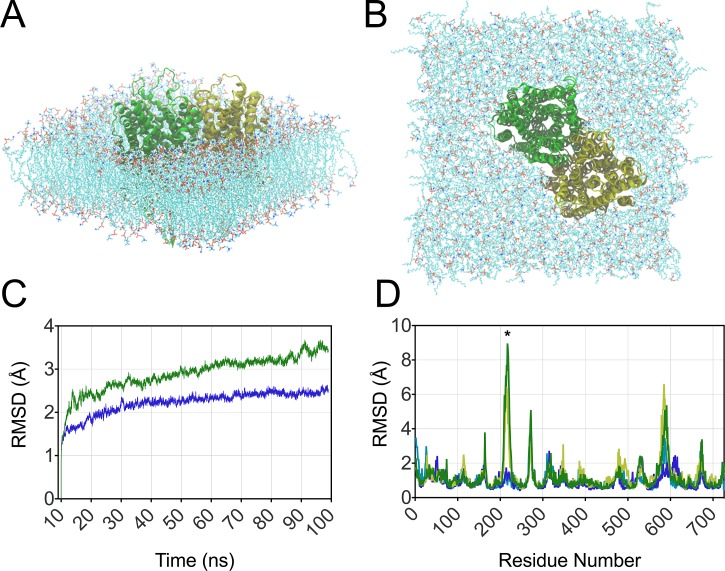
To begin exploring the substrate-induced loop-closing aspects of the catalytic cycle, we performed MD simulations of TmPPase in a self-assembled lipid bi-layer. These are the first MD simulations of this class of proteins, and due to the important role of metal ions within the active site, an all-atom approach was required, which incurs substantial additional computational expense relative to united-atom (where hydrogens are ignored) or coarse-grained MD. Simulations were performed on three different models of TmPPase: the resting state TmPPase structure on to which missing loops 5–6 and 13–14 were modelled (Figs. 3(a) and 3(b)), the IDP-bound TmPPase structure, and the IDP-bound TmPPase structure from which Na+, IDP, and the three magnesium ions associated with IDP were removed (two magnesium ions remained at sites equivalent to the resting state TmPPase structure).
FIG. 3.
Atomistic molecular model of the TmPPase resting state in a 50% mixture of POPE:POPC lipids shown from the side (a) and top (b). The solvent molecules present in the MD simulations are not shown for clarity. (c) RMSD measured over all atoms for the resting (green) and IDP-bound (blue) states over the 100 ns trajectory. (d) Per-residue RMSD fluctuations in TmPPase for the resting protomers (green and yellow) and IDP-bound protomers (blue and cyan). The asterisk highlights loops 5–6 (residues 215–225).
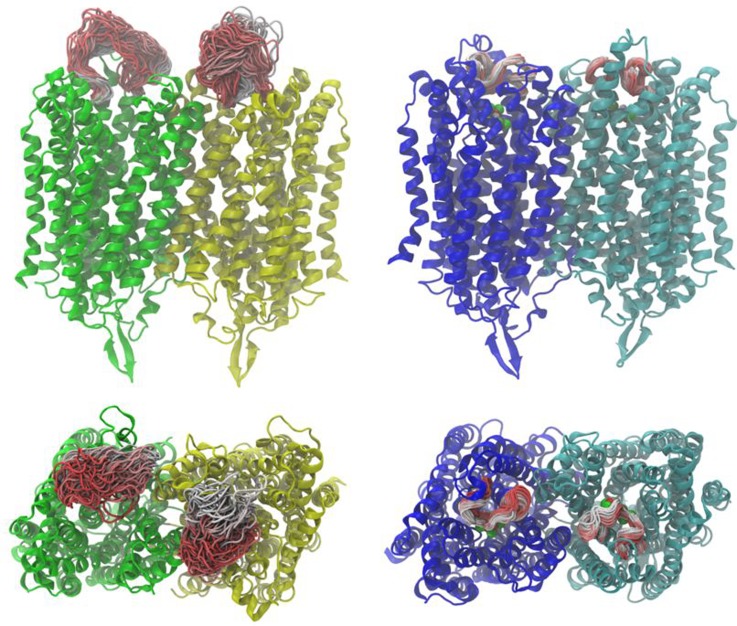
Over a trajectory of 100 ns, the RMSD of all protein atoms in the MD simulations of the resting and IDP-bound models was compared (Fig. 3(c)). These results showed that the resting state was significantly more dynamic than the IDP-bound state. The increase in protein flexibility in the resting state is particularly evident in loop 5–6, which is the most dynamic region, displaying dramatic fluctuations in RMSD (denoted by a star in Fig. 3(d)), with a maximum RMSD fluctuation above 8 in one of the resting state TmPPase protomers. This is in contrast to MD simulations of the IDP-bound state that, consistent with the x-ray structural results, showed much smaller fluctuations of loop 5–6 (2 maximum). Furthermore, the range of different conformations adopted by loop 5–6 over the course of the 100 ns MD simulation was much greater for the resting state structure compared to the IDP-bound structure (Fig. 4).
FIG. 4.
Side and top views of the resting (left, green and yellow protomers) and IDP-bound (right, blue and cyan protomers) TmPPase states, showing the range of conformations explored by loop 5–6 during the 100 ns MD. Colors in the loop indicate the position in the trajectory, ranging from red (start) to white (end). The IDP and magnesium ions are shown in space filling representation in red and green, respectively.
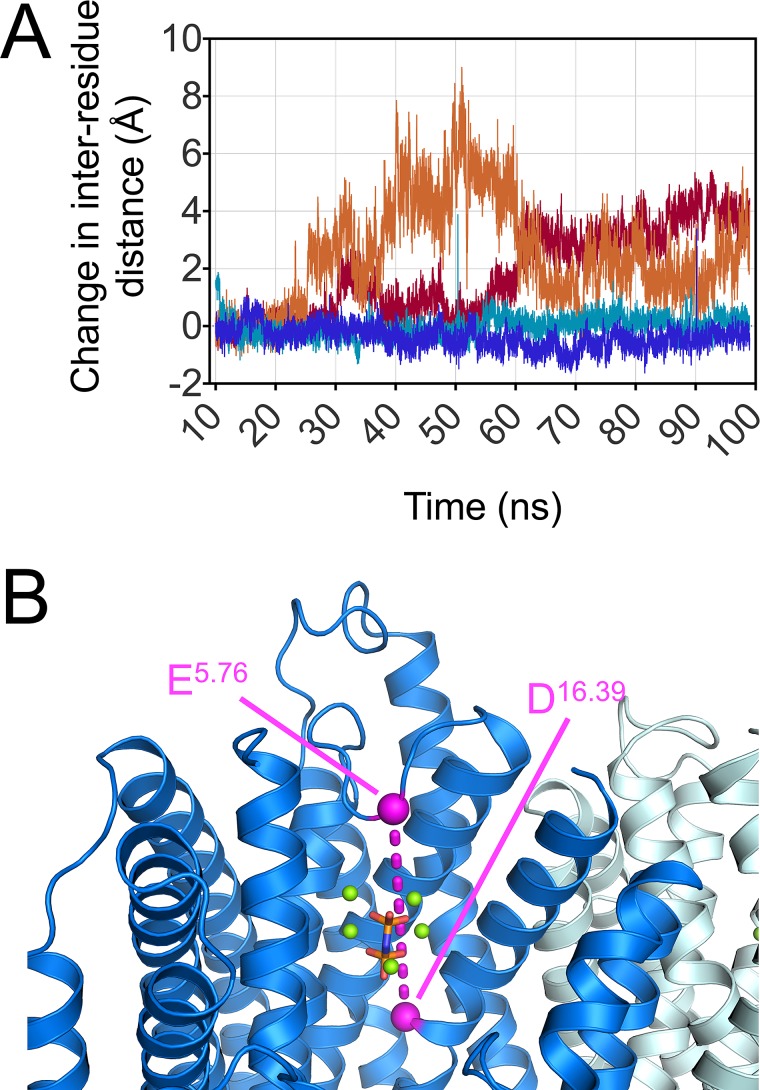
In addition to the difference between the resting state and the IDP-bound state, we wanted to observe what might happen to loop 5–6 once the substrates were no longer available to constrain it; this would provide information on how the substrate binds to the enzyme. We monitored the difference in distance between Glu217 (E5.76), which is central to loop 5–6, and Asp696 (D16.39), a relatively motionless residue, over the course of MD simulations of both the IDP-bound TmPPase structure and the IDP-bound TmPPase structure from which Na+, IDP, and the three magnesium ions associated with IDP were removed (Fig. 5). These results show that in the presence of the substrate, there is a 2 change of distance between these two residues in either direction. However, once the substrate is removed, the loop immediately becomes more dynamic, resulting in an increase in distance between these two residues of up to 9 over the time course (Fig. 5(a)), corresponding to an outward movement of loop 5–6 as if uncovering the active site pocket.
FIG. 5.
(a) Distance between Glu217 (E5.76) and Asp696 (D16.39) in each protomer when IDP is bound (blue and cyan) and when it has been removed from the pocket (red and orange). (b) IDP-bound structure of TmPPase highlighting the Glu217 (E5.76) and Asp696 (D16.39) as pink spheres. The pink dashed line represents the inter-residue distance measured in the simulations in (a). IDP is shown in red with Mg2+ shown as green spheres.
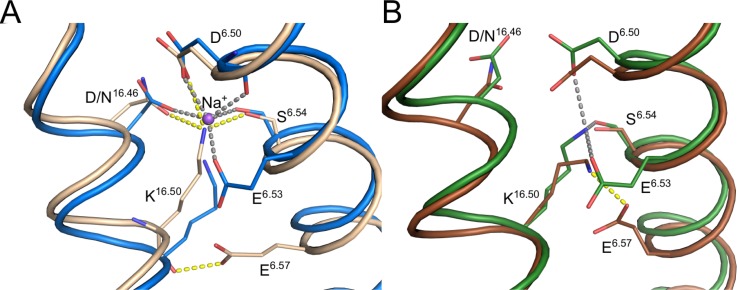
Taken together, these results suggest that interactions of the enzyme with IDP and Na+, such as IDP-Mg2+-H2O-E5.76, IDP-Mg2+-H2O-D5.77 (Fig. 2(c)), and Na+ with the residues E6.53, D6.50, S6.54, and D16.46 (Fig. 6(a)), as seen in the crystal structure,31 maintain the loop-closed, substrate-bound conformation of TmPPase. Therefore, removing the substrate results in a movement back to an open-loop, resting state-like conformation.
FIG. 6.
Structural overview of the ion-gate region of mPPases. (a) Comparison of the substrate-analogue-bound states of TmPPase (blue) and VrPPase (light brown) showing the coordination of the bound sodium ion (purple sphere) with neighboring residues of TmPPase and coordination of residues in the VrPPase ion gate. (b) Comparison of the resting state of TmPPase (green) with the phosphate-bound state of VrPPase (brown), highlighting the coordination of residues around the ion gate. Interactions between residues in TmPPase structures are shown in grey and VrPPase in yellow.
B. Overview of ion pumping in mPPases
Unlike PPi hydrolysis, the mechanism of ion pumping and ion selectivity is more elusive although the recently solved structures do give us some insights into possible mechanisms. The key region of the enzyme responsible for ion selectivity and pumping is the ion-gate (Fig. 6), which sits 10 below the active site in the channel formed by the inner ring of helices. For TmPPase, we could compare all three states (TmPPase:IDP:Na, TmPPase:WO4, and TmPPase:Ca:Mg), but for VrPPase, only the substrate-bound and single product-bound states were available (VrPPase:IDP and VrPPase:Pi). However, the structural architecture of the ion-gate in TmPPase:WO4 and the resting state TmPPase:Ca:Mg is not significantly different, and therefore, we treat TmPPase and VrPPase:Pi structures as equivalent in terms of interpreting differences in ion pumping (Fig. 6).
One key difference between the Na+-pumping TmPPase and the H+-pumping VrPPase in the ion-gate region is the location of the semi-conserved Glu (E6.53 and E6.57, respectively), which is one helix turn lower on the VrPPase compared to the TmPPase (Fig. 6). The importance of the semi-conserved Glu position becomes evident in the formation of the ion-gate in the resting or Pi-bound structures. In TmPPase, the ion-gate is formed by coordination of K16.50 with D6.50 and E6.53, whereas a salt-bridge between K16.50 and E6.57 forms the ion-gate in VrPPase (Fig. 6(b)). The K16.50-E6.57 interaction prevents K16.50 from coordinating with D6.50. In the IDP-bound TmPPase (Fig. 6(a)), E6.53 coordinates the Na+, along with residues D6.50, S6.54, and D16.46. The movement of TMH 16 down 1.1 in TmPPase moves K16.50 out of the Na+-binding pocket. This allows Na+ to bind, which is then coordinated by D6.50, E6.53, and S6.54. In this structure, the Na+ is still positioned above the ion-gate. In contrast, E6.57 (the semiconserved Glu) in the IDP-bound VrPPase structure (Fig. 6(a)) is not coordinated to K16.50, which is instead coordinated to D6.50, S6.54, and D/N16.46.24–26 Therefore, E6.57 is most likely protonated, possibly by the proton that will be pumped.
C. Support for the transport-before-hydrolysis mechanism
The structures suggest that conformational changes upon IDP or substrate binding lead to nucleophilic water coordination and are linked to additional changes that promote ion pumping.24–26 Despite the logical interpretation of the crystallographic data, we do not yet know whether PPi hydrolysis precedes ion pumping or whether ion pumping leads to PPi hydrolysis.6 The former idea suggests that PPi binding to mPPase results in conformational changes, such as the closing of the loops and repositioning of residues that coordinate the nucleophilic water, thus leading to activation of the nucleophilic water and PPi hydrolysis. Generation of the phosphate product would then induce further conformational changes that result in ion pumping. The latter idea implies that substrate binding drives pumping, in other words, conformational changes induced by substrate binding reposition D6.43 so that it can coordinate the nucleophilic water alongside D16.39 (Fig. 2(a)), but PPi is not hydrolysed at this point; indeed, it is possible that one of the aspartates is protonated. The structural changes induced by PPi binding first promote ion pumping, which increases the negative charge in the active site and so causes a deprotonation of the general base D6.43 and/or D16.39. This activates the water nucleophile, leading to hydrolysis, i.e., ion pumping drives substrate hydrolysis.
Although all-atom classical MD simulations can provide insights into conformational changes of proteins in the solution over 100 ns timescales, there are still several limitations to this method. In regard to determining whether ion transport occurs before or after substrate hydrolysis, one major limitation is the inability to break covalent bonds and thus actually hydrolyze the substrate during the simulation. Therefore, complementary experimental approaches are required to fully understand the catalytic cycle of mPPases.
We have recently published data that support the latter mechanism, in which substrate binding drives ion pumping and is then followed by PPi hydrolysis.26 We used the SURFE2R N1, from Nanion technologies, to directly measure the movement of charge across a membrane. In the presence of PPi, VrPPase translocates protons across the membrane as expected.26 However, in the presence of IDP, a non-hydrolyzable substrate analogue that has nitrogen in the place of the PPi central oxygen atom, the ion translocation current was lower.26 When gramicidin was added alongside IDP, the current was decreased to the level of the phosphate control.26 This suggested that binding IDP by VrPPase results in a single turnover ion-pumping event. Since IDP is not converted into the product, it remains bound to VrPPase, preventing further ion translocation and thus generating a reduced current compared to PPi. Gramicidin permeabilizes the membrane to monovalent cations and dissipates H+ gradients across membranes, thus explaining the background levels of current when added with IDP.26
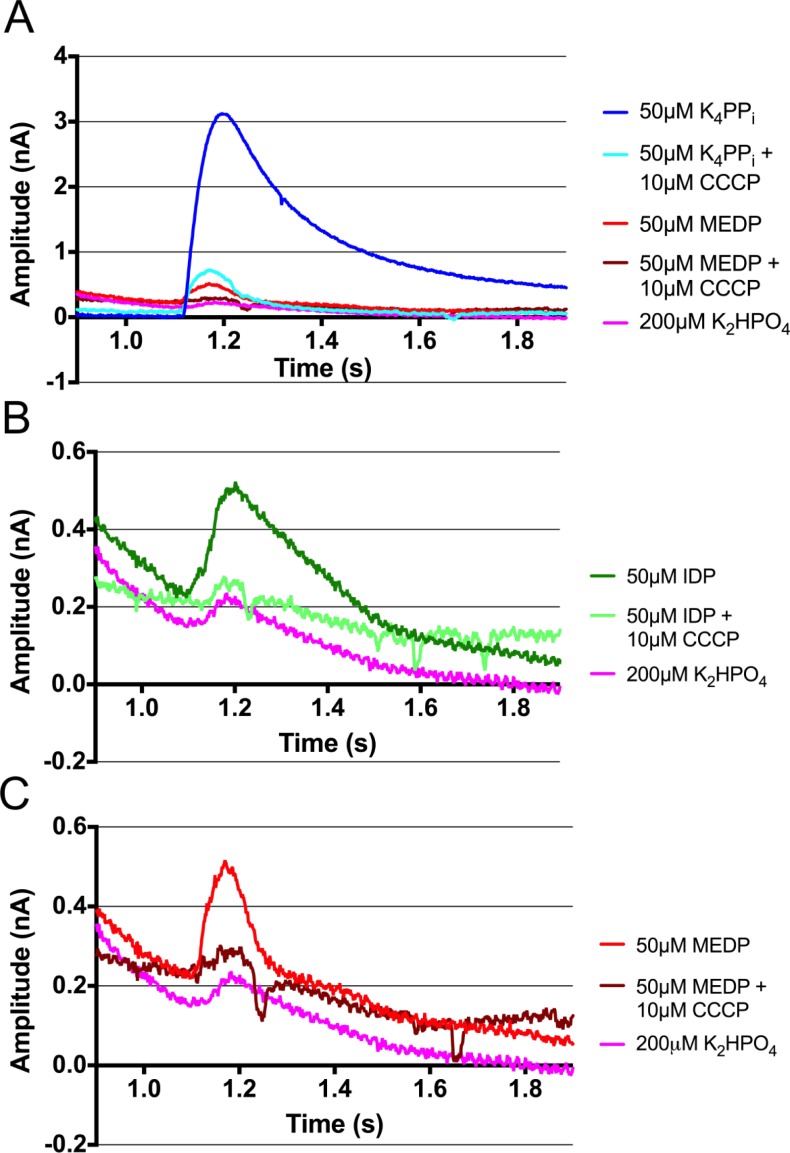
We have new ion-pumping evidence that further supports the transport-before-hydrolysis model for mPPases. Carbonyl cyanide m-chlorophenyl hydrazine (CCCP) specifically permeabilizes membranes to protons. Addition of CCCP to membrane-embedded VrPPase in the presence of PPi reduces the ion-pumping current from 3.10 nA to 0.65 nA above the baseline (Fig. 7(a)), illustrating that the translocation of charge across the membrane is due to H+ and not other monovalent ions, such as K+. The reduced current is not as low as the phosphate control (0.08 nA above the baseline), possibly because the rate of energy-driven proton pumping by VrPPase is greater than the CCCP-assisted diffusion rate of protons across the membrane. Replicating the previous IDP experiments shows similar results,26 with a small, ion-pumping peak of 0.27 nA above the baseline (Fig. 7(b)). However, replacing gramicidin with CCCP to collapse the charge separation over the membrane illustrates that IDP-bound VrPPase specifically pumps protons, as a reduced change in a current of 0.07 nA is observed. VrPPase in the presence of another substrate analogue, methylene diphosphonate (MEDP), similarly produces a change in a current of 0.29 nA (Fig. 7(c)), comparable to that observed with IDP. MEDP contains a carbon atom in place of the central oxygen atom of PPi and therefore cannot be hydrolysed by mPPases. The low level of current, as seen with IDP, further supports our theory that ion pumping does not require substrate hydrolysis and instead occurs upon substrate binding. In the presence of both MEDP and CCCP, only background levels of current are measured (0.06 nA above the baseline), thus confirming the movement of charge across the membrane upon MEDP binding, and a single turn-over pumping event is due solely to H+.
FIG. 7.
Electrometric measurements of VrPPase proteoliposomes using the Nanion SURFE2R N1. Currents obtained following the addition of (a) K4PPi, MEDP, K2HPO4, and all three in the presence of the protonophore: CCCP; (b) IDP, K2HPO4, and IDP with CCCP; and (c) MEDP, K2HPO4, and MEDP with CCCP. All compounds were added in the activating buffer at the 1-s time point.
III. CONCLUSIONS
The numerous structures of the Na+-pumping TmPPase and the H+-pumping VrPPase determined by X-ray crystallography have provided insights into how this class of proteins hydrolyzes PPi and pump ions across the membrane.24–26 However, to further understand the catalytic cycle, we are working towards constructing in silico systems that allow us to probe aspects of the mechanism that are inaccessible by X-ray crystallography, such as transition states that are energetically unstable and exist on the femtosecond timescale.28 Towards this goal, we have performed atomistic MD simulations of TmPPase in a self-assembled lipid bi-layer that show dramatic changes in flexibility of loop 5–6 between TmPPase in the resting state, IDP-bound state, and when IDP and Na+ are removed from the IDP bound state (Figs. 4–6).
Our findings suggest that tight contacts between TmPPase and the bound Mg5:IDP complex (Fig. 2(c)) and Na+ (Fig. 6(a)) help to maintain a loop-closed conformation that has previously been observed in the crystal structures, dispelling concerns that this interaction was due to a crystallographic artefact. In addition, atomistic MD simulations may be helpful in structure-based drug design, for assessing the magnitude of thermodynamically unfavourable changes both in conformational flexibility associated with binding and in the design of additional compounds with related chemical scaffolds. Since mPPases are not found in humans, targeting these proteins in human pathogens, such as protozoan parasites or Bacteroides species, is a viable option and would carry a reduced risk of human toxicity.29 One strategy would be to combine structural data with computer modelling by first identifying the binding site of the initial hit compound by X-ray crystallography. This structure can then be used as a starting point for a virtual screen to identify compounds with greater affinities. More detailed atomistic MD simulations could then be employed for the most promising leads. The top hits would then be synthesized and tested in vitro, before restarting the in silico cycle of the compound design.
Resolving the multiple steps of the mPPase reaction cycle will require employing additional approaches to overcome the limitations of classical MD simulations. Here, we have also provided further experimental evidence to support our hypothesis that substrate binding, not substrate hydrolysis, leads to ion pumping during the catalytic cycle of mPPases. MEDP, a non-hydrolysable substrate analogue, induces a small ion-pumping peak in VrPPase, similar to that observed with IDP (Figs. 7(a) and 7(c)).26 We interpret this as evidence that binding of a substrate analogue, which cannot be hydrolysed, leads to one cycle of H+-pumping in the VrPPase.26 Furthermore, the use of CCCP instead of gramicidin to dissipate the charge differential across the membrane proves that VrPPase is specifically pumping protons in the presence of PPi, IDP, and MEDP (Fig. 7), and the currents observed are not due to motion of potassium ions, as was possible in the previous gramicidin experiments.
Despite recent progress, there are still many unanswered questions. For example, what is the structural basis for ion selectivity in dual pumping mPPases, which pump both Na+ and H+? The IDP-bound structures show that the placement of the semi-conserved Glu in the VrPPase (E6.57) one helix turn below the position in the TmPPase (E6.53) destroys the Na+-binding pocket and that E6.57 in VrPPase acts as a proton acceptor at the end of the ion-channel Grotthuss chain (Fig. 6(a)).25,26 However, in dual-pumping mPPases, this Glu is in the same position as in Na+-pumping mPPases (E6.53). This issue is further complicated by the recent discovery that the dual-pumping mPPases evolved over two separate lineages and are therefore sub-classified into two groups. One lineage, the “true” dual-pumpers, co-transports Na+ and H+ over a range of Na+ concentrations, whereas the second lineage, the Na+-regulated dual-pumpers, loses the ability to pump H+ at above-physiological levels of Na+.30 Determining the molecular structure of dual-pumping mPPases in each lineage may give clues as to the flexibility of these enzymes in terms of ion selectivity, as well as the mechanism for pumping two ions. MD simulations could contribute in answering how these two lineages of dual-pumping mPPases differ in their method of ion pumping.
IV. MATERIALS AND METHODS
A. Ion-pumping measurements
VrPPase was reconstituted into liposomes and used to obtain electrometric measurements using the Nanion SURFE2R N1 following the protocol used in our previous publication.26 A reconstituted protein is added to proprietary sensor chips following standard protocols from Nanion technologies (details in Ref. 26). The sensor is rapidly switched between a control buffer (containing no substrate or inhibitor) and an activating buffer (containing substrate and/or inhibitor) over the course of 3 s, during which the amplitude is measured across the membrane. 50 μM of the substrate (K4PPi) or inhibitors (IDP and MEDP) were used in the activating buffer in separate experimental runs, and 200 μM K2HPO4 was used as a control. 10 μM CCCP was used to destabilise the proton gradient. All experiments were carried out on a single sensor chip to negate the effects of inter-sensor variation, and all experiments involving CCCP were carried out after initial measurements with inhibitors to avoid residual effects of the protonophore in the membranes. The change in current was calculated by subtracting the baseline value, before the rise in the signal, from the maximal peak value.
B. Molecular dynamics simulations
To generate the input co-ordinates for MD simulations of the resting state, loops 5–6 and 13–14 were built into the structure above the active site in an orientation that is parallel to the protomer channel, as there was no electron density reported for these loops.24 The missing amino acids 211–221 and 577–595 of chain A and 212–220 and 584–598 of chain B were added using software MODELLER 9v14 (Ref. 31) with default settings in the Discovery Studio 4.5 platform.32 Eight generated models underwent visual evaluation, and among these, the representative with loops not locating within the membrane bilayer was selected as a starting point for the simulation. This modified TmPPase resting state, the IDP-bound state, and the IDP-state after removal of the ligands (IDP, three Mg2+, and Na+) were then embedded in a membrane consisting of a 50% mixture of phosphatidylethanolamine (POPE) and phosphotidylcholine (POPC) lipids, which was of sufficient dimension to ensure at least 8 Å between the protein and the edge of the simulation box. The simulation cells were ∼135 Å2 in size in the plane of the membrane and contained 496 lipids in total. The protein, ligand, and lipids were modelled with the AMBER ff12SB, GAFF, and Lipid14 force fields, respectively,33–35 and long range electrostatics was treated with the Particle Mesh Ewald technique. The protein and membrane were then solvated with TIP3P water molecules and 0.1 M KCl using the CHARMM Molecular Modelling Builder36 and, after a standard equilibration procedure, were subjected to 100 ns MD at constant temperature and pressure using the Berendsen temperature and pressure coupling schemes within the AMBER suite of programs,37 with an MD timestep of 2 fs. Data analysis was performed using the PTRAJ module of AMBER,38 and trajectories were visualised using Visual Molecular Dynamics.39 The atomistic model built for the protein and lipid bilayer is shown for the resting state in Figs. 3(a) and 3(b).
In the first 10 ns of the MD simulations, we observed rapid and noisy fluctuations in the data as the system came to equilibrium, and for this reason, we excluded the initial 10 ns of the simulation from analysis. Consequently, in order to calculate the changes in RMSD and distances between residues, instead of taking the values of the initial frames of the MD simulation as a reference structure, an average of all states between 10 and 20 ns of the respective MD simulations was used in calculations.
ACKNOWLEDGMENTS
This research was supported by grants to A.G. from BBSRC (ALERT-13 and BB/M021610/1), Erkon Säätiö, and Academy of Finland (12522061); to C.W. (Leeds 110 anniversary scholarship) and to N.R.S. from European Commission Grant (Marie Skłodowska-Curie Actions, Horizons 2020 BACTODRUG), and to Y.-J.S. from the Ministry of Science and Technology, Taiwan (104-2311-B-007-006-MY3 and 105-2627-M-007-005), and Academia Sinica, Taiwan (AS-103-TP-B11). We thank Dr. Lars Jeuken for assistance with using the Nanion SURFE2R N1 (European Research Council (FP/2007-2013)/ERC No. 280518).
Author contributions
A.G. conceived the study; N.R.S. wrote the manuscript and performed the comparisons; K.-M.L. and Y.-J.S. provided the VrPPase protein and unpublished results; C.W. performed the Nanion SURFE2R experiments; A.T. conducted the loop modelling; and S.H. and S.P.D.H. performed the molecular dynamics simulations. All authors read and corrected the manuscript.
References
- 1. Cooperman B. S., Baykov A. A., and Lahti R., Trends Biochem. Sci. , 262 (1992). 10.1016/0968-0004(92)90406-Y [DOI] [PubMed] [Google Scholar]
- 2. Lahti R., Microbiol. Rev. , 169 (1983). [DOI] [PMC free article] [PubMed] [Google Scholar]
- 3. Klemme J. H., Z. Naturforsch. C , 544 (1976). [DOI] [PubMed] [Google Scholar]
- 4. Heinonen J. K., Biological Role of Inorganic Pyrophosphate ( Springer Science & Business Media, 2001). [Google Scholar]
- 5. Terkeltaub R. A., Am. J. Physiol. Cell Physiol. , C1 (2001). [DOI] [PubMed] [Google Scholar]
- 6. Kajander T., Kellosalo J., and Goldman A., FEBS Lett. , 1863 (2013). 10.1016/j.febslet.2013.05.003 [DOI] [PubMed] [Google Scholar]
- 7. Serrano A., Pérez-Castiñeira J. R., Baltscheffsky M. et al. , IUBMB Life , 76 (2007). 10.1080/15216540701258132 [DOI] [PubMed] [Google Scholar]
- 8. Drozdowicz Y. M. and Rea P. A., Trends Plant Sci. , 206 (2001). 10.1016/S1360-1385(01)01923-9 [DOI] [PubMed] [Google Scholar]
- 9. Björn L. O., Photobiology ( Springer, 2015), pp. 207–230. [Google Scholar]
- 10. Brini F., Hanin M., Mezghani I. et al. , J. Exp. Bot. , 301 (2007). 10.1093/jxb/erl251 [DOI] [PubMed] [Google Scholar]
- 11. Lv S. L., Lian L. J., Tao P. L. et al. , Planta , 899 (2009). 10.1007/s00425-008-0880-4 [DOI] [PubMed] [Google Scholar]
- 12. Li X., Guo C., Gu J. et al. , J. Exp. Bot. , 683 (2014). 10.1093/jxb/ert442 [DOI] [PMC free article] [PubMed] [Google Scholar] [Retracted]
- 13. Park S., Li J., Pittman J. K. et al. , Proc. Natl. Acad. Sci. U.S.A. , 18830 (2005). 10.1073/pnas.0509512102 [DOI] [PMC free article] [PubMed] [Google Scholar]
- 14. Scott D. A., de Souza W., Benchimol M. et al. , J. Biol. Chem. , 22151 (1998). 10.1074/jbc.273.34.22151 [DOI] [PubMed] [Google Scholar]
- 15. Marchesini N., Luo S., Rodrigues C. et al. , Biochem. J. , 243 (2000). 10.1042/bj3470243 [DOI] [PMC free article] [PubMed] [Google Scholar]
- 16. Lemercier G., Dutoya S., Luo S. et al. , J. Biol. Chem. , 37369 (2002). 10.1074/jbc.M204744200 [DOI] [PubMed] [Google Scholar]
- 17. Luoto H. H., Baykov A. A., Lahti R. et al. , Proc. Natl. Acad. Sci. U.S.A. , 1255 (2013). 10.1073/pnas.1217816110 [DOI] [PMC free article] [PubMed] [Google Scholar]
- 18. Luoto H. H., Nordbo E., Malinen A. M. et al. , Biochem. J. , 281 (2015). 10.1042/BJ20141434 [DOI] [PubMed] [Google Scholar]
- 19. Wexler H. M., Clin. Microbiol. Rev. , 593 (2007). 10.1128/CMR.00008-07 [DOI] [PMC free article] [PubMed] [Google Scholar]
- 20. Yoon H.-S., Kim S.-Y., and Kim I.-S., J. Appl. Genet. , 129 (2013). 10.1007/s13353-012-0117-x [DOI] [PubMed] [Google Scholar]
- 21. Luoto H. H., Belogurov G. A., Baykov A. A. et al. , J. Biol. Chem. , 21633 (2011). 10.1074/jbc.M111.244483 [DOI] [PMC free article] [PubMed] [Google Scholar]
- 22. Tsai J. Y., Kellosalo J., Sun Y. J. et al. , Curr. Opin. Struct. Biol. , 38 (2014). 10.1016/j.sbi.2014.03.007 [DOI] [PubMed] [Google Scholar]
- 23. Belogurov G. A. and Lahti R., J. Biol. Chem. , 49651 (2002). 10.1074/jbc.M210341200 [DOI] [PubMed] [Google Scholar]
- 24. Kellosalo J., Kajander T., Kogan K. et al. , Science , 473 (2012). 10.1126/science.1222505 [DOI] [PubMed] [Google Scholar]
- 25. Lin S. M., Tsai J. Y., Hsiao C. D. et al. , Nature , 399 (2012). 10.1038/nature10963 [DOI] [Google Scholar]
- 26. Li K.-M., Wilkinson C., Kellosalo J. et al. , Nat. Commun. , 13596 (2016). 10.1038/ncomms13596 [DOI] [PMC free article] [PubMed] [Google Scholar]
- 27. Krissinel E., J. Comput. Chem. , 133 (2010). 10.1002/jcc.21303 [DOI] [PubMed] [Google Scholar]
- 28. Schwartz S. D. and Schramm V. L., Nat. Chem. Biol. , 551 (2009). 10.1038/nchembio.202 [DOI] [PMC free article] [PubMed] [Google Scholar]
- 29. Shah N. R., Vidilaseris K., Xhaard H. et al. , AIMS Biophys. , 171 (2016). 10.3934/biophy.2016.1.171 [DOI] [Google Scholar]
- 30. Nordbo E., Luoto H. H., Baykov A. A. et al. , Biochem. J. , 3099 (2016). 10.1042/BCJ20160529 [DOI] [PubMed] [Google Scholar]
- 31. Sali A. and Blundell T. L., J. Mol. Biol. , 779 (1993). 10.1006/jmbi.1993.1626 [DOI] [PubMed] [Google Scholar]
- 32.BIOVIA Discovery Studio, Discovery Studio Modeling Environment ( Dassault Systèmes, San Diego, 2016). [Google Scholar]
- 33. Hornak V., Abel R., Okur A. et al. , Proteins , 712 (2006). 10.1002/prot.21123 [DOI] [PMC free article] [PubMed] [Google Scholar]
- 34. Wang J., Wolf R. M., Caldwell J. W., et al. , J. Comput. Chem. , 1157 (2004). 10.1002/jcc.20035 [DOI] [PubMed] [Google Scholar]
- 35. Dickson C. J., Madej B. D., Skjevik A. A. et al. , J. Chem. Theory Comput. , 865 (2014). 10.1021/ct4010307 [DOI] [PMC free article] [PubMed] [Google Scholar]
- 36. Brooks B. R., Brooks C. L., MacKerell A. D. et al. , J. Comput. Chem. , 1545 (2009). 10.1002/jcc.21287 [DOI] [PMC free article] [PubMed] [Google Scholar]
- 37. Case D. A., Betz. R. M., Botello-Smith W., Cerutti D. S., Cheatham T. E. III, Darden T. A., Duke R. E., Giese T. J., Gohlke H., Goetz A. W., Homeyer N., Izadi S., Janowski P., Kaus J., Kovalenko A., Lee T. S., LeGrand S., Li P., Lin C., Luchko T., Luo R., Madej B., Mermelstein D., Merz K. M., Monard G., Nguyen H., Nguyen H. T., Omelyan I., Onufriev A., Roe D. R., Roitberg A., Sagui C., Simmerling C. L., Swails J., Walker R. C., Wang J., Wolf R. M., Wu X., Xiao L., York D. M., and Kollman P. A., AMBER 2016 ( University of California, San Francisco, 2016). [Google Scholar]
- 38. Roe D. R. and Cheatham T. E. III, J. Chem. Theory Comput. , 3084 (2013). 10.1021/ct400341p [DOI] [PubMed] [Google Scholar]
- 39. Humphrey W., Dalke A., and Schulten K., J. Mol. Graphics , 33 (1996). 10.1016/0263-7855(96)00018-5 [DOI] [PubMed] [Google Scholar]


