Abstract
t1 noise appears as random or semi-random spurious streaks along the indirect t1 (F1) dimension of a 2D or nD NMR spectrum. It can significantly downgrade spectral quality, especially for spectra with strong diagonal signals such as NOESY, because useful and weak cross-peaks can be easily buried under t1 noise. One of the significant contributing factors to t1 noise is unwanted and semi-random F2 signal modulation during t1 acquisition. As such, t1 noise from different acquisitions is unlikely to correlate with each other strongly. In the case of NOESY, co-addition of multiple spectra significantly reduces t1 noise compared with conventional acquisition with the same amount of total acquisition time and resolution.
Keywords: NMR, t1 noise suppression, NOESY, 2D spectroscopy, frequency fluctuation
Introduction
One of the major contributors to reduced quality for a 2D or multidimensional NMR spectrum is t1 noise. It appears as a streak of noise or modulated spurious signals along the indirect dimension. For NOESY, the t1 noise problem is particularly acute, and the cause has been generally attributed to instrument imperfections or instability [1-3]. Further analysis shows that sample temperature control issues can cause unwanted signal modulations in the F1 (t1) dimension, while the spectrometer console may also be directly responsible [4-8]. Careful temperature control for various spectrometer components has allowed significant reduction of t1 noise [6], and randomized data sampling in the t1 dimension is proposed [7]. However, these two methods may not be cost-effective all the time. For the first remedy, the associated comprehensive component analysis and control of multiple spectrometer components may not be always feasible; furthermore, some of the components may not be significant contributors. The second approach, on the other hand, does not always guarantee satisfactory results and introduces a few inconveniencies for the operators: randomized t1 increments need to be generated in a way that may not be readily modified at will to accommodate the necessary acquisition time in the F1 dimension; random t1 sampling and associated data shuffling frequently prevent timely spectral evaluation, and the experiment may not be terminated before the full dataset is acquired.
As such, alternative remedies are still sought after in the NMR community. In one particular case when t1 noise from a strong signal prevents observation of adjacent weaker cross-peaks, selective saturation of that strong signal has been employed in MAS NMR [9]. On the other hand, various post-acquisition methods have been proposed [10-12]. Nevertheless, these methods do not address the root causes of t1 noise, and hence should only be used as a last resort. Pulsed field gradients, along with pulse phase cycling, are very powerful in suppressing coherence- pathway-dependent artifacts but are not effective in overcoming t1 noise [13]. Nor does superficial improvement of signal-to-noise ratio by more scans seem sufficient.
Based on the authors' experience, the prevalence or severity of the t1 noise problem is much worse than many operators realize or are ready to acknowledge, even for spectrometers that meet manufacturer's specifications and seem to function well for most applications. A simple yet effective t1 artifact suppression method without modification of the current standard operational procedure is still highly desired. In this manuscript we propose such an experimental method for t1 noise suppression. Using NOESY as an example, we show that a significant source of the observed t1 noise is an apparent unwanted amplitude modulation for directly observed (F2 frequency domain) signals. Data acquisitions with only the minimum number of scans required to complete the necessary phase-cycling, frequently exhibit less relative t1 noise. Co-adding multiple independently acquired 2D minimum-scan datasets can further reduce this noise when compared to conventional acquisitions with the same total experimental time and resolution.
Materials and Methods
2D NOESY spectra were acquired for a 5 mM lysozyme sample in 90% H2O / 10% D2O (Wilmad-LabGlass, Vineland, NJ) using an 800 MHz Bruker AV-III spectrometer equipped with a 5 mm TXI Z-gradient room temperature probe. This system shares a room with a 600 MHz spectrometer and a 400 MHz magnet wide-bore spectrometer. The room's size is about 15 m × 13 m with a ceiling height of 10 m.
N2 gas for sample temperature control, with a flow rate of 670 L/h, was cooled by a chiller to about 4°C before entering the probe. The sample temperature was controlled by a BVT 3000 unit, which was adaptively tuned at the desired temperature (25 °C). The real-time sample temperature was reported by a Bruker BTO 2000 thermocouple with the reference junction compensation built inside the probe. The sample was pre-equilibrated to room temperature for 10 min before insertion into the magnet. Acquisitions started 20 minutes or more after the sample insertion. Auto-shim was turned on during all acquisitions, and the sample temperature recorded every minute for most acquisitions. The ambient room temperature was monitored by a data logger every 15 minutes. During all acquisitions we did not observe any significant physical activity in the area which would give us concerns for causing t1 noise.
Other spectrometer operating conditions were typical, such as the vendor-provided pulse program (noesygpph19 in Bruker TOPSPIN2.1pl6), a sample temperature of 25 °C and a sample volume of about 600 μL in a 5 mm NMR tube. Acquisition parameters included an NOE mixing time of 100 ms, a relaxation delay of 1.8 s, and a sweep width of ca. 16 ppm for both F1 and F2 with acquisition times of 0.02 s and 0.2 s, respectively. F1 quadrature detection was achieved through the States-TPPI method. To compare t1 noise suppression, two acquisition schemes were adopted: in the conventional scheme, data were acquired with 64 scans, resulting in an experimental time of 20 hours; in the co-add scheme, 8 datasets, each with 8 scans, were collected sequentially. For statistical analysis, each scheme was repeated independently for three times.
For the frequency drift test, 1D proton spectra were acquired for a sample containing 0.1 mg/ml GdCl3 and 0.1% DSS (4,4-dimethyl-4-silapentane-1-sulfonic acid) in 99% D2O at 25 °C for 32 minutes.
For 2D data processing, raw data were summed for the eight sets of 8-scan NOESYs that were acquired sequentially in the co-addition scheme (the result was the same if the 8 spectra were processed first and added later) before further operation. All raw data were processed with the standard procedure, including a cosine-bell square window function and modest zero-filling (leading to a final spectral data matrix of 2048 (F2) × 1024 (F1) real points) prior to Fourier transformation, phase corrections and automatic baseline corrections in F2.
Results and Discussions
Fig. 1A shows a representative 800 MHz 2D NOESY spectrum of the lysozyme sample obtained by the conventional acquisition (64 scans per t1 increment for a total acquisition time of 20 h). The ambient room temperature, the spectrometer sample temperature reading and control appear to be very stable during the acquisition (Figs. 1B and 1C). However, t1 noise along the F1 (vertical) dimension is clearly observed in the spectrum regions displaying relatively intense aromatic and methyl chemical shifts in the F2 dimension, even when the spectrum is plotted with modest contour levels. As an example, in the upper-right corner, the vertical double-headed arrow shows a streak of t1 noise with an F2 chemical shift of -1.5 ppm.
Figure 1.
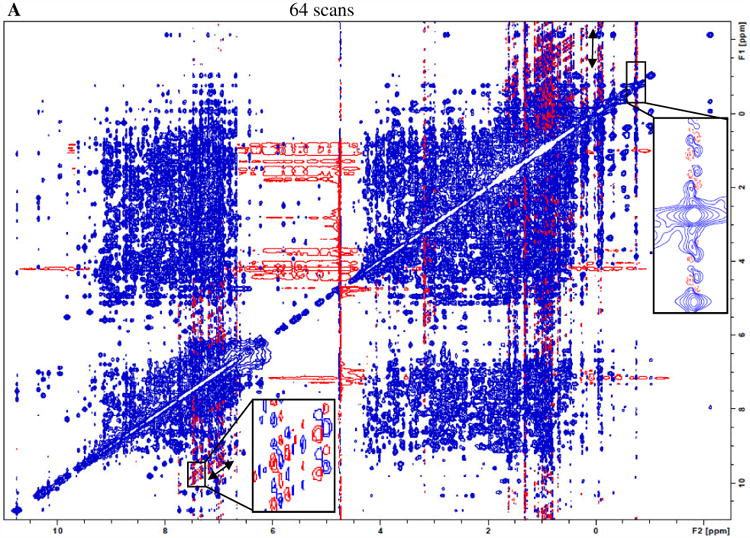
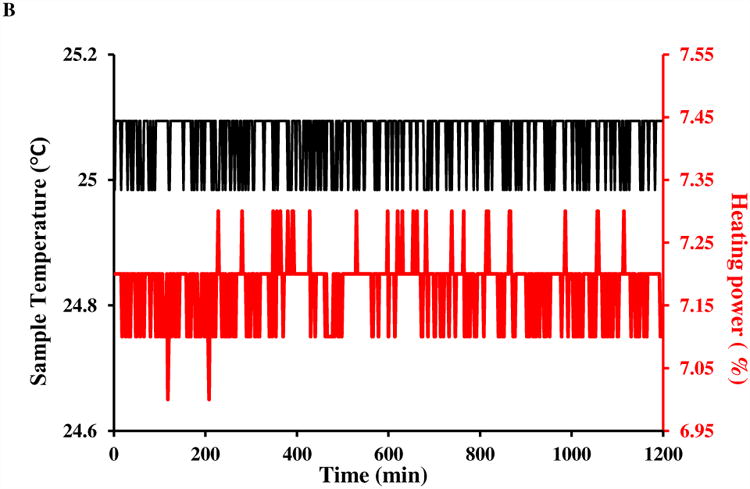
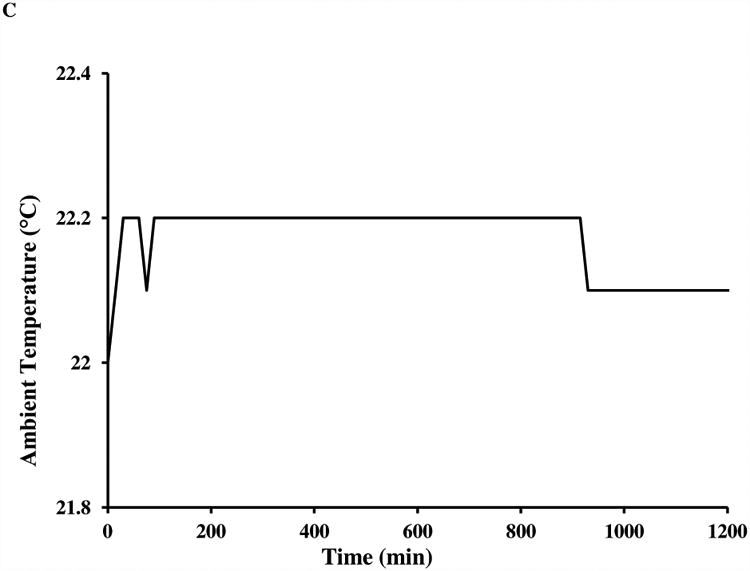
A) An 800 MHz NOESY spectrum with conventional acquisition of 64 scans for 5 mM lysozyme in H2O:D2O=90%:10% at 25 °C. The regions with F2 chemical shift between 6.7 and 7.7 ppm, and between 0.8 and 2.7 ppm show more severe t1 noise (streaks) than others. Both the real-time sample temperature control (sample temperature and heating power are shown in part B) and ambient temperature (shown in part C) were deemed to be satisfactory throughout the data acquisition.
The t1 noise may possess certain characteristics (Supplemental Information Fig. 1 gives a schematic summary). A cursory examination of the experimental spectra reveals its symmetry properties. The inset in Fig 1A upper right-hand corner shows that t1 streaks are comprised of a set of peaks with mirror symmetry about the spectral normal plane with the F1 chemical shift of the corresponding diagonal. Upon further examination, a t1 noise peak appears to be dispersive in both F2 and F1 dimensions. The boxed inset in Fig. 1A lower left corner shows spurious t1 noise peaks with certain frequency intervals, each of which contains four quadrants: two diagonal components having one sign and two anti-diagonals having the opposite. In this particular example, the spurious signals have intensities as high as 1% of the corresponding diagonals. As many interesting NOE cross-peaks are expected to have intensities in this range or lower, the t1 noise observed can present challenges for data analysis.
Furthermore, the solid double-headed arrow in the lower left inset of the spectrum in Fig. 1A clearly shows bands of noise parallel to the diagonal (“parallel diagonal” bands [7]), suggesting that observed t1 noise peaks may have a common cause. The frequency modulation of the diagonal signals along the F1 dimension can be understood as the F2 signal's amplitude modulation in the t1 time domain. Higher intensity signals observed in the F2 dimension therefore are more likely to be associated with higher amplitude of t1 noise streaks.
When we acquire multiple NOESY spectra with the same experimental setup (i.e. back-to-back acquisitions), the general quadrant pattern for a t1 noise peak is frequently preserved. However, its relative intensity and distance to the diagonal tend to vary, suggesting that the modulation frequency and amplitude in the F1 frequency domain acquisition (e.g. t1 noise) are semi-random and lack long-term self-correlation. In other words, t1 noise varies from one NOESY acquisition to another, even when the pulse sequence and experimental parameters (such as the relaxation delay, pulse length or pulsed field gradients) remain the same. Therefore, t1 noise peaks from independently acquired spectra do not constructively co-add. As a result, t1 noise reduction can be achieved by co-adding replicate spectra with shorter acquisition time.
As such, an alternative for the above 64-scan conventional NOESY is the acquisition with eight spectra with 8 scans each (minimal number of scans required by its phase cycling), followed by their time-domain data summation. The overall (random) signal-noise-ratio and total net experimental time are expected to be the same as those of the conventional acquisition with 64 scans, but the t1 noise by co-addition of the eight 8-scan spectra is expected to be reduced. Fig. 2A shows the results of the sum of eight 8-scan lysozyme NOESY spectra (processed and plotted the same way as the data in Fig. 1A). The t1 noise is significantly lower in Fig. 2A. In fact, the t1 noise in many regions is reduced to an extent greater than the expected reduction of √8 for random noise (see discussion of Tables 1 and 2 below).
Figure 2.
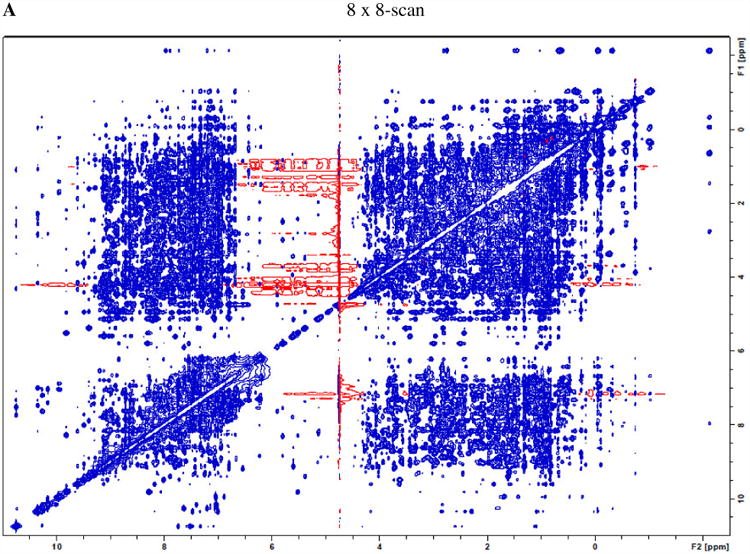
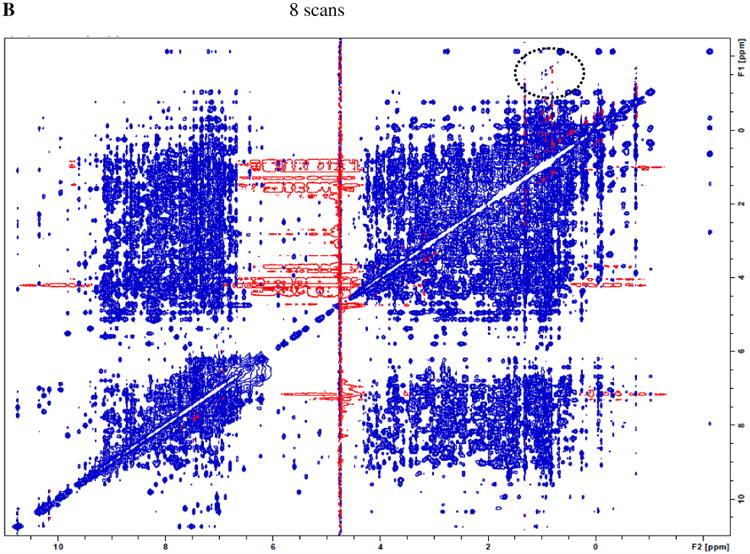
A) co-addition of eight NOESY spectra (each with 8 scans) of lysozyme shows a much lower level of t1 noise compared to Fig. 1A, as “parallel diagonal” bands are largely absent. B) A representative 8-scan NOESY (intensity multiplied by 8) shows that shorter acquisition time helps t1 noise suppression, as the dashed circle area exhibits improvements in t1 noise reduction over conventional acquisition of Fig. 1A with 64 scans.
Table 1.
Statistical analysis of the RMS amplitudes of t1 noise and random noise, and the amplitude of a genuine cross-peak in the selected regions shown in Fig 3. The 8 × 8-scan co-addition method has the same total acquisition time as the conventional 64-scan method. Datasets (conventional and co-add) labeled with #1 were acquired sequentially together. Datasets #2 and #3 were acquired together but at a different time from #1. 8 × 8-scan co-addition method led to more than 75% reduction of t1 noise over the conventional 64-scan method, partly because its individual 8-scan spectrum can achieve about 50% t1 reduction in this region. The complete data entries can be found in Table S1.
| Lysozyme NOESY | Percent RMS of t1 noise* | Percept RMS of random noise* | Percent intensity of an a genuine peak* |
|---|---|---|---|
| 64-scan #1 | 0.34 | 0.004 | 0.43 |
| 64-scan #2 | 0.90 | 0.004 | 0.40 |
| 64-scan #2 | 0.60 | 0.004 | 0.40 |
| 8 × 8-scan #1 | 0.08 | 0.004 | 0.42 |
| 8 × 8-scan #2 | 0.16 | 0.004 | 0.40 |
| 8 × 8-scan #3 | 0.10 | 0.004 | 0.39 |
| 8-scan #1 (8 sets) | 0.16 +/- 0.04 | 0.01 +/- 0.0005 | 0.41 +/-0.04 |
| 8-scan #2 (8 sets) | 0.20 +/- 0.03 | 0.01 +/- 0.0006 | 0.42 +/- 0.1 |
| 8-scan #3 (8 sets) | 0.16 +/- 0.07 | 0.01 +/- 0.0005 | 0.42 +/- 0.1 |
: Normalized by the max intensity of diagonal region with F2: -0.71 to -0.77 ppm and F1: -0.71 to -0.77 ppm
Table 2.
Statistical analysis of the RMS amplitudes of t1 noise and random noise, and the amplitude of a genuine cross-peak in the selected regions shown in Fig S2. The 8 × 8-scan co-addition method has the same total acquisition time as the conventional 64-scan method. Datasets (conventional and co-add) labeled with #1 were acquired sequentially together. Datasets #2 and #3 were acquired together but at a different time from #1. 8 × 8-scan co-addition method led to more than 75% reduction of t1 noise over the conventional 64-scan method, partly because its individual 8-scan spectrum can achieve about 50% t1 reduction in this region. The complete data entries can be found in Table S2.
| Lysozyme NOESY | Percent RMS of t1 noise* | Percent RMS of random noise* | Percent intensity of a genuine peak* |
|---|---|---|---|
| 64-scan #1 | 0.15 | 0.010 | 1.41 |
| 64-scan #2 | 0.39 | 0.011 | 1.97 |
| 64-scan #2 | 0.24 | 0.010 | 1.59 |
| 8 × 8-scan #1 | 0.02 | 0.009 | 1.41 |
| 8 × 8-scan #2 | 0.04 | 0.011 | 1.44 |
| 8 × 8-scan #3 | 0.05 | 0.010 | 1.49 |
| 8-scan #1 (8 sets) | 0.06 +/- 0.01 | 0.027 +/- 0.001 | 2.07 +/- 0.06 |
| 8-scan #2 (8 sets) | 0.12 +/- 0.02 | 0.029 +/- 0.002 | 2.06 +/- 0.11 |
| 8-scan #3 (8 sets) | 0.11 +/- 0.03 | 0.030 +/- 0.001 | 2.06 +/- 0.11 |
: Normalized by the max intensity of diagonal region with F2: 10.20 to 10.13ppm and F1: 10.20 to 10.13 ppm.
A plausible explanation for larger than expected t1 noise reduction is that the individual 8-scan spectra possess lower level t1 noise. Fig. 2B shows that it is indeed the case. The 8-scan 2D NOESY spectrum (one of the eight spectra that are summed for Fig. 2A) has a lower t1 noise level than that of a longer acquisition with 64 scans (Fig. 1A) but noticeably more than the co-added spectra in Fig 2A. Together these results demonstrate t1 noise is reduced by summation of multiple experiments with fewer scans.
To quantify the benefits of our co-addition method over the conventional acquisition, t1 the noise level estimated from the Root Mean Square (RMS) of intensity was analyzed for regions of the lysozyme NOESY spectra with the conventional acquisition of 64 scans (Fig. 1A), 8 scans (Fig. 2B), or 8 × 8-scan co-addition (Fig .2A). The reproducibility and statistical validation of the co-addition method was established by acquisition of three independent NOESY datasets under the same spectrometer conditions.
The t1 noise and random noise were quantified in two regions: one up-field defined in Fig 3 and one down-field defined in SI Fig 2. In each region, RMS values are calculated for all raw data points within the rectangular areas of the spectrum encompassing either t1 noise or random noise. The amplitude of a cross-peak or a diagonal peak (responsible for the t1 noise) is determined from the maximum intensity. The RMS values of t1 and random noise, and the intensity for a nearby signal are expressed as a percentage of the diagonal, which is the source of t1 noise.
Figure 3.
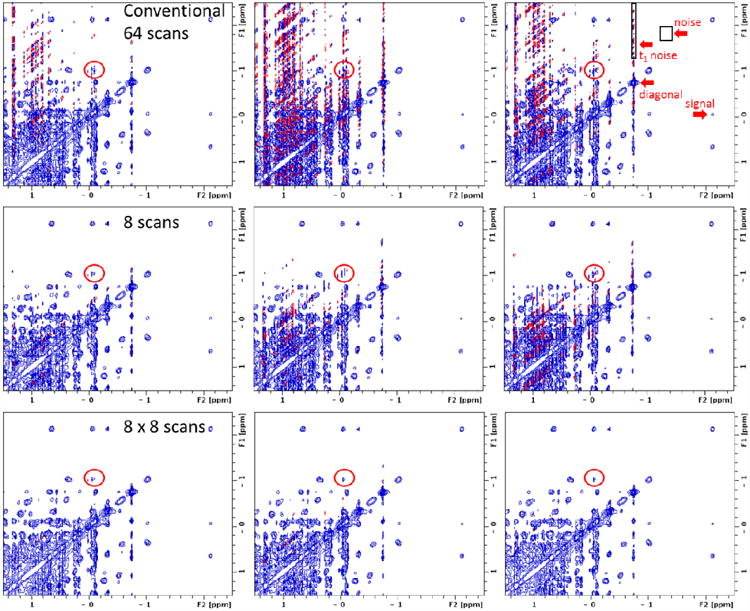
Direct comparison of three NOESY acquisition methods (aliphatic region of lysozyme). From top to bottom, the acquisition methods are: conventional with 64 scans per increment; 8 scans per increment (plotted with intensities scaled up by a factor of 8); sum of eight 8-scan per increment spectra (8 × 8-scan co-addition). From left to right, each acquisition is repeated three times. Red circles show a cross-peak that can be clearly and consistently identified in the 8 × 8-scan co-addition (bottom row) but not as clearly in 8-scan only (middle row) or not at all by conventional 64-scan (top row) spectra. Regions selected for statistical analysis of t1 noise, random noise and a genuine cross-peak (Table 1) are labeled on the top-right spectrum.
The results provided in Tables 1 and 2 clearly demonstrate the benefit of co-addition of multiple experiments with shorter acquisition time in reducing NOESY t1 noise. The percent RMS for t1 noise or random noise and percent intensity for cross-peak are reported, along with standard deviations for the sets of eight 8-scan spectra.
Table 1 shows results for the up-field t1 noise region defined in Fig 3. The RMS t1 noise ranges from 0.3% to 0.9% of the diagonal intensity in a conventional 64-scan NOESY. The large variation of t1 noise among these three 64-scan datasets suggests a potential influence coming from external factors. On the other hand, an adjacent genuine cross-peak intensity is estimated to be ∼0.4% in all three spectra. If a genuine cross-peak of the same intensity were to appear in the t1 streak region, then it could not be readily recognized in the 64-scan spectrum. In the 8 × 8-scan co-addition spectra, the t1 noise RMS of the same region becomes 0.08% to 0.16%, achieving a t1 noise reduction of more than 75%. As such, the cross-peak of similar percent amplitude (0.4%) could be clearly recognized in all three co-add spectra. Random noise in both conventional (64 scans) and co-addition (8 × 8-scan) are a similar value approximately equal to √8 that of the single 8-scan spectra, and much lower level than t1 noise, suggesting the co-addition method does not alter the random noise level compared with the conventional acquisition. Furthermore, even after its significant reduction by the current method, t1 noise still remains one of the main factors influencing spectrum quality and thus warrants the efforts towards further suppression.
In Table 2 the results obtained for a down-field region (defined in Fig. 2B in SI) provide a very similar amount of t1 noise reduction (>75%) achieved by our co-addition method, and the intensity of an adjacent cross-peak RMS of random noise is consistent for the spectra from the 64-scan and 8 × 8-scan co-addition experiments. We note that the normalizing diagonal signal intensity in this region is about 40% of that in table 1. As such, the random noise in both regions on an absolute scale is comparable.
There are potentially two mechanisms to explain the t1 noise reduction by co-addition in Tables 1 and 2. First, t1 noise for different acquisitions may not be fully the same in terms of apparent phase and modulation frequency. Co-addition can therefore lead to some cancellation. Second, t1 noise amplitude is reduced in each of the eight spectra that were only acquired with 1/8 of conventional acquisition time. Presumably, F2 modulation frequency amplitude (deviation from mean) is smaller within a shorter acquisition time frame. In both Tables 1 and 2, the relative t1 noise of the 8-scan spectra is consistently less than half of that of the 64-scan.
Due to the semi-randomness of t1 noise, the amount of t1 noise reduction may vary, even for the same spectrometer (64-scan datasets #2 and #3 acquired at a different time show higher t1 noise than #1). Nevertheless, we never failed to achieve t1 noise reduction, compared with conventional acquisition with the same total experimental time, in any of our attempts using the same co-addition method. Specifically, we have had success with a Bruker Avance-DRX 500 MHz spectrometer with a TXI cryoprobe, a second Bruker Avance-DRX 500 MHz spectrometer with a BBFO probe and our own Bruker AV-III 800 MHz spectrometer after the installation of a new QCI cryoprobe (data available by request). On the other hand, if the t1 noise for a conventional acquisition is comparable with random noise, then the co-addition method is not expected to offer tangible benefits in t1 noise suppression.
Hence it should be stressed that the advantage of our co-addition method is greater when the t1 noise is significantly higher than the random noise of a given spectrum. In Table 1 (up-field region), the t1 noise intensity of the conventional acquisition is at least 80 times that of the random noise in the region and the co-addition method appeared to have the biggest improvement in spectrum (Fig. 2A).
In the current study, we believe the sample temperature fluctuation is a significant contributor to unwanted F2 frequency modulations. Presumably this temperature fluctuation is caused by external factors such as room temperature control and probe gas control. As long as long as these influencing factors remain largely random, the co-addition method is likely to be effective in t1 noise suppression.
Though we can control the sample temperature reasonably well nowadays (within +/-0.1 °C fluctuation), improvement may be still needed if high quality spectrum is desired. In fact, sample temperature fluctuation as small as 0.02 °C is sufficient to generate as much as 1% t1 noise (relative to the diagonal) for certain samples. To complicate the situation, a temperature gradient can lead to more than 1 °C variation in temperature within the sample [14]. To demonstrate the difficulty in the actual sample temperature control, we monitored a similar sample (0.1 % DSS in 99% D2O) under the same condition for the same spectrometer for 32 minutes.
In Fig. 4A, the residual water signal resonance frequency remains essentially constant (well within 0.2 Hz variation), as expected. On the other hand, the DSS methyl resonance frequency (Fig. 4B), relative to that of water, drifts around 0 Hz over the same period of time, with a maximal deviation more than 1 Hz from the mean. With an 800 MHz resonance frequency, this corresponds to more than 0.1 °C in temperature change. However, Fig. 4C shows the thermocouple-reported sample temperature (black line) without any tangible fluctuation, while the heating element power (red line) varies only slightly. In a different hardware set up which suffers a less severe t1 noise problem, the observed frequency drift is significantly decreased (with a QCI cryoprobe for the same spectrometer; data not shown). As such, there seems to be strong correlation between the actual sample temperature control (or apparent frequency drift) and the observed t1 noise.
Figure 4.
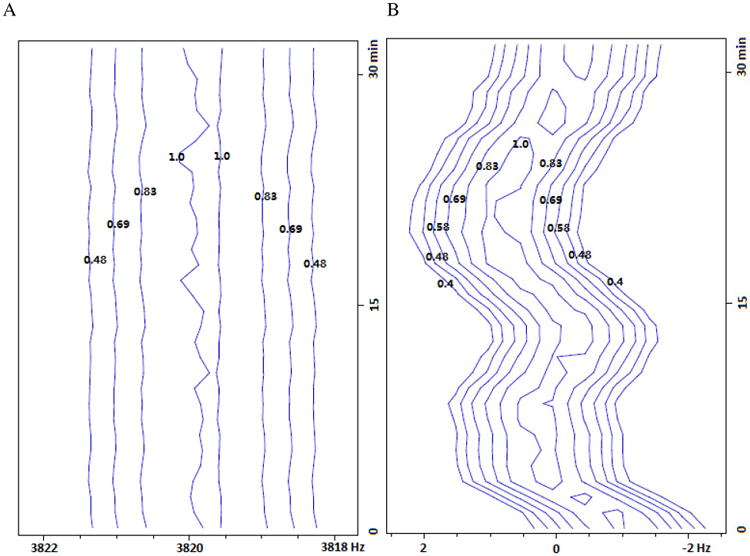
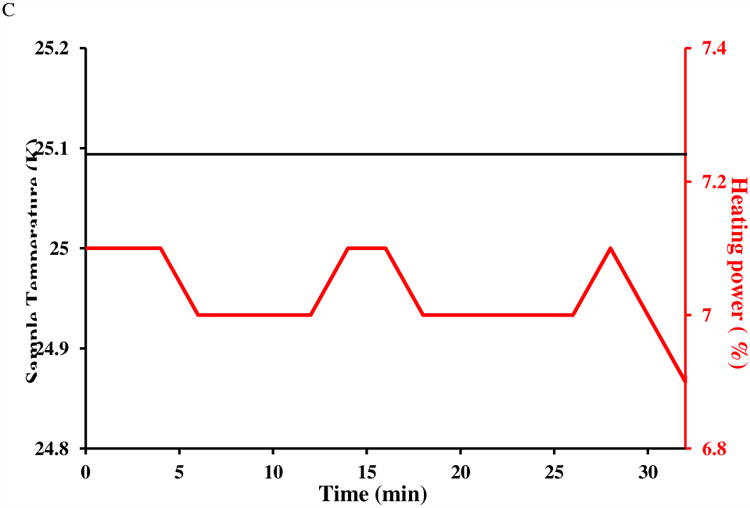
A frequency drift test for 0.1% DSS in 0.1 mg/ml GdCl3 doped 99% D2O at 25 °C. Plotted are pseudo-contours (with relative intensity labeled on each level) of 32 stacked 1D proton spectra acquired in 32 minutes for the regions of A) residual proton resonance and B) DSS. Horizontal frequencies are offsets to spectrometer base frequency. In A), water's residual proton resonance frequency does not show any significant drift (< 0.2 Hz) suggesting good stability in internal spectrometer frequency, resonance line-shape and transmitter/receiver efficiency. In B), DSS frequency drifts (relative to the residual proton frequency) about 1 Hz from the mean, presumably due to sample temperature fluctuation of 0.1 °C or higher. The spectrometer was locked to the solvent's deuterium signal and the sample had equilibrated more than 5 minutes after target temperature was reached. Thermocouple-reported sample temperature and heating element output during the drift test are plotted in C).
When t1 noise is more severe, co-addition of multiple spectra is particularly helpful in suppressing that noise. In practice, how fast an individual 2D spectrum can be acquired depends on a number of factors, including the minimum number of scans required by the pulse program and desired resolution in the indirect dimension.
Generally, the minimum number of scans can be found in the pulse program or from the original literature. Alternatively, in the absence of good documentation, it can be derived from the desired coherence pathway. Sometimes additional phase cycling is employed for further artifact suppression. For the particular sequence we used for our NOESY data acquisition, the essential phase cycling uses 8 scans. An additional two-step phase cycling (of the second pulse in this sequence) can suppress faraway water [15], while the bulk water is suppressed by the 3919 WATERGATE. Thus the complete phase-cycling for this sequence becomes 16 steps. However, the spectrometer operator should compare the results of 8-scan and 16-scan directly to determine which is better for his or her particular need as the minimum number of scans for co-addition.
It should be also noted that phase-cycling steps should take precedence over t1 noise suppression. We have found that interleaving phase-cycling with the t1 increment was neither convenient nor effective. As such, the co-addition method for t1 suppression proposed here is most beneficial in situations when the total number of scans exceeds the essential or complete phase cycling steps, and when the t1 noise in the conventional acquisition is expected to be significantly larger than the random noise.
While breaking a single long 2D acquisition into multiple shorter ones will cost the user additional disk space (in the order of 10 megabytes for typical 2D datasets), disk space is generally not limiting: even modest desktop computers are typically configured with a disk drive capacity of hundreds of gigabytes, if not terabytes. Furthermore, if disk space is really an issue, the individual spectra (raw or processed) can be deleted after successful co-addition of the time-domain data.
The principle of our co-addition method for t1 noise suppression can be potentially extended to other 2D or even nD NMR acquisitions, especially when there are weaker signals that are potentially obstructed by the t1 noise generated from adjacent stronger ones. Examples of such acquisitions include but are not limited to 2D NOESY, TOCSY or HMBC data that have both strong and weak signals at the same time, but also HSQC or COSY data obtained when there are multiple components in the same sample. Our results from Tables 1 and 2 also support the consensus that a higher spectrum signal-to-noise ratio does not directly lead to t1 noise improvement. In fact, boosting sensitivity by making the conventional acquisition time unnecessarily long may actually make t1 noise worse.
For spectrometers with better sample-temperature control or lower magnetic field strength, the t1 noise problem may not be as severe as shown in Fig. 1A. However, t1 noise reduction by our co-addition method has been consistently observed over conventional acquisitions for proteins, DNA, and small molecule samples in both aqueous and non-aqueous solvents. Its use is advantageous when both t1 noise becomes an issue and the number of scans is a multiple of complete phase-cycling steps in the pulse program.
Conclusions
t1 noise in 2D or nD NMR datasets can sometimes severely complicate spectral analysis. Using 2D NOESY as an example, we split a long 2D acquisition with 64 scans per increment into eight shorter acquisitions with 8 scans per increment. Co-addition of the 8-scan spectra resulted in a significant reduction in t1 noise when compared with the 64-scan spectrum. This method is advantageous whenever the number of scans-per-increment required to obtain an adequate signal-to-noise ratio exceeds the number needed to complete the pulse sequence's phase cycle. With limited downside, the principle of co-addition can potentially be employed to suppress t1 noise in other 2D or nD acquisitions.
Highlight.
t1 noise in 2D NOESY frequently lacks long-term self-correlation
Co-addition of multiple NOESY spectra significantly reduces t1 noise compared with conventional acquisition
Acknowledgments
The authors thank Jerry Hirschinger (PINMRF) for helpful discussions and the AMMRL online discussion group (www.ammrl.org) for the resourcing of reference 4. The authors also acknowledge helpful discussions with Dr. Clemens G. Anklin of Bruker Biospin and would like to extend their appreciation to the reviewers of our initially submitted manuscript for their thorough and insightful comments. The authors acknowledge the support from the National Institutes of Health (R01 GM039478 to C.B.P. and R01 CA177585 to D.Y.) and from the Purdue University Center for Cancer Research (NIH NCI P30 CA023168).
Footnotes
Publisher's Disclaimer: This is a PDF file of an unedited manuscript that has been accepted for publication. As a service to our customers we are providing this early version of the manuscript. The manuscript will undergo copyediting, typesetting, and review of the resulting proof before it is published in its final citable form. Please note that during the production process errors may be discovered which could affect the content, and all legal disclaimers that apply to the journal pertain.
References
- 1.Nagayama K, Bachmann P, Wuthrich K, Ernst RR. J Magn Reson. 1978;31:133–48. [Google Scholar]
- 2.Mehlkopf AF, Korbee D, Tiggelman TA, Freeman R. J Magn Reson. 1984;58:315–23. [Google Scholar]
- 3.Neuhaus D, Williamson M. The Nuclear Overhauser Effect in Structural and Conformational Analysis. VCH publishers; New York, NY: 1989. [Google Scholar]
- 4.Patt SL. Magn Moments. 1990;4(4):6–8. [Google Scholar]
- 5.Morris GA. J Magn Reson. 1992;100:316–328. [Google Scholar]
- 6.Bowyer PJ, Swanson AG, Morris GA. J Magn Reson. 2001;152:234–46. doi: 10.1006/jmre.2001.2404. [DOI] [PubMed] [Google Scholar]
- 7.Bowyer PJ, Swanson AG, Morris GA. J Magn Reson. 1999;140:513–5. doi: 10.1006/jmre.1999.1882. [DOI] [PubMed] [Google Scholar]
- 8.Granwehr J. Appl Magn Reson. 2007;32:113–156. [Google Scholar]
- 9.Robertson AJ, Pandey MK, M A, Nishiyama Y, Brown SP. J Magn Reson. 2015;260:89–97. doi: 10.1016/j.jmr.2015.09.005. [DOI] [PubMed] [Google Scholar]
- 10.Poulding S, Charlton AJ, Donarski J, Wilson JC. J Magn Reson. 2007;189:190–199. doi: 10.1016/j.jmr.2007.09.004. [DOI] [PubMed] [Google Scholar]
- 11.Gibbs A, Morris GA, Swanson AG, Cowburn D. J Magn Reson A. 1993;101:351–356. [Google Scholar]
- 12.Manoleras N, Norton RS. J Biomol NMR. 1992;2:485–494. [Google Scholar]
- 13.Morris GA, Emsley JW. Multidimensional NMR Methods for the Solution State. John Wiley and Sons; West Sussex, UK: 2010. [Google Scholar]
- 14.Swan I, Reid M, Howe PWA, Connell MA, Nilsson M, Moore MA, Morris GA. J Magn Reson. 2015;252:120–129. doi: 10.1016/j.jmr.2014.12.006. [DOI] [PubMed] [Google Scholar]
- 15.Mo H, Raftery D. J Magn Reson. 2008;190:1–6. doi: 10.1016/j.jmr.2007.09.016. [DOI] [PMC free article] [PubMed] [Google Scholar]


