Abstract
Polypyrimidine Tract-Binding Protein 1 (PTBP1) is an essential RNA-binding protein that regulates diverse biological events through regulating alternative splice of mRNA. PTBP1 induces cancer-promoting splice variants and is related to tumorigenesis in several cancers. However, both the expression patterns and biological mechanisms of PTBP1 in clear-cell renal cell carcinoma (ccRCC) are unclear. We investigated PTBP1 expression in 533 ccRCC patients from TCGA and 30 ccRCC patients by immunohistochemistry, and found that PTBP1 expression levels were significantly increased in ccRCC tissues and that high PTBP1 expression was closely correlated with advanced tumor stage, AJCC stage and poor prognosis. Cell biological assays with siRNA-mediated knockdown and lentivirus vector-mediated over-expression demonstrated that PTBP1 promoted proliferation, migration and invasion in ccRCC cells in vitro. Furthermore, PTBP1 increased the transformation from pyruvate kinase muscle 1 (PKM1) to PKM2. Knockdown of PKM2 mainly abolished PTBP1-induced proliferation, migration and invasion in ccRCC cells in vitro. In conclusion, our study indicates that PTBP1 plays a tumorigenic role in ccRCC by mediating PKM2 alternative splicing and it may be a potential prognostic marker and a promising target for treatment of ccRCC.
Keywords: PTBP1, renal cell carcinoma, proliferation, metastasis, PKM2
Introduction
Renal cancer is one of the most common cancer, with 338,000 newly diagnosed cases and 144,000 deaths globally in 2012, among which renal cell carcinoma (RCC) comprises more than 90% [1]. And clear-cell renal cell carcinoma (ccRCC) is the most common and aggressive type of RCC [2,3]. The metastatic RCC (mRCC) is one of the most treatment-resistant malignancies and often leads to extremely poor outcomes with the 5-year survival less than 10% [4,5]. Therefore, researches on its invasion and metastasis become particularly urgent. Previous study found that increased expression of system large amino acid transporter (LAT)-1 mRNA is associated with invasive potential and unfavorable prognosis of ccRCC [6], Although basic knowledge related to this metastatic process has increased recently, many of the key elements are still poorly understood [7,8].
Polypyrimidine tract-binding protein 1 (PTBP1, also known as hnRNPI), a member of the hnRNP family, is a key regulator of pre-mRNA splicing, inhibiting the inclusion of numerous alternative exons into mRNA [9,10]. Structurally, it contains four RNA-binding domains, all of which are capable of interacting with the RNA [11]. Biologically, PTBP1 controls the activity of Pbx1 to suppress its neuronal transcriptional program prior to induction of neuronal progenitor cells development [12]. Besides, PTBP1 regulates multiple steps of CD4 T cell activation by mediating IL-2 and CD40L [13].
Recently, PTBP1 has been found upregulated in gliomas, colorectal and ovarian cancer [14-16]. However, the clinical relevance of PTBP1 was only uncovered in gliomas in which high levels of PTBP1 expression were closely associated with the malignant degree and poor prognosis [14]. Knockdown of PTBP1 suppressed colorectal cancer cell proliferation and migration [15]. Several studies have found that PTBP1 play an important role in cancers by regulating alternative splicing of a number of pre-mRNAs [15,17-22], such as PKM [15,21], CD44V8-10 [15] and CDC42 [20]. Among these, pre-mRNA of muscle-specific pyruvate kinase M (PKM) has been mostly noticed [15,16,23]. PKM is a metabolic enzyme which has been implicated in metabolic reprogramming in certain cancers [24,25]. PKM exists in two isoforms by alternative splicing: PKM1 exists in most adult tissues and is responsible for oxidative phosphorylation and suppresses tumorigenesis, while PKM2, a major isoform in embryonic and cancer cells, provides a growth advantage for tumor cells where PKM2 activates transcription of various genes [26]. Therefore, PKM2 switching can reprogram metabolic pathways and promote tumorigenesis. Until now, there is no report on the expression pattern of PTBP1 and its function in ccRCC.
In the present study, we investigated PTBP1 expression in ccRCC tissues and analyzed its correlation with the clinicopathological characteristics and overall survival. We also explored the function and mechanism of PTBP1 in ccRCC cell lines. Our findings strongly suggest that PTBP1 participates in ccRCC carcinogenesis and is a potential prognostic marker and a promising therapeutic target.
Material and methods
Acquisition and analysis of clinical data
We acquired 533 clear cell renal carcinoma cases’ clinical and genomic data from the Cancer Genome Atlas (TCGA, https://cancergenome.nih.gov/. Supplementary Table 1 lists the patient and tumor demographics.
Immunohistochemical (IHC) staining and scoring analyses
Two tissue microarrays containing 30 ccRCC specimens and 16 normal tissues were purchased from US Biomax. This experiment was conducted as previously described [27,28]. Briefly, the two tissue microarrays were first deparaffinized and hydrated. After that microwave antigen retrieval in citrate buffer (pH 6.0) was performed, and endogenous peroxidase activity was blocked by incubating the slides in 0.3% H2O2. Then the tissue microarrays were incubated with anti-PTBP1 antibody (1:200, santa cruz, sc-56701) and subsequently the HRP conjugated anti-rabbit/mouse (Dako, K5007). Finally, microarrays were developed with peroxidase and 3,3-diaminobenzidine tetrahydrochloride and counterstained with hematoxylin and mounted in nonaqueous mounting medium.
The expression of PTBP1 in tissues was blindly quantified by two pathologists using the histochemical score (H-score) as described as previously described [27]. Briefly, the staining intensity (0 = negative, 1 = weak, 2 = moderate and 3 = strong) was multiplied by the percentage of positive cells (0%-100%) to obtain the average H-score (0-300) of each tissue. The samples were classed into low (H-score < 150) or high (H-score ≥ 150) PTBP1 expression. Images were visualized using a Nikon ECLIPSE Ti (Japan) microscope system and processed with Nikon software.
Cell culture
The human renal cancer cells 769P and ACHN, and SV40-transformed kidney cell line 293T (ATCC, Manassas, VA) were used in this study. 769P and ACHN cells were cultured in RPMI 1640 (Gibco, Shanghai, China), 293T cells were cultured in DMEM (Gibco, Shanghai, China). All media were supplemented with 10% FBS (Shanghai ExCell Biology, China) and 1% penicillin/streptomycin. Cells were cultured in a humidified atmosphere of 5% CO2 at 37°C.
RNA interference
SiRNA oligos targeting PTBP1 (1-CCCUCAUUGACCUGCACAATT, 2-GCACAGUGUUGAAGAUCAUTT), PKM2 (1-CCAUAAUCGUCCUCACCAATT) and negative control siRNA were purchased from GenePharma (Shanghai, China). 769P and ACHN cells cultured in 6-wells plates were transfected with 75 nM siRNA and Lipofectamine RNAi max (Life Technologies) following the manufacturer’s protocols.
Stable PTBP1 overexpression cell lines
The coding sequence of PTBP1 was amplified by PCR and cloned into the pCDH-CMV-MCS-RFP-Puro vector (PCDH) to construct the recombinant plasmid PCDH-PTBP1. The empty vector PCDH as control and the recombinant plasmid PCDH-PTBP1 were packaged into lentivirus with 293T cells according to the manufacturer’s recommendations. Then we subsequently harvested and concentrated the virus, which later were used to infect 769P and ACHN cells. Finally, puromycin was used to select the stable cells with PCDH or PCDH-PTBP1.
Cell proliferation assay
The methyl thiazolyl tetrazolium (MTT; MTS, Promega) colorimetric assay was used to measure cell viability. The cells transfected with control, PTBP1 siRNA or the stable cells were seeded in 96-well plates at a density of 2×10³ cells/well. Then, the absorbance was measured at a wavelength of 492 nm for 5 days by SpectraMax M5 (Molecular Devices).
For the colony formation assay, cells transfected with siRNA and the stable cells were seeded in a 6-well plate (1000 cells/well for 769P, 500 cells/well for ACHN). After 10 to 12 days, the clones were washed with 1×PBS, fixed with 4% paraformaldehyd for 30 min and stained with crystal violet for approximately 30 min. Finally, the clones were imaged and quantified.
For the cell cycle analysis, 72 h after transfection, cells were harvested and fixed in 70% ice cold ethanol and followed by RNase A treatment, stained with 50 μg/ml of propidium iodide for DNA content analysis in a FACSCaliber BD flow cytometer. The data were collected and processed using the BD FACSuite analysis software.
Migration and invasion assay
This experiment was conducted as previously described [29]. This assay was performed using Corning incorporated costar transwell plates (Corning, USA, 3422 and 3495) according to the manufacturer’s instructions. Briefly, cells were firstly treated as described above. 2.5×10⁴ cells in 0.2 ml of minimum essential medium without FBS were seeded into the rehydrated cell culture inserts, which were placed in the 24-well plates containing 0.7 ml of minimum essential medium supplemented with 10% FBS and incubated at 37°C, 5% CO2. 12 h later and another more 12 h for cell culture inserts Coated with Matrigel, the invading cells on the lower surface of the inserts were then fixed in 4% paraformaldehyd for 30 min and stained in 1% crystal violet, and noninvading cells were removed from the inserts using cotton-tipped swabs. Finally, the membranes were visualized using a Nikon ECLIPSE Ti (Japan) microscope system and processed with Nikon software.
RNA isolation and quantitative RT-PCR (RT-qPCR)
Total cellular RNA was extracted using TRIzol (Invitrogen) according to the previously described [30] and cDNA was synthesized from 500 ng of total RNA with a PrimeScript RT-PCR kit (TaKaRa Biotechnology, Dalian, China). RT-qPCR was conducted using a standard SYBR Green PCR kit protocol (Roche) and run in a LightCycler 96 Real-Time System (Roche). The relative expression was calculated using the comparative cycle threshold (2-∆∆Ct) method [28]. The expression level of GAPDH was used as the endogenous control. Supplementary Table 2 lists the specific primers used in this study.
Western blotting
This experiment was conducted as previously described [31]. Primary antibodies specific to PTBP1 (1:200, santa cruz, sc-56701), cyclin D1 (1:1000, CST, 2922), cyclin E1 (1:1000, CST, 4129s), cyclin E2 (1:1000, CST, 4132), and GAPDH (1:1000, CST, 97166), PKM2 (1:2000, santa cruz, sc-365684) were used in this study. Secondary antibodies were goat anti-mouse-IgG-HRP (1:5000, santa cruz, sc-2005) and goat anti-rabbit-IgG-HRP (1:5000, santa cruz, sc-2004). GAPDH was used as an endogenous reference for quantitation.
Statistical analyses
Data were presented as the mean ± SD from three independent experiments. Two-tailed Student’s t-tests and one-way analysis of variance (ANOVA) were used to evaluate the data. The differences between groups of PTBP1 expression of the 533 ccRCC patients were analyzed using the Chi-squared test (χ2 test). Kaplan-Meier method with log-rank test was used to explore the effects of PTBP1 on the overall survival of ccRCC patients. The correlation between PTBP1 protein level and PKM2 protein level was analyzed by Spearman rank correlation. All of the statistical analyses were performed with SPSS 19.0. The difference was considered to be statistically significant at *P < 0.05 or *P < 0.01.
Result
PTBP1 expression is upregulated in ccRCCs and associated with clinical characteristics of ccRCC
To study the expression of PTBP1 in ccRCC, we first analyzed the expression of PTBP1 on 73 cases ccRCC tissues and adjacent normal renal tissues from Cancer Genome Atlas (TCGA) data. PTBP1 expression level in tumor tissues was significantly higher than adjacent normal tissues (fragments per kilobase of exon per million fragments, FPKM: 4203.07 ± 839.23 vs 3571.96 ± 447.16 P < 0.0001, Figure 1A). Further analysis of PTBP1 expression of 533 ccRCC patients showed a more significant difference between ccRCC tissues and normal renal tissues (FPKM: 4402.39 ± 852.45 vs 3571.96 ± 447.16, P < 0.0001, Figure 1B). Additionally, we examined PTBP1 expression in two tissue microarrays which contained 30 ccRCC tissues and 16 normal tissues by immunohistochemistry (IHC). As shown in Figure 1D, PTBP1 was obviously upregulated in ccRCC tissues (Figure 1D). Most of the ccRCC tissues (70%, 21/30 cases) exhibited high PTBP1 expression. By contrast, 81.25% (13/16 cases) of normal renal tissues expressed low PTBP1 (Figure 1E).
Figure 1.
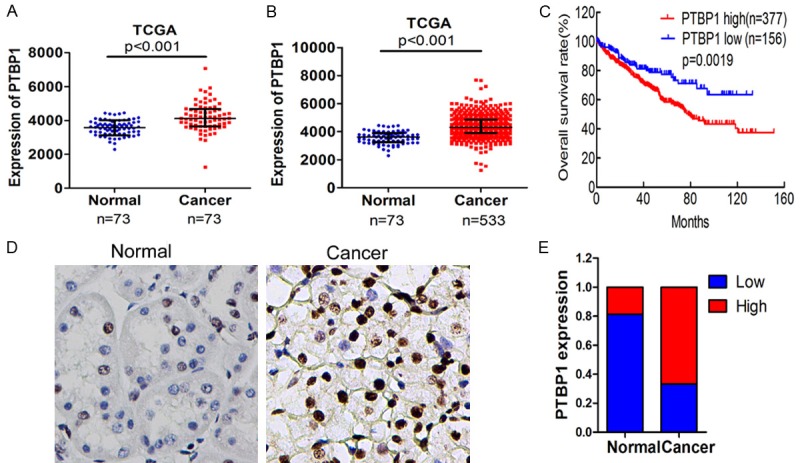
PTBP1 is upregulated in ccRCC tissues. A. PTBP1 expression in normal renal tissues and ccRCC tissues of 73 patients was downloaded from the TCGA database and compared by paired t test. B. PTBP1 expression level in normal tissues and cancer tissues of 533 patients from TCGA was compared by t test. C. The overall survival rates of the 533 RCC patients were compared according to low- and high-PTBP1 level by Kaplan-Meier method with log-rank test. D. The expression of PTBP1 was detected in ccRCC tissues and normal renal tissues by IHC, and representative samples are shown at 400× magnification. E. IHC expression of PTBP1 quantified by H-score in normal tissues and ccRCC tissues. The samples were classed as low (H-score, < 150) or high (H-score ≥ 150) PTBP1 expression.
The 533 ccRCC cases from TCGA were used to determine the association between PTBP1 expression levels and clinicopathological variables. As summarized in Table 1, patients with higher PTBP1 level had higher T stage (P < 0.001), more metastasis (P = 0.001) and higher AJCC stage (P = 0.001), which suggest PTBP1 expression level is positively correlated with advanced tumor stage and metastasis in ccRCC.
Table 1.
Association between PTBP1 expression and clinicopathological features of ccRCC
| Characteristics | Cases | PTBP1 | P-value | |
|---|---|---|---|---|
|
|
||||
| Low | High | |||
| Patients (N) | 533 | |||
| Gender | 0.008 | |||
| Male | 345 | 203 | 142 | |
| Female | 188 | 88 | 100 | |
| Age (year) | 0.906 | |||
| ≤ 60 | 265 | 144 | 121 | |
| > 60 | 268 | 147 | 121 | |
| Tumor stage | < 0.001* | |||
| T1-2 | 342 | 206 | 136 | |
| T3-4 | 191 | 85 | 106 | |
| pN-stage | 0.347 | |||
| N0 | 240 | 134 | 106 | |
| N1 | 16 | 7 | 9 | |
| Missing | 277 | 150 | 127 | |
| Metastasis | 0.001* | |||
| M0 | 422 | 249 | 173 | |
| M1 | 79 | 30 | 49 | |
| Missing | 32 | 12 | 20 | |
| AJCC stage | 0.001* | |||
| I | i | 161 | 106 | |
| II | 57 | 37 | 20 | |
| III | 124 | 61 | 63 | |
| IV | 85 | 32 | 53 | |
Chi square test was used and
P < 0.05 is considered significant.
PTBP1 expression predicts disease prognosis in ccRCC
To identify the prognostic value of PTBP1 in ccRCC, the overall survival (OS) of subgroups according to PTBP1 expression level was compared by Kaplan-Meier survival analysis with log-rank test. Patients with high PTBP1 expression had shorter OS than those with low PTBP1 expression (P = 0.0019) (Figure 1C). To further evaluate the prognostic factors associated with overall survival in ccRCC, we first carried out univariate analysis using age, sex, tumor stage, metastasis grade, node stage, AJCC stage, and PTBP1 expression as parameters. As presented in Table 2, PTBP1 expression (P < 0.001), and age (P < 0.001), pT-stage (P < 0.001), metastasis (P < 0.001) and AJCC stage were significantly associated with overall survival. Moreover, the variables associated with survival by univariate analyses were adopted as covariates in the multivariate analyses, which revealed that PTBP1 expression (P = 0.038) in addition to Age (P < 0.001), AJCC stage (P = 0.01) was an independent predictor of overall survival. In summary, high PTBP1 expression could be an independent predictor of poor prognosis for ccRCC.
Table 2.
Univariate and multivariate analysis of factors associated with overall survival in ccRCC
| Variable | Univariate | Multivariate | ||||
|---|---|---|---|---|---|---|
|
|
|
|||||
| HR2 | 95% CI | p | HR2 | 95% CI | p | |
| Gender (female/male) | 0.949 | 0.698-1.292 | 0.741 | |||
| Age, years (> 60/≤ 60) | 1.732 | 1.278-2.353 | < 0.001 | 1.741 | 1.279-2.370 | < 0.001 |
| Tumor stage (T3-T4/T1-T2) | 3.151 | 2.329-4.262 | < 0.001 | 0.765 | 0.494-1.186 | 0.945 |
| pN-stage (N1/N0) | 0.879 | 0.321-2.405 | 0.801 | |||
| Metastasis (M1/M2) | 4.351 | 3.190-5.935 | < 0.001 | 0.076 | ||
| AJCC stage (I, II, III, IV) | 1.890 | 1.658-2.153 | < 0.001 | 2.019 | 1.674-2.436 | 0.01 |
| PTBP1 (high/low) | 1.582 | 1.174-2.132 | 0.003 | 1.388 | 1.026-1.878 | 0.038 |
CI = confidence interval, HR = hazard ratio, P < 0.05 is considered statistically significant.
PTBP1 enhances renal carcinoma cell proliferation by regulating the cell cycle
To explore the role of PTBP1 in renal carcinoma, we first knockdown and overexpressed PTBP1 in renal carcinoma cells. PTBP1 was remarkably downregulated in 769P and ACHN cells transfected with the PTBP1 siRNAs as compared with those transfected with control siRNA at both mRNA and protein level, as confirmed by RT-qPCR (Figure 2A) and western blotting (Figure 2C). And it was obviously upregulated in 769P and ACHN cells through lentiviral infection (Figure 2B and 2D). Moreover, PTBP1 knockdown significantly reduced viability and colony formation of 769P and ACHN cells (Figure 2E and 2G, P < 0.05). In contrast, overexpression of PTBP1 enhanced renal carcinoma cell viability and colony formation (Figure 2F and 2H). These data suggest that PTBP1 promotes the proliferation of renal carcinoma cells in vitro.
Figure 2.
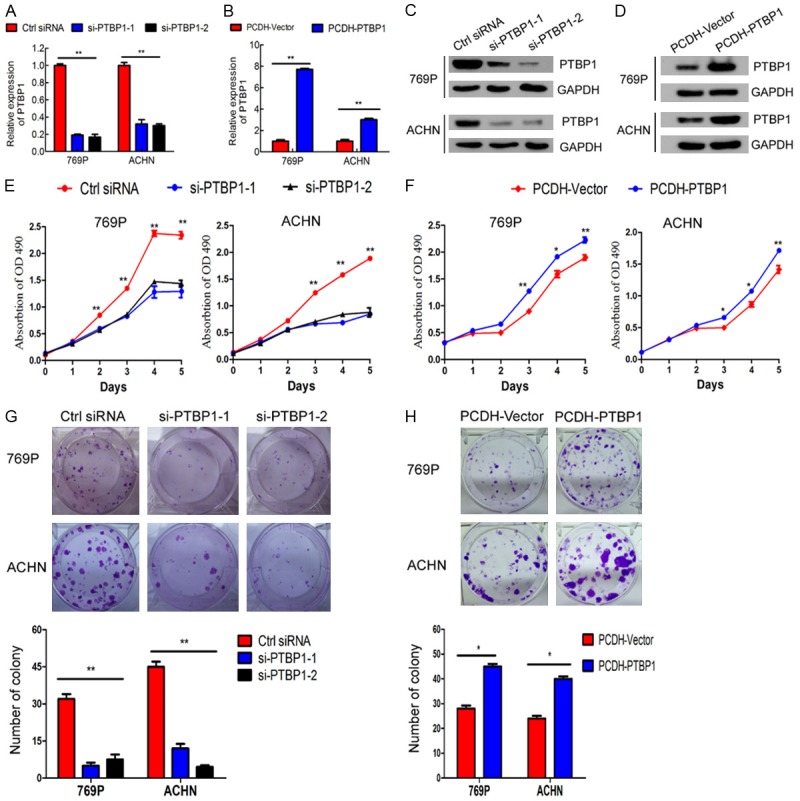
PTBP1 promotes ccRCC cell proliferation in vitro. A and B. Verification of si-PTBP1 knockdown efficiency and overexpression efficiency in 769P and ACHN cells by RT-qPCR. C and D. Verification of PTBP1-knockdown and overexpression efficiency by western blotting in 769P and ACHN cells. E and F. MTT assay evaluation of influence of PTBP1 knockdown and overexpression on 769P and ACHN cell viability. G and H. Colony formation assay determines the effect of PTBP1 knockdown and overexpression on 769P and ACHN cells. The results are presented as the means ± SD of three independent experiments. *P < 0.05, **P < 0.01.
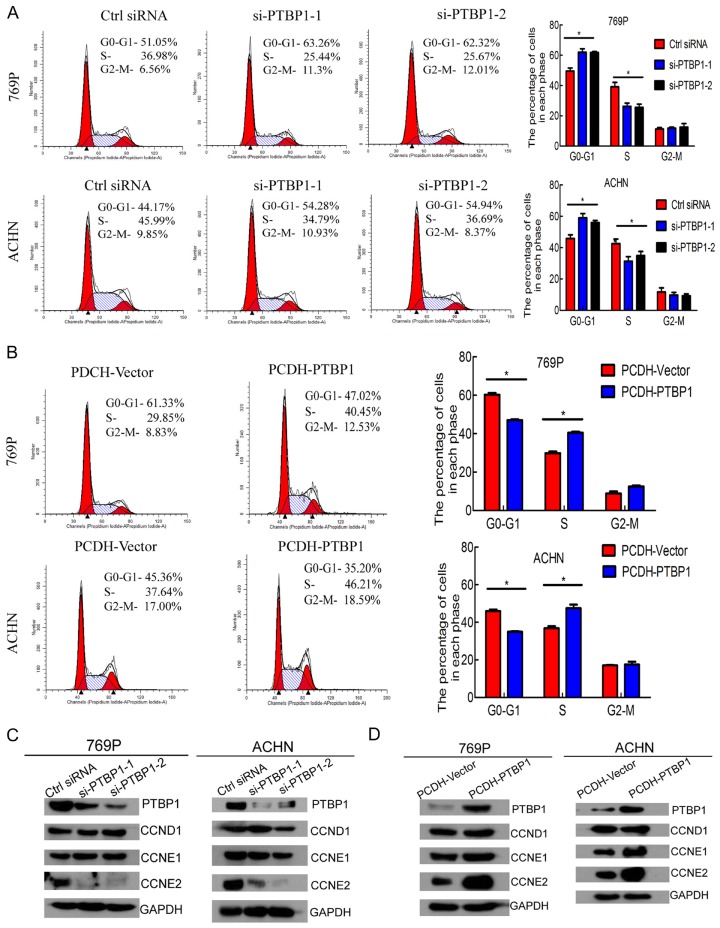
Then we performed flow cytometry to characterize whether PTBP1 was involved in the cell cycle. Interestingly, PTBP1 silencing dramatically increased the cell population at G0/G1 phase and reduced the cell population at S phase (Figure 3A). Whereas PTBP1 overexpression obviously decreased cell population at G0/G1 and raised cell population at S phase (Figure 3B). Given that PTBP1 knockdown induced G0/G1 arrest and PTBP1 overexpression facilitated G1/S phase transition, we detected the expression level of cyclins regulating G1/S phase transition by Western Blotting. Cyclin E2 was obviously downregulated with PTBP1 silencing and upregulated with PTBP1 overexpression, whereas cyclin D1 and E1 were unaffected (Figure 3C and 3D). Besides, the expression level of PTBP1 was positively correlated with cyclin E2 in TCGA data (rs = 0.222, P < 0.001, Table 3). Collectively, these results demonstrate that PTBP1 promotes renal carcinoma cell proliferation by regulating the cell cycle.
Figure 3.
PTBP1 regulate G1/S phase transition in ccRCC cells. A. Flow cytometry analysis of 769P and ACHN cells transfected with control or PTBP1 siRNA for 72 h. B. Flow cytometry analysis of stable PTBP1 overexpression cell lines and control cell lines. The percentages (%) of cell populations at different stages of the cell cycle are listed in the panels. All histograms show the percentage (%) (means ± SD) of cell populations from three independent experiments. C and D. Effect of PTBP1 knockdown and overexpression on regulation of cyclins was detected by Western blotting. The samples were derived from the same experiment and blots were processed in parallel. The results are presented as the means ± SD of values obtained in three independent experiments. Statistical significance was calculated using the ANOVA or paired t test. *P < 0.05, **P < 0.01.
Table 3.
Correlation between PTBP1 and PKM2 in renal cell carcinoma patients
P < 0.01 is considered significant.
PTBP1 promotes renal carcinoma cell migration and invasion
Since metastasis is the leading cause of death of ccRCC and higher PTBP1 level was associated with more metastasis in ccRCC [32,33], we investigated whether PTBP1 affected migration and invasion of renal carcinoma cell lines. The migration ability of 769P cells and ACHN cells was remarkably inhibited by silencing PTBP1, while it was significantly enhanced when PTBP1 overexpressed (Figure 4A and 4C). Furthermore, downregulation of PTBP1 suppressed the invasion of ccRCC cells assessed by Matrigel-coated Transwell and upregulation of PTBP1 enhanced the motility (Figure 4B and 4D). These findings suggest that PTBP1 may play a crucial role in metastasis of ccRCC.
Figure 4.
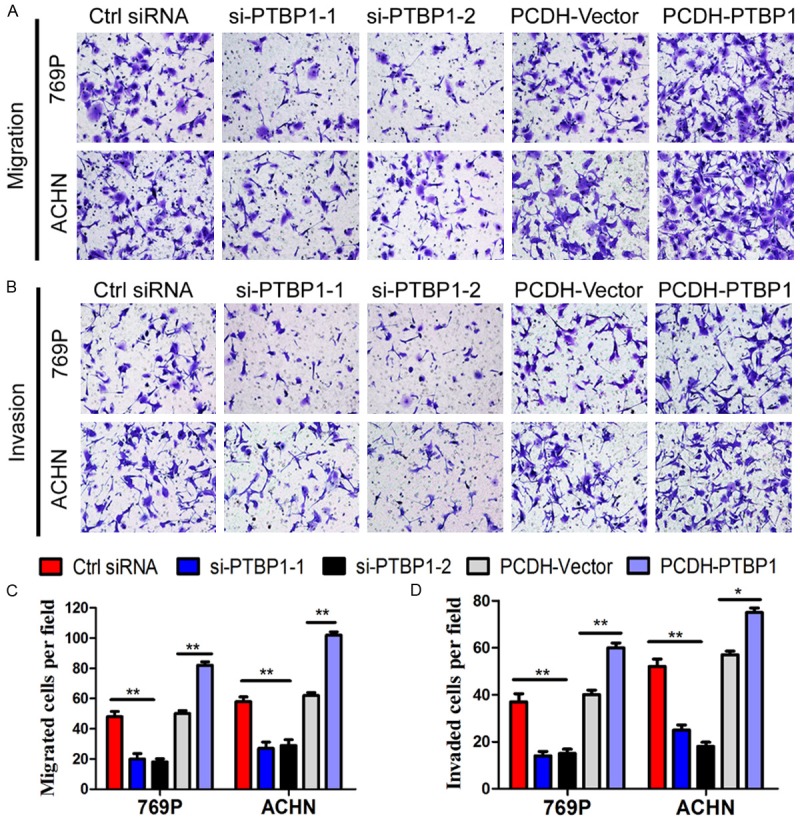
PTBP1 upregulates migration and invasiveness in ccRCC cells. A and B. Representative pictures showing migrated and invasive cells under microscope (200×). C and D. Number of cells migrated or invaded per field. The results are presented as the means ± SD of values (n = 3). Statistical significance was calculated using the ANOVA or paired t test. *P < 0.05, **P < 0.01.
PTBP1 induces transformation from PKM1 to PKM2
Existing evidences show that PTBP1 participates in tumorigenesis by regulating alternative splicing. To explore the regulation mechanism of PTBP1 in ccRCC, we investigated whether PTBP1 regulated PKM transformation. To address this, the expression level of PTBP1 and PKM2 of the 533 ccRCC patients were analyzed by Spearman rank correlation. PTBP1 was positively correlated with PKM2 (rs = 0.369, P < 0.001, Table 3). RT-qPCR revealed the PKM2:PKM1 ratio significantly declined with PTBP1 silencing (Figure 5A) and increased with PTBP1 overexpression (Figure 5C). Consistent with above, western blots showed the expression of PKM2 was obviously decreased with PTBP1 silencing (Figure 5B) and significantly increased with PTBP1 overexpression (Figure 5D). Overall, these results demonstrated that PTBP1 induced PKM isoform switch from PKM1 to PKM2 and promoted the expressions of PKM2 in ccRCC cells.
Figure 5.
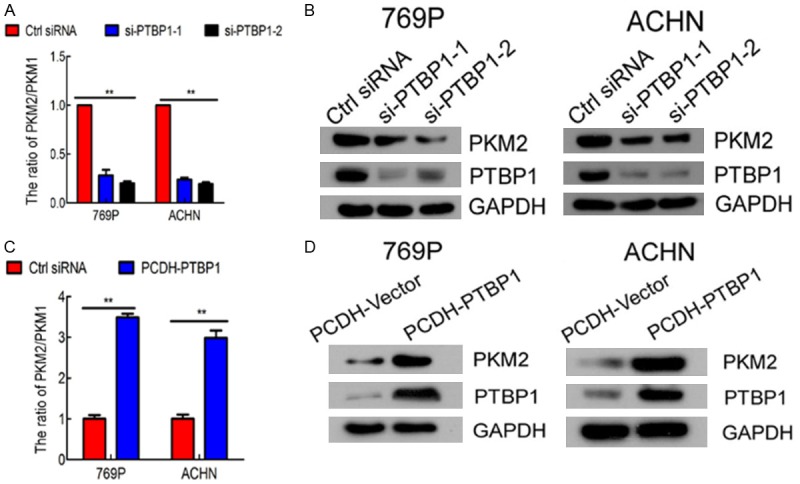
PTBP1 induces transformation from PKM1 to PKM2 in ccRCC. A. Relative mRNA of PKM1 and PKM2 at 48h after transfection with control or PTBP siRNA in 769P and ACHN cells was determined by RT-qPCR. The PKM2/PKM1 ratio was calculated based on their relative mRNA levels. PTBP1 knockdown decreased the PKM2/PKM1 ratio. B. PTBP1 silencing reduced the protein level of PKM2 in 769P and ACHN cells by western blots. C. PTBP1 overexpression increased PKM2/PKM1 ratio by RT-qPCR. D. PTBP1 overexpression increased PKM2 protein level by western blots. The values are the means ± SD of three independent experiments. *P < 0.05, **P < 0.01.
PKM2 silencing mainly abolished PTBP1-induced proliferation, migration and invasion in ccRCC cells
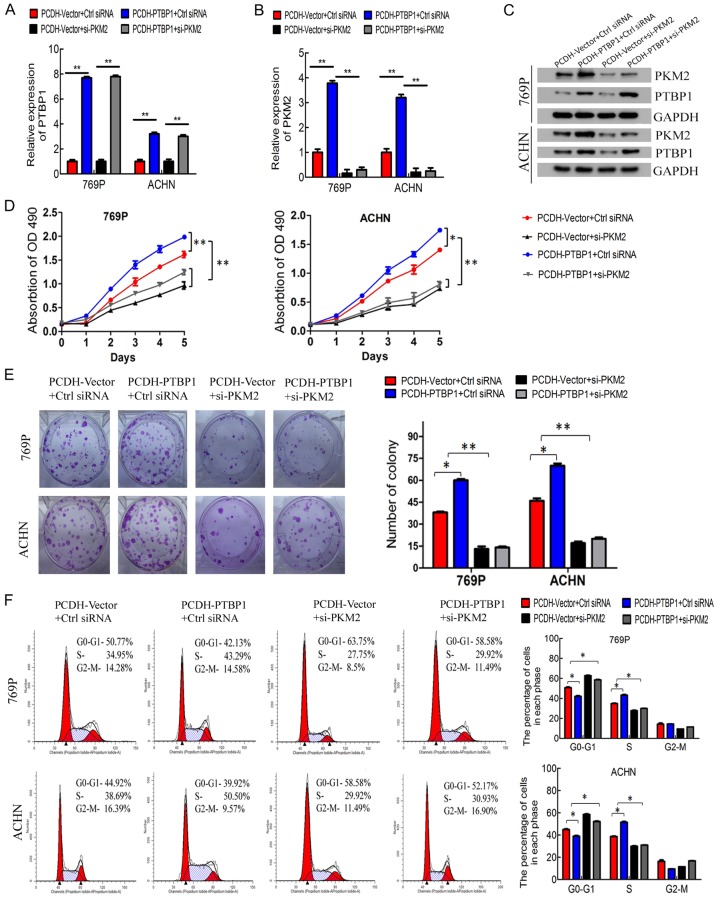
To explore the role of PKM2 in the PTBP1-promoted tumorigenesis of ccRCC, the control and stable PTBP1 overexpressed cells were transfected with PKM2 siRNA, respectively. As Figure 6A and 6C presented, the mRNA and protein level of PTBP1 was remarkably upregulated with PCDH-PTBP1 vector, but it didn’t change by transfected with PKM2 siRNA. Although PTBP1 overexpressed cells had a high level PKM2, the expression of PKM2 was obviously reduced in 769P and ACHN cells transfected with PKM2 siRNA (Figure 6B, 6C). PKM2 knockdown significantly suppressed the promotion effect of PTBP1 overexpression on the growth and colony formation of ccRCC cells (Figure 6D, 6E). Consistent with previous observation, PTBP1 overexpression dramatically decreased the cell population at G0/G1 phase and increased the cell population at S phase, but PKM2 silencing abrogate the role of PTBP1 in regulation of cell cycle (Figure 6F). Furthermore, downregulation of PKM2 reversed the promotion of migration and invasion induced by PTBP1 overexpression in ccRCC cells (Figure 7A-D). Taken together, these results suggested that PTBP1 promoted proliferation, migration and invasion of ccRCC cells in a PKM2-dependent manner.
Figure 6.
PKM2 silencing mainly abolished PTBP1-induced proliferation in ccRCC cells. A and B. Verification the efficiency of PTBP1 overexpression and PKM2 knockdown in 769P and ACHN cells by RT-qPCR. C. Verification of PKM2 knockdown efficiency by western blots. D. MTT assay evaluation of influence of PKM2 knockdown on 769P and ACHN cell viability. E. Colony formation assay evaluation the effect of PKM2 knockdown on 769P and ACHN cells. F. Flow cytometry analysis of 769P and ACHN cells transfected with control or PKM2 siRNA for 72 h. The percentages (%) of cell populations at different stages of the cell cycle are listed in the panels. All histograms show the percentage (%) (means ± SD) of cell populations from three independent experiments. *P < 0.05, **P < 0.01.
Figure 7.
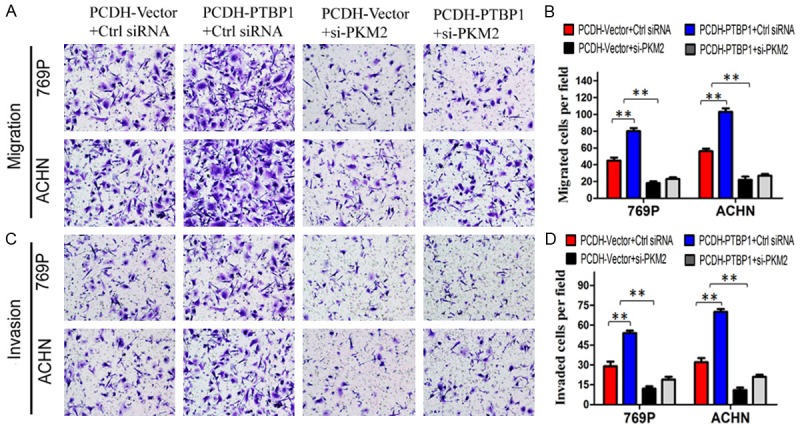
Knockdown of PKM2 abrogated the promotion of migration and invasion induced by PTBP1 overexpression in ccRCC cells. A and C. Representative pictures showing migrated and invasive cells under microscope (200×). B and D. All histograms represent the number (mean ± SD) of migrated or invasive cells from three independent experiments. Statistical significance was calculated using the ANOVA. *P < 0.05, **P < 0.01.
Discussion
ccRCC is one of the most common and aggressive type of RCC. Chemotherapy and radiotherapy are ineffective while targeted therapies improve the outcome of ccRCC patients [34]. Therefore, the molecular mechanism study in ccRCC is crucial to discover innovative therapeutic strategies for ccRCC. PTBP1 is a key regulator of pre-mRNA splicing, inhibiting the inclusion of numerous alternative exons into mRNA [9,10]. Recent study found that PTBP1 is overexpressed in ovarian tumors and olorectal cancer [15,16]. However, the correlation of PTBP1 with clinical characteristics and prognosis has not been well clarified. In our study, we found that PTBP1 is overexpressed in ccRCC tissues and its expression level is positively correlated with tumor stage, metastasis and AJCC stage. Moreover, PTBP1 was associated with poor prognosis and served as an independent predictor of overall survival in ccRCC. Supporting our findings, PTBP1 is upregulated in glioma tissues [14] and high expression of PTBP1 is correlated with shorter overall survival in stage 4 neuroblastoma patients [35]. Collectively, PTBP1 may be a new prognostic marker for ccRCC.
As reported previously, PTBP1 has been involved in several biological functions crucial for cancer development, including proliferation [16,23,36,37], migration and invasion [16,23,37], chemo-resistance [21]. Here, we discovered that PTBP1 knockdown significantly inhibited ccRCC cell proliferation in vitro by inducing G0/G1 arrest and that PTBP1 overexpression promote proliferation by facilitating the G1/S phase transition. Supporting our findings, recent study has found that PTBP1 downregulation suppressed cell proliferation in colorectal cancer in vitro [15]. Moreover, we detected cyclins regulating G1/S phase transition by western blotting and discovered the expression level of cyclin E2 was upregulated by PTBP1. Cyclin E2, a key regulator in G1-to-S-phase transition, possessed tumor-promoting activity [38-41]. These data strongly suggest that PTBP1 regulates the cell cycle of ccRCC cells through regulating the expression of cyclin E2.
Meanwhile, we found that PTBP1 knockdown attenuated the migration and invasion of ccRCC cells, while overexpression of it enhanced these malignant properties. Consistent with our findings, PTBP1 knockdown inhibited the migration of glioma cells [23], the invasion of breast cancer cells [37] and the migration and invasion of ovarian tumor cells [16,20]. Combined with clinical association of metastasis, these data indicated that PTBP1 prompted metastasis in ccRCC and might be as effective anti-metastasis-target for therapy.
Mechanistically, the PKM2/PKM1 ratio was remarkably decreased when PTBP1 silenced and significantly increased when PTBP1 overexpressed by RT-qPCR. Furthermore, we detected the expression level of PKM2 and found it was upregulated by PTBP1. Consistent with our findings, PTBP1 is reported to mediate the PKM isoform switching from PKM1 to PKM2 in several cancer cells [15,21,35]. PKM is an isozyme of the pyruvate kinase, which regulates the rate-limiting final step of glycolysis [42]. It has two isoforms including PKM1 and PKM2. PKM1 enhances oxidative phosphorylation and suppresses tumorigenesis, whereas PKM2 is essential to maintain aerobic glycolysis and promotes tumorigenesis [43-45]. Emerging evidences show that PKM2 has been implicated in several biological functions crucial for cancer development, including proliferation [25,46,47] metastases [48,49] and chemosensitivity [50,51] and predicts poor prognosis [52]. Our results show that knockdown of PKM2 mainly abolishes the promotion effect induced by PTBP1 in ccRCC cells. In this study, these results strongly confirmed that PTBP1 regulated PKM isoform switch from PKM1 to PKM2 in ccRCC cells and thus promoted cell proliferation and motility in a PKM2-dependent manner. Further investigation is underway to elucidate PTBP1 regulates target genes contributing to ccRCC development.
In conclusion, it is our novel discovery that PTBP1 is upregulated in ccRCC and associates with advanced stage, metastasis and poor prognosis. Moreover, PTBP1 promotes renal carcinoma cells proliferation, migration and invasion by upregulating CCNE2 and PKM2. Therefore, PTBP1 is potential biomarkers and molecular therapeutic targets for renal cell carcinoma.
Acknowledgements
This study was funded by the National Natural Science Foundation of China (Grant No. 81572514, 81472384), Guangdong Province Natural Scientific Foundation (Grant No. 2014A030313070), and Sun Yat-sen Initiative Program for Scientific Research (for Xu Chen, YXQH201708). This work was supported by Grant [2013]163 from Key Laboratory of Malignant Tumor Molecular Mechanism and Translational Medicine of Guangzhou Bureau of Science and Information Technology; Grant KLB09001 from the Key Laboratory of Malignant Tumor Gene Regulation and Target Therapy of Guangdong Higher Education Institutes. Grant from Guangdong Science and Technology Department (2015B050501004).
Disclosure of conflict of interest
None.
Supporting Information
References
- 1.Ferlay J, Soerjomataram I, Dikshit R, Eser S, Mathers C, Rebelo M, Parkin DM, Forman D, Bray F. Cancer incidence and mortality worldwide: sources, methods and major patterns in GLOBOCAN 2012. Int J Cancer. 2015;136:E359–386. doi: 10.1002/ijc.29210. [DOI] [PubMed] [Google Scholar]
- 2.Gatto F, Nookaew I, Nielsen J. Chromosome 3p loss of heterozygosity is associated with a unique metabolic network in clear cell renal carcinoma. Proc Natl Acad Sci U S A. 2014;111:E866–875. doi: 10.1073/pnas.1319196111. [DOI] [PMC free article] [PubMed] [Google Scholar]
- 3.Koul H, Huh JS, Rove KO, Crompton L, Koul S, Meacham RB, Kim FJ. Molecular aspects of renal cell carcinoma: a review. Am J Cancer Res. 2011;1:240–254. [PMC free article] [PubMed] [Google Scholar]
- 4.Motzer RJ, Bander NH, Nanus DM. Renal-cell carcinoma. N Engl J Med. 1996;335:865–875. doi: 10.1056/NEJM199609193351207. [DOI] [PubMed] [Google Scholar]
- 5.Lam JS, Leppert JT, Belldegrun AS, Figlin RA. Novel approaches in the therapy of metastatic renal cell carcinoma. World J Urol. 2005;23:202–212. doi: 10.1007/s00345-004-0466-0. [DOI] [PubMed] [Google Scholar]
- 6.Betsunoh H, Fukuda T, Anzai N, Nishihara D, Mizuno T, Yuki H, Masuda A, Yamaguchi Y, Abe H, Yashi M, Fukabori Y, Yoshida K, Kamai T. Increased expression of system large amino acid transporter (LAT)-1 mRNA is associated with invasive potential and unfavorable prognosis of human clear cell renal cell carcinoma. BMC Cancer. 2013;13:509. doi: 10.1186/1471-2407-13-509. [DOI] [PMC free article] [PubMed] [Google Scholar]
- 7.Mikami S, Oya M, Mizuno R, Kosaka T, Ishida M, Kuroda N, Nagashima Y, Katsube K, Okada Y. Recent advances in renal cell carcinoma from a pathological point of view. Pathol Int. 2016;66:481–490. doi: 10.1111/pin.12433. [DOI] [PubMed] [Google Scholar]
- 8.Wang SS, Jiang J, Liang XH, Tang YL. Links between cancer stem cells and epithelial-mesenchymal transition. Onco Targets Ther. 2015;8:2973–2980. doi: 10.2147/OTT.S91863. [DOI] [PMC free article] [PubMed] [Google Scholar]
- 9.Robinson F, Smith CW. A splicing repressor domain in polypyrimidine tract-binding protein. J Biol Chem. 2006;281:800–806. doi: 10.1074/jbc.M510578200. [DOI] [PubMed] [Google Scholar]
- 10.Spellman R, Smith CW. Novel modes of splicing repression by PTB. Trends Biochem Sci. 2006;31:73–76. doi: 10.1016/j.tibs.2005.12.003. [DOI] [PubMed] [Google Scholar]
- 11.Auweter SD, Oberstrass FC, Allain FH. Solving the structure of PTB in complex with pyrimidine tracts: an NMR study of protein-RNA complexes of weak affinities. J Mol Biol. 2007;367:174–186. doi: 10.1016/j.jmb.2006.12.053. [DOI] [PubMed] [Google Scholar]
- 12.Linares AJ, Lin CH, Damianov A, Adams KL, Novitch BG, Black DL. The splicing regulator PTBP1 controls the activity of the transcription factor Pbx1 during neuronal differentiation. Elife. 2015;4:e09268. doi: 10.7554/eLife.09268. [DOI] [PMC free article] [PubMed] [Google Scholar]
- 13.La Porta J, Matus-Nicodemos R, Valentin-Acevedo A, Covey LR. The RNA-binding protein, polypyrimidine tract-binding protein 1 (PTBP1) is a key regulator of CD4 T cell activation. PLoS One. 2016;11:e0158708. doi: 10.1371/journal.pone.0158708. [DOI] [PMC free article] [PubMed] [Google Scholar]
- 14.Cheung HC, Corley LJ, Fuller GN, McCutcheon IE, Cote GJ. Polypyrimidine tract binding protein and Notch1 are independently re-expressed in glioma. Mod Pathol. 2006;19:1034–1041. doi: 10.1038/modpathol.3800635. [DOI] [PubMed] [Google Scholar]
- 15.Takahashi H, Nishimura J, Kagawa Y, Kano Y, Takahashi Y, Wu X, Hiraki M, Hamabe A, Konno M, Haraguchi N, Takemasa I, Mizushima T, Ishii M, Mimori K, Ishii H, Doki Y, Mori M, Yamamoto H. Significance of polypyrimidine tract-binding protein 1 expression in colorectal cancer. Mol Cancer Ther. 2015;14:1705–1716. doi: 10.1158/1535-7163.MCT-14-0142. [DOI] [PubMed] [Google Scholar]
- 16.He X, Pool M, Darcy KM, Lim SB, Auersperg N, Coon JS, Beck WT. Knockdown of polypyrimidine tract-binding protein suppresses ovarian tumor cell growth and invasiveness in vitro. Oncogene. 2007;26:4961–4968. doi: 10.1038/sj.onc.1210307. [DOI] [PMC free article] [PubMed] [Google Scholar]
- 17.Jo YK, Roh SA, Lee H, Park NY, Choi ES, Oh JH, Park SJ, Shin JH, Suh YA, Lee EK, Cho DH, Kim JC. Polypyrimidine tract-binding protein 1-mediated down-regulation of ATG10 facilitates metastasis of colorectal cancer cells. Cancer Lett. 2017;385:21–27. doi: 10.1016/j.canlet.2016.11.002. [DOI] [PubMed] [Google Scholar]
- 18.Guo J, Jia J, Jia R. PTBP1 and PTBP2 impaired autoregulation of SRSF3 in cancer cells. Sci Rep. 2015;5:14548. doi: 10.1038/srep14548. [DOI] [PMC free article] [PubMed] [Google Scholar]
- 19.Liang YC, Lin WC, Lin YJ, Lin JC. The impact of RNA binding motif protein 4-regulated splicing cascade on the progression and metabolism of colorectal cancer cells. Oncotarget. 2015;6:38046–38060. doi: 10.18632/oncotarget.5710. [DOI] [PMC free article] [PubMed] [Google Scholar]
- 20.He X, Yuan C, Yang J. Regulation and functional significance of CDC42 alternative splicing in ovarian cancer. Oncotarget. 2015;6:29651–29663. doi: 10.18632/oncotarget.4865. [DOI] [PMC free article] [PubMed] [Google Scholar]
- 21.Calabretta S, Bielli P, Passacantilli I, Pilozzi E, Fendrich V, Capurso G, Fave GD, Sette C. Modulation of PKM alternative splicing by PTBP1 promotes gemcitabine resistance in pancreatic cancer cells. Oncogene. 2016;35:2031–2039. doi: 10.1038/onc.2015.270. [DOI] [PMC free article] [PubMed] [Google Scholar]
- 22.Izaguirre DI, Zhu W, Hai T, Cheung HC, Krahe R, Cote GJ. PTBP1-dependent regulation of USP5 alternative RNA splicing plays a role in glioblastoma tumorigenesis. Mol Carcinog. 2012;51:895–906. doi: 10.1002/mc.20859. [DOI] [PMC free article] [PubMed] [Google Scholar]
- 23.Cheung HC, Hai T, Zhu W, Baggerly KA, Tsavachidis S, Krahe R, Cote GJ. Splicing factors PTBP1 and PTBP2 promote proliferation and migration of glioma cell lines. Brain. 2009;132:2277–2288. doi: 10.1093/brain/awp153. [DOI] [PMC free article] [PubMed] [Google Scholar]
- 24.Christofk HR, Vander Heiden MG, Wu N, Asara JM, Cantley LC. Pyruvate kinase M2 is a phosphotyrosine-binding protein. Nature. 2008;452:181–186. doi: 10.1038/nature06667. [DOI] [PubMed] [Google Scholar]
- 25.Huang L, Yu Z, Zhang Z, Ma W, Song S, Huang G. Interaction with pyruvate kinase M2 destabilizes tristetraprolin by proteasome degradation and regulates cell proliferation in breast cancer. Sci Rep. 2016;6:22449. doi: 10.1038/srep22449. [DOI] [PMC free article] [PubMed] [Google Scholar]
- 26.Deshmukh A, Deshpande K, Arfuso F, Newsholme P, Dharmarajan A. Cancer stem cell metabolism: a potential target for cancer therapy. Mol Cancer. 2016;15:69. doi: 10.1186/s12943-016-0555-x. [DOI] [PMC free article] [PubMed] [Google Scholar]
- 27.Chen X, Xie W, Gu P, Cai Q, Wang B, Xie Y, Dong W, He W, Zhong G, Lin T, Huang J. Upregulated WDR5 promotes proliferation, self-renewal and chemoresistance in bladder cancer via mediating H3K4 trimethylation. Sci Rep. 2015;5:8293. doi: 10.1038/srep08293. [DOI] [PMC free article] [PubMed] [Google Scholar]
- 28.Chen X, Gu P, Xie R, Han J, Liu H, Wang B, Xie W, Xie W, Zhong G, Chen C, Xie S, Jiang N, Lin T, Huang J. Heterogeneous nuclear ribonucleoprotein K is associated with poor prognosis and regulates proliferation and apoptosis in bladder cancer. J Cell Mol Med. 2016 doi: 10.1111/jcmm.12999. [Epub ahead of print] [DOI] [PMC free article] [PubMed] [Google Scholar]
- 29.Fan X, Chen X, Deng W, Zhong G, Cai Q, Lin T. Up-regulated microRNA-143 in cancer stem cells differentiation promotes prostate cancer cells metastasis by modulating FNDC3B expression. BMC Cancer. 2013;13:61. doi: 10.1186/1471-2407-13-61. [DOI] [PMC free article] [PubMed] [Google Scholar]
- 30.Chen X, Gu P, Li K, Xie W, Chen C, Lin T, Huang J. Gene expression profiling of WDR5 regulated genes in bladder cancer. Genom Data. 2015;5:27–29. doi: 10.1016/j.gdata.2015.05.003. [DOI] [PMC free article] [PubMed] [Google Scholar]
- 31.Chen X, Wu J, Liu H, He Z, Gu M, Wang N, Ma J, Hu J, Xia L, He H, Yuan J, Li J, Li L, Li M, Zhu X. Approaches to efficient production of recombinant angiogenesis inhibitor rhVEGI-192 and characterization of its structure and antiangiogenic function. Protein Sci. 2010;19:449–457. doi: 10.1002/pro.323. [DOI] [PMC free article] [PubMed] [Google Scholar]
- 32.Powles T, Staehler M, Ljungberg B, Bensalah K, Canfield SE, Dabestani S, Giles R, Hofmann F, Hora M, Kuczyk MA, Lam T, Marconi L, Merseburger AS, Volpe A, Bex A. Updated EAU guidelines for clear cell renal cancer patients who fail VEGF targeted therapy. Eur Urol. 2016;69:4–6. doi: 10.1016/j.eururo.2015.10.017. [DOI] [PubMed] [Google Scholar]
- 33.Gupta K, Miller JD, Li JZ, Russell MW, Charbonneau C. Epidemiologic and socioeconomic burden of metastatic renal cell carcinoma (mRCC): a literature review. Cancer Treat Rev. 2008;34:193–205. doi: 10.1016/j.ctrv.2007.12.001. [DOI] [PubMed] [Google Scholar]
- 34.Kitamura H, Takahashi A, Takei F, Hotta H, Miyao N, Shindo T, Igarashi M, Tachiki H, Kunishima Y, Muranaka T, Shigyo M, Ikehata Y, Masumori N. Molecular-targeted therapy and surgery may prolong survival of renal cell carcinoma patients with bone metastasis: a multi-institutional retrospective study in Japan. Anticancer Res. 2016;36:5531–5536. doi: 10.21873/anticanres.11136. [DOI] [PubMed] [Google Scholar]
- 35.Zhang S, Wei JS, Li SQ, Badgett TC, Song YK, Agarwal S, Coarfa C, Tolman C, Hurd L, Liao H, He J, Wen X, Liu Z, Thiele CJ, Westermann F, Asgharzadeh S, Seeger RC, Maris JM, Guidry Auvil JM, Smith MA, Kolaczyk ED, Shohet J, Khan J. MYCN controls an alternative RNA splicing program in high-risk metastatic neuroblastoma. Cancer Lett. 2016;371:214–224. doi: 10.1016/j.canlet.2015.11.045. [DOI] [PMC free article] [PubMed] [Google Scholar]
- 36.Sugiyama T, Taniguchi K, Matsuhashi N, Tajirika T, Futamura M, Takai T, Akao Y, Yoshida K. MiR-133b inhibits growth of human gastric cancer cells by silencing PKM-splicer PTBP1. Cancer Sci. 2016;107:1767–1775. doi: 10.1111/cas.13091. [DOI] [PMC free article] [PubMed] [Google Scholar]
- 37.He X, Arslan AD, Ho TT, Yuan C, Stampfer MR, Beck WT. Involvement of polypyrimidine tract-binding protein (PTBP1) in maintaining breast cancer cell growth and malignant properties. Oncogenesis. 2014;3:e84. doi: 10.1038/oncsis.2013.47. [DOI] [PMC free article] [PubMed] [Google Scholar]
- 38.Gorjala P, Cairncross JG, Gary RK. p53-dependent up-regulation of CDKN1A and down-regulation of CCNE2 in response to beryllium. Cell Prolif. 2016;49:698–709. doi: 10.1111/cpr.12291. [DOI] [PMC free article] [PubMed] [Google Scholar]
- 39.Chen D, Guo W, Qiu Z, Wang Q, Li Y, Liang L, Liu L, Huang S, Zhao Y, He X. MicroRNA-30d-5p inhibits tumour cell proliferation and motility by directly targeting CCNE2 in non-small cell lung cancer. Cancer Lett. 2015;362:208–217. doi: 10.1016/j.canlet.2015.03.041. [DOI] [PubMed] [Google Scholar]
- 40.Zhao Z, Liu J, Wang C, Wang Y, Jiang Y, Guo M. MicroRNA-25 regulates small cell lung cancer cell development and cell cycle through cyclin E2. Int J Clin Exp Pathol. 2014;7:7726–7734. [PMC free article] [PubMed] [Google Scholar]
- 41.Micel LN, Tentler JJ, Smith PG, Eckhardt GS. Role of ubiquitin ligases and the proteasome in oncogenesis: novel targets for anticancer therapies. J. Clin. Oncol. 2013;31:1231–1238. doi: 10.1200/JCO.2012.44.0958. [DOI] [PMC free article] [PubMed] [Google Scholar]
- 42.Altenberg B, Greulich KO. Genes of glycolysis are ubiquitously overexpressed in 24 cancer classes. Genomics. 2004;84:1014–1020. doi: 10.1016/j.ygeno.2004.08.010. [DOI] [PubMed] [Google Scholar]
- 43.Christofk HR, Vander Heiden MG, Harris MH, Ramanathan A, Gerszten RE, Wei R, Fleming MD, Schreiber SL, Cantley LC. The M2 splice isoform of pyruvate kinase is important for cancer metabolism and tumour growth. Nature. 2008;452:230–233. doi: 10.1038/nature06734. [DOI] [PubMed] [Google Scholar]
- 44.Das MR, Bag AK, Saha S, Ghosh A, Dey SK, Das P, Mandal C, Ray S, Chakrabarti S, Ray M, Jana SS. Molecular association of glucose-6-phosphate isomerase and pyruvate kinase M2 with glyceraldehyde-3-phosphate dehydrogenase in cancer cells. BMC Cancer. 2016;16:152. doi: 10.1186/s12885-016-2172-x. [DOI] [PMC free article] [PubMed] [Google Scholar]
- 45.Chen G, Feng W, Zhang S, Bian K, Yang Y, Fang C, Chen M, Yang J, Zou X. Metformin inhibits gastric cancer via the inhibition of HIF1alpha/PKM2 signaling. Am J Cancer Res. 2015;5:1423–1434. [PMC free article] [PubMed] [Google Scholar]
- 46.Wu H, Li Z, Wang Y, Yang P, Li Z, Li H, Wu C. MiR-106b-mediated Mfn2 suppression is critical for PKM2 induced mitochondrial fusion. Am J Cancer Res. 2016;6:2221–2234. [PMC free article] [PubMed] [Google Scholar]
- 47.Hsu MC, Hung WC, Yamaguchi H, Lim SO, Liao HW, Tsai CH, Hung MC. Extracellular PKM2 induces cancer proliferation by activating the EGFR signaling pathway. Am J Cancer Res. 2016;6:628–638. [PMC free article] [PubMed] [Google Scholar]
- 48.Liu WR, Tian MX, Yang LX, Lin YL, Jin L, Ding ZB, Shen YH, Peng YF, Gao DM, Zhou J, Qiu SJ, Dai Z, He R, Fan J, Shi YH. PKM2 promotes metastasis by recruiting myeloid-derived suppressor cells and indicates poor prognosis for hepatocellular carcinoma. Oncotarget. 2015;6:846–861. doi: 10.18632/oncotarget.2749. [DOI] [PMC free article] [PubMed] [Google Scholar]
- 49.Hamabe A, Konno M, Tanuma N, Shima H, Tsunekuni K, Kawamoto K, Nishida N, Koseki J, Mimori K, Gotoh N, Yamamoto H, Doki Y, Mori M, Ishii H. Role of pyruvate kinase M2 in transcriptional regulation leading to epithelial-mesenchymal transition. Proc Natl Acad Sci U S A. 2014;111:15526–15531. doi: 10.1073/pnas.1407717111. [DOI] [PMC free article] [PubMed] [Google Scholar]
- 50.Papadaki C, Sfakianaki M, Lagoudaki E, Giagkas G, Ioannidis G, Trypaki M, Tsakalaki E, Voutsina A, Koutsopoulos A, Mavroudis D, Georgoulias V, Souglakos J. PKM2 as a biomarker for chemosensitivity to front-line platinum-based chemotherapy in patients with metastatic non-small-cell lung cancer. Br J Cancer. 2014;111:1757–1764. doi: 10.1038/bjc.2014.492. [DOI] [PMC free article] [PubMed] [Google Scholar]
- 51.Zhu H, Wu J, Zhang W, Luo H, Shen Z, Cheng H, Zhu X. PKM2 enhances chemosensitivity to cisplatin through interaction with the mTOR pathway in cervical cancer. Sci Rep. 2016;6:30788. doi: 10.1038/srep30788. [DOI] [PMC free article] [PubMed] [Google Scholar]
- 52.Lu W, Cao Y, Zhang Y, Li S, Gao J, Wang XA, Mu J, Hu YP, Jiang L, Dong P, Gong W, Liu Y. Up-regulation of PKM2 promote malignancy and related to adverse prognostic risk factor in human gallbladder cancer. Sci Rep. 2016;6:26351. doi: 10.1038/srep26351. [DOI] [PMC free article] [PubMed] [Google Scholar]
Associated Data
This section collects any data citations, data availability statements, or supplementary materials included in this article.


