

Abstract
Objective:
Red cell distribution width (RDW) has been reported to be a predictor of cardiac events in coronary artery disease (CAD). Here, we hypothesized that RDW level on admission would be predictive of adverse outcomes in non-ST elevation acute coronary syndrome (NST-ACS).
Methods:
In total, 202 patients with NST-ACS (159 males and 43 females) were retrospectively analyzed. The patients were divided into two groups based on the 50th percentile of admission RDW levels. A high RDW group (n=100) was defined as those patients having RDW levels of >14.0. The relationship between RDW and primary endpoint (cardiovascular death), secondary endpoints [(reinfarction, repeat target vessel revascularization-percutaneous/surgical)], and major adverse cardiac events (MACE) were assessed. The median follow-up time was 18 (13-24) months.
Results:
The patients in the high RDW group were older (62.9 vs. 57.5, p=0.001). Multivessel disease, low-density lipoprotein, creatinine, platelet, CK-MB, troponin I, and RDW were higher (p=0.047, p=0.003, p=0.012, p=0.012, p=0.017, p<0.001, respectively), and gender (male/female), ejection fraction, and hemoglobin levels were lower (p=0.021, p=0.04, p=0.016, respectively) in the high RDW group. Cardiovascular death and MACE were higher in the high RDW group (16% vs. 4.9%, p=0.01, 52% vs. 31.4%, p=0.003, respectively). By multiple regression analysis in 202 patients, age >65 and RDW >14.0% on admission were found to be powerful independent predictors of cardiovascular mortality (OR: 4.5, 95% CI: 1.5-13.1, p=0.005, OR: 3.0, 95% CI: 1.0-8.9, p=0.039, respectively).
Conclusion:
A high RDW level on admission is associated with increased long-term mortality in patients with NST-ACS.
Keywords: acute coronary syndrome, myocardial infarction, red cell distribution width
Introduction
Acute coronary syndrome (ACS) is a significant cause of morbidity and mortality in patients with coronary heart disease in occidental countries. It is important to identify high-risk patients with ACS to determine who should be treated immediately. Red cell distribution width (RDW), a measurement of the variability and size of erythrocytes, can be easily measured during routine complete blood count (CBC). The relationship between RDW and coronary artery disease (CAD), heart failure (HF), and stroke has been found in recent studies (1-3). High RDW levels are associated with adverse outcomes in patients with ST elevation myocardial infarction (STEMI) and HF (2, 4). The relationship of RDW with adverse outcomes in these patients is not completely understood. Inflammation and neurohormonal and adrenergic system activation may bring about changes in red blood cell maturation by disturbing the red cell membrane, thereby leading to increased RDW (5-7). A correlation between RDW and inflammatory markers has also been reported (8). This study aimed to test the hypothesis that higher RDW levels at admission would be predictive of adverse outcomes in patients with non-ST elevation acute coronary syndrome (NST-ACS).
Methods
Study design
Patients with ACS who were admitted to the coronary care unit of Education and Research Hospital of Çanakkale Onsekiz Mart University between January 2011 and May 2012 were retrospectively evaluated in this study.
Study population
Patients with ACS defined as unstable angina (UA) and non-STEMI (NSTEMI). Patients with anemia (hemoglobin <13 gr/dL for men, <12 gr/dL for women), renal insufficiency (glomerular filtration rate <90 mL/min/1.73 m2 according to the Modification of Diet in Renal Disease formula), clinical evidence of cancer, active infection, hematological proliferative diseases, active or chronic inflammatory or autoimmune diseases, pregnancy, recent blood transfusion, and a history of chronic obstructive pulmonary disease (COPD) were excluded from the study. There were 66 patients who were excluded from the final analysis: 20 with anemia, 15 with renal insufficiency, 15 with COPD, 11 with active infection, and 5 with recent blood transfusion. Therefore, a total of 202 patients diagnosed with NST-ACS were included in the analysis. The study protocol was approved by the local Ethics Committee of our hospital.
Study protocol
The study population was divided into two groups based on the 50th percentile of admission RDW values. A high RDW group (n=100) and a low RDW group (n=102) were defined as having RDW levels of >14.0 and <14.0, respectively. Complete blood counts and biochemical values were evaluated retrospectively from blood samples obtained by antecubital vein puncture upon admission to the emergency department. Transthoracic echocardiography was performed on each patient immediately in the coronary care unit. Angiographic data of the patients were evaluated from catheter laboratory records.
Study variables
The diagnosis of ACS was based on the criteria of the Joint European Society of Cardiology/American College of Cardiology Foundation/American Heart Association/Word Heart Federation Task definition (9). UA was diagnosed according to the following criteria: typical chest pain and/or electrocardiographic changes indicating myocardial ischemia with negative cardiac enzymes. An NSTEMI diagnosis was based on elevated cardiac enzymes with typical chest pain and/or electrocardiographic changes suggestive of myocardial ischemia. Typical chest pain was evaluated as follows: more than 20 minutes (min) in duration, new-onset angina, and an increase in its frequency and duration or severity. Demographic information, cardiovascular history, and risk factors [i.e., smoking, hypertension (HT), and diabetes mellitus (DM)] were obtained from the patients’ medical records. Patients who had been treated with antihypertensive drugs or those whose baseline blood pressure exceeded 140/90 mm Hg were diagnosed with HT (10). Patients with DM were defined as being prediagnosed and/or being antidiabetic medications or newly diagnosed if fasting plasma glucose was >126 mg/dL or blood glucose was >200 mg/dL at any time (11).
Analysis of blood samples
CBCs and biochemical values were retrospectively evaluated from blood samples obtained by antecubital vein puncture upon admission to the emergency department. The hemogram parameters and other biochemical measurements were determined using standard biochemical techniques with the Beckman Coulter LH 780 (Beckman Coulter Ireland Inc. Mervue, Galway, Ireland) device in the hematology laboratory of our institution.
Echocardiography
Transthoracic echocardiography was performed on each patient immediately in the coronary care unit. All measurements were performed using a commercially available machine (Vivid 7®, GE Vingmed Ultrasound A/S, Horten, Norway) with a 3.5MHz transducer. Simpson’s method was used to assess the left ventricular ejection fraction (LVEF), as recommended by the American Society of Echocardiography (12).
Coronary angiography
All patients underwent a coronary angiography by the femoral approach using the standard Judkins technique. Iopromide as a contrast agent (Ultravist-370, Bayer Schering Pharma, Germany) and a 6 F diagnostic catheter were used in all subjects. Diameter stenosis >70% with quantitative angiography was accepted as significant. The extent and severity of CAD were assessed by the Gensini score (13).
Follow-up
Follow-up data were obtained by interviewing (directly or by telephone) patients, their families, or their personal physicians. The median follow-up time was 18 (13-24) months. The primary endpoint was defined as cardiovascular death (CVD), and secondary endpoints were defined as reinfarction and repeat target vessel revascularization (percutaneous or surgical). Death was classified as cardiac death if the primary cause was related to myocardial infarction (MI), arrhythmia, refractory congestive HF, or sudden death. Reinfarction was defined as ischemic pain or other symptoms consistent with acute cardiac ischemia persisting until relieved by analgesia or nitrates, accompanied by new electrocardiographic changes in the territory of the initial event. These features had to be accompanied by new elevation of creatine kinase or other markers of cardiac necrosis to more than the upper limit of normal an increase to a value of 50% greater than the previous value (14). Major adverse cardiac events (MACE) included both defined primary and secondary endpoints.
Statistical analysis
All statistical analyses were performed using the SPSS program (version 17.0, SPSS, Chicago, IL, USA). Quantitative variables were expressed as the median (min-max), and qualitative variables were expressed as percentages (%). All measurements were evaluated with the Kolmogorov-Smirnov test. A comparison of continuous numeric values between groups was performed using the Mann-Whitney U or student t-test. Categorical variables were compared by the x2 test or Fisher’s exact test. A multiple regression analysis, which included variables with p<0.1 in the univariate analysis, was performed to identify independent predictors of long-term cardiovascular mortality. Age >65, RDW >14%, and LVEF <50% were entered into the model. A receiver operating characteristic (ROC) curve analysis was applied for the relationship between RDW and mortality. A p value of <0.05 was considered significant.
Results
A total of 202 patients (159 men and 43 women) were enrolled in this study. Table 1 demonstrates the baseline characteristics and laboratory findings of the groups.
Table 1.
The baseline characteristics and laboratory findings of patients with low and high RDW
| Variable | Low RDW (≤14.0) n=102 | High RDW (>14.0) n=100 | P |
|---|---|---|---|
| Gender (M/F) | 87/15 | 72/28 | 0.021 |
| Age, years | 57.5±11.8 | 62.9±11.1 | 0.001 |
| Heart rate, bpm | 77±12 | 79±13 | 0.242 |
| Body mass index, kg/m2 | 27.3±3.8 | 27.3±4 | 0.997 |
| Hypertension % (n) | 44.1 (45) | 56.0 (56) | 0.091 |
| Diabetes mellitus % (n) | 26.5 (27) | 29 (29) | 0.688 |
| Current smoker % (n) | 46.1 (47) | 40 (40) | 0.383 |
| Previous MI % (n) | 6.9 (7) | 12 (12) | 0.211 |
| Previous CABG % (n) | 0 (0) | 2 (2) | 0.151 |
| Previous PCI % (n) | 17.6 (18) | 12.0 (12) | 0.259 |
| Non-ST elevation MI % (n) | 56.9 (58) | 66.0 (66) | 0.182 |
| Number of diseased vessel % (n) | 0.02 | ||
| 1 | 46.1 (47)* | 30 (30)* | |
| 2 | 34.3 (35) | 35 (35) | |
| 3 | 19.6 (20)* | 35 (35)* | |
| Culprit lesion % (n) | 0.562 | ||
| LAD | 39.2 (40) | 41(41) | |
| Cx | 31.4 (32) | 36 (36) | |
| RCA | 29.4 (30) | 23 (23) | |
| Ejection fraction (%) | 55 (25-65) | 50 (25-65) | 0.04 |
| Gensini score | 38.5 (8-101) | 33 (8-112) | 0.200 |
| Total cholesterol, mg/dL | 183.9 (92.8-370.2) | 201.4 (99-613) | 0.066 |
| Low-density lipoprotein, mg/dL | 118.0 (35-312) | 127 (39-246) | 0.047 |
| High-density lipoprotein, mg/dL | 41 (30-95) | 40 (26-98) | 0.741 |
| Triglyceride, mg/dL | 117 (35-1024) | 116 (32-1950) | 0.657 |
| Creatinine, mg/dL | 0.7 (0.46-0.96) | 0.75 (0.6-0.97) | 0.003 |
| Hemoglobin, gr/dL | 14 (12-17.1) | 13.5 (12-17.3) | 0.016 |
| Mean platelet volume, fL | 8.5 (6.4-11) | 8.6 (6.3-10.5) | 0.900 |
| Platelet, 103/mm3 | 214 (132-501) | 244 (79-432) | 0.012 |
| White blood cell, 103/mm3 | 8.8 (4.6-17.4) | 9.8 (4-19) | 0.141 |
| Neutrophil, 103/mm3 | 5.6 (2.8-15) | 6.2 (1.3-15.5) | 0.165 |
| Lymphocyte, 103/mm3 | 2.2 (0.5-5.3) | 2.2 (0.5-12.2) | 0.726 |
| Creatine kinase-MB, ng/mL | 26 (7-180) | 32.5 (9-252) | 0.012 |
| Troponin I, ng/dL | 0.85 (0-67) | 2.75 (0-50) | 0.017 |
| Red cell distribution width, % | 13.3 (12.3-14) | 14.8 (14.1-18.7) | <0.001 |
; statistically significant.
CABG - coronary artery bypass graft; Cx - circumflex; LAD - left anterior descending; MI - myocardial infarction; PCI - percutaneous coronary intervention; RCA - right coronary artery
The patients in the high RDW group were older (mean age: 62.9±11.1 years) compared with those in the low RDW group (mean age: 57.5±11.8 years) (p=0.001). Compared with the low RDW group, gender (male/female), LVEF, and hemoglobin levels were significantly lower (p=0.021, p=0.04, p=0.016, respectively) in the high RDW group (Table 1). Compared with the low RDW group, multivessel disease, LDL, creatinine, platelet levels, creatine kinase-MB, troponin I, and RDW were significantly higher in the high RDW group (p=0.02, p=0.047, p=0.003, p=0.012, p=0.012, p=0.017, p<0.001, respectively; Table 1). Additionally, CVD and re-infarction were significantly higher in the high RDW group (p=0.01 and p=0.03, respectively). MACE were increased in the high RDW group (52% vs. 31.4%, p=0.003), but there were no significant differences between PCI and CABG between the groups (Table 2).
Table 2.
Primary and secondary endpoints with low and high RDW groups
| Variable | Low RDW (≤14.0) n=102 | High RDW (>14.0) n=100 | P |
|---|---|---|---|
| Primary endpoints | |||
| CVD % (n) | 4.9 (5) | 16 (16) | 0.01 |
| Secondary endpoints | |||
| Reinfarction % (n) | 7.8 (8) | 18 (18) | 0.03 |
| PCI % (n) | 21.6 (22) | 31 (31) | 0.128 |
| CABG % (n) | 7.8 (8) | 14 (14) | 0.160 |
| MACE % (n) | 31.4 (32) | 52 (52) | 0.003 |
CABG - coronary artery bypass graft; CVD - cardiovascular death; MACE - major adverse cardiac events; PCI - percutaneous coronary intervention; RDW - red cell distribution width
In the subgroup analysis of the study patients according to CVD, the patients in the CVD(+) group were older than those in the CVD(-) group (p=0.005). LVEF and lymphocyte levels were significantly lower (p=0.045, p=0.009, respectively) and RDW was significantly higher in the CVD(+) group (p<0.001). Table 3 demonstrates the characteristics and laboratory findings of the CVD(+) and CVD(-) groups. Independent predictors of CVD were determined by using multiple regression analysis. The variables age >65, LVEF <50%, and an RDW of >14% were found to be associated with CVD. Age >65 and an RDW of >14% (odds ratio: 4.5, 95% confidence interval: 1.5-13.1, p=0.005, odds ratio: 3.0, 95% confidence interval: 1.0-8.9, p=0.039, respectively) were found to be independent predictors of CVD in the multiple regression analyses (Table 4). The receiver operating characteristic (ROC) curve analysis is shown in Figure 1. According to the ROC analysis, the optimal cut-off value of RDW to predict CVD was >14.0%, with 76% sensitivity and 54% specificity (area under the curve: 0.779, p<0.001).
Table 3.
The baseline characteristics and laboratory findings of patients with or without cardiovascular death
| Variable | CVD (-), n=181 | CVD (+), n=21 | P |
|---|---|---|---|
| Gender, M/F | 143/38 | 16/5 | 0.765 |
| Age, years | 56.3±11.5 | 66.9±12 | 0.005 |
| Heart rate, bpm | 78±13 | 66±12 | 0.887 |
| Body mass index, kg/m2 | 27.1 ±3.8 | 28.3±4.4 | 0.187 |
| Hypertension % (n) | 50.8 (92) | 42.9 (9) | 0.489 |
| Diabetes mellitus % (n) | 26.0 (47) | 42.9 (9) | 0.102 |
| Current smoker % (n) | 44.2 (80) | 33.3 (7) | 0.341 |
| Previous MI % (n) | 9.4 (17) | 9.5 (2) | 0.984 |
| Previous CABG % (n) | 0.6 (1) | 4.8 (1) | 0.065 |
| Previous PCI % (n) | 15.5 (28) | 9.5 (2) | 0.468 |
| Non-ST elevation MI % (n) | 60.2 (109) | 71.4 (15) | 0.318 |
| Number of diseased vessels % (n) | 0.752 | ||
| 1 | 38.1 (69) | 38.1 (8) | |
| 2 | 35.4 (64) | 28.6 (6) | |
| 3 | 26.5 (48) | 33.3 (7) | |
| Culprit lesion % (n) | 0.899 | ||
| LAD | 40.3 (73) | 38.1 (8) | |
| Cx | 33.1 (60) | 38.1 (8) | |
| RCA | 26.5 (48) | 23.8 (5) | |
| Ejection fraction (%) | 55 (25-65) | 45 (25-65) | 0.045 |
| Gensini score | 36 (8-101) | 39 (10-112) | 0.275 |
| Total cholesterol, mg/dL | 195 (97-613) | 177 (92-281) | 0.05 |
| Low-density lipoprotein, mg/dL | 120 (35-312) | 109(51-224) | 0.126 |
| High-density lipoprotein, mg/dL | 40 (24-98) | 38 (30-78) | 0.502 |
| Triglyceride, mg/dL | 117 (35-1950) | 112 (32-440) | 0.316 |
| Creatinine, mg/dL | 0.7 (0.46-0.97) | 0.7 (0.7-0.92) | 0.738 |
| Hemoglobin, gr/dL | 13.7 (12-17.3) | 13.3 (12-15) | 0.168 |
| Mean platelet volume, fL | 8.6 (6.3-11) | 8.8 (6.8-10.2) | 0.712 |
| Platelet, 103/mm3 | 236(79-501) | 228(143-351) | 0.276 |
| White blood cell, 103/mm3 | 9.4 (4-17.4) | 9.1 (4.8-19) | 0.328 |
| Neutrophil, 103/mm3 | 5.7 (1.3-15.2) | 6.6 (3.2-15.5) | 0.696 |
| Lymphocyte, 103/mm3 | 2.2 (0.5-12.2) | 1.8 (0.8-8.3) | 0.009 |
| Creatine kinase-MB, ng/mL | 28 (7-252) | 29 (12-118) | 0.218 |
| Troponin I, ng/dL | 1.5 (0-67) | 5.7 (0-38.8) | 0.139 |
| Red cell distribution width (%) | 13.9 (12.3-18.5) | 16 (12.6-18.7) | <0.001 |
CABG - coronary artery bypass graft; Cx - circumflex; CVD - cardiovascular death; LAD - left anterior descending; MI - myocardial infarction; PCI - percutaneous coronary intervention; RCA - right coronary artery
Table 4.
Univariate and multivariate analysis for study patients
| Unadjusted | Adjusted* | |||
|---|---|---|---|---|
| Variable | OR (95% CI) | P | OR (95% CI) | P |
| Age > 65 | 4.1 (1.8-14.8) | 0.002 | 4.5 (1.5-13.1) | 0.005 |
| Diabetes mellitus | 0.4 (0.1-.1.1) | 0.108 | ||
| Ejection fraction <50% | 2.9 (1.1-7.4) | 0.02 | ||
| Hemoglobin | 0.7 (0.4-1.1) | 0.142 | ||
| RDW >14 | 3.6 (1.2-10.5) | 0.014 | 3.0 (1.0-8.9) | 0.039 |
| Multivessel disease (>2 vessel) | 1.3 (0.5-3.6) | 0.508 | ||
| Gensini score >20 | 0.7 (0.2-2.0) | 0.585 | ||
| Creatine kinase-MB | 1.0 (0.9-1.0) | 0.489 | ||
| Troponin I | 1.0 (0.9-1.0) | 0.236 | ||
| NSTEMI | 1.6 (0.6-4.4) | 0.322 | ||
Analysis of backward-stepwise multiple regression;
CI - confidence interval; NSTEMI - non-ST elevation myocardial infarction; OR - odds ratio; RDW - red cell distribution width
Figure 1.
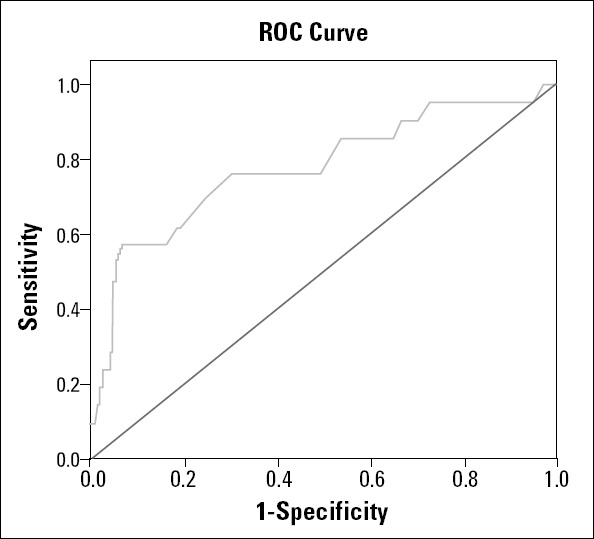
Receiver operating characteristic (ROC) curve analysis to determine the best cut-off value for the relationship between red cell distribution width and cardiovascular death
Discussion
Our study results demonstrate that an elevated baseline RDW level is independently associated with increased long-term mortality in patients with NST-ACS. RDW, an indicator of the variability of circulating RBC size, is often used to diagnose different types of anemia. Recent studies have reported relationships between RDW and CAD, HF, and stroke (1-3). Felker et al. (15) and Uyarel et al. (4) reported that high RDW levels were associated with adverse outcomes in patients with HF and STEMI.
High RDW was associated with both the severity of coronary lesions and mortality in patients with stable angina pectoris (16, 17). Cavuşoğlu et al. (18) reported that high RDW levels were predictive of any mortality in a 2-year follow-up in patients with angiographically detected CAD, including ACS. Furthermore, Wang et al. (19) demonstrated that high RDW was an independent predictor of reinfarction, HF, and 1-month mortality in patients with ACS. Additionally, high RDW was associated with thrombus burden, poor reperfusion, in-hospital mortality, and long-term mortality in patients with STEMI treated with PCI (20, 21). Moreover, Gül et al. (22) reported that high RDW has a predictive value for reinfarction, hospitalization due to HF, and mortality during long-term follow-up of patients with NST-ACS. Similarly, Tanboğa et al. (23) demonstrated that high RDW was an independent predictor of impaired coronary collateral circulation in patients with NSTEMI.
The relationship between RDW and adverse outcomes in these patient groups is not completely understood. Weiss et al. (5) demonstrated that inflammation may bring about changes in red blood cell maturation by disturbing the red cell membrane, thereby leading to increased RDW. Moreover, Lippi et al. (8) reported a correlation between RDW and inflammatory markers, such as C-reactive protein and sedimentation rate. Furthermore, Pascual-Figal et al. (24) and Al-Najjar et al. (25) demonstrated that inflammatory cytokines suppress the maturation of erythrocytes, allowing juvenile erythrocytes to enter the circulation, thereby leading to an increase in the heterogeneity of the size of these cells. These results suggest that inflammation may have a key role in the underlying biological mechanism responsible for increased RDW levels. During the inflammatory process, cytokines might affect bone marrow function and erythrocyte maturation induced by erythropoietin, elevating RDW levels (26, 27).
Other mechanisms that have been proposed to explain the relationship between mortality and high RDW are cachexia, impaired renal function, trauma, hemodynamic compromise, and hypoalbuminemia (28-30). On the other hand, we know from the studies of Kato et al. (6) and Cole et al. (7) that erythropoiesis is influenced by neurohormonal and adrenergic system activation. Their study results indicate that erythroid progenitor cells become directly stimulated with increased angiotensin II, and RDW subsequently is increased. We think that the mechanistic link between an elevated RDW level and long-term mortality, including CVD and reinfarction after NST-ACS, may be the result of an effect of neurohormonal and adrenergic activation in patients with ACS. More studies are needed to completely understand the mechanism of the pathophysiological relationship between RDW and clinical outcomes.
The high RDW group in our study population had some differences from a previous study published by Gül et al. (22). Their study population included high-risk patients; the patients in their high RDW group were more likely to have a history of HT, PCI, or MI. In contrast, there were no significant differences in risk factors for cardiovascular events between the high and low RDW groups in our study. The results of our study similarly include CVD and reinfarction but also repeat target vessel revascularization (PCI/CABG), different from the previous studies. As reported, the associations found between RDW and CVD were strong, regardless of anemia status, renal insufficiency, and other potential risk factors. These results also add new relevant knowledge.
Study limitations
Our study has some limitations. First, this was a retrospective study based on a relatively small number of patients. Second, RDW levels may increase in some conditions, such as impaired iron metabolism, suppressed erythropoietin gene expression, inhibition of proliferation of erythroid progenitor cells, downregulation of erythropoietin receptor expression, and reduced erythrocyte circulatory half-life (5). Elevated RDW levels are associated with conditions, such as iron, vitamin B12, or folate deficiency; reticulocyte count; erythropoietin levels; and measures of hemolysis. These parameters were not measured in this study. Third, one of the most important limitations was the failure to measure inflammation parameters, such as high-sensitivity CRP and matrix metalloproteinase 9, which could be helpful in evaluating the relationship between RDW and long-term mortality in patients with NST-ACS.
Conclusion
A high RDW level on admission is associated with increased long-term mortality and MACE in patients with NST-ACS. RDW levels are available through routine applications using simple and inexpensive methods for evaluating patients with ACS. In addition, elevated RDW levels may be helpful in identifying high-risk patients and determining appropriate treatment strategies.
Footnotes
Conflict of interest: None declared.
Peer-review: Externally peer-reviewed.
Authorship contributions: Concept - A.B., E. T., G.E.; Design - A.B., G.E.; Supervision - A.B., E. T.; Resource - A.B., A. T., A.Barutçu., B. A.; Materials - A.Barutçu.; Data collection and/or processing - E.G., M.Y., F.G.; Analysis and/or Interpretation - A.B., F.G.; Literature search - M.Y., E.G.; Writing - A.B., G.E.; Critical review - A.B., E. T., E.G.; Other - B. A., A. T.
References
- 1.Tonelli M, Sacks F, Arnold M, Moye L, Davis B, Pfeffer M. Relation between red blood cell distribution width and cardiovascular event rate in people with coronary disease. Circulation. 2008;117:163–8. doi: 10.1161/CIRCULATIONAHA.107.727545. [CrossRef] [DOI] [PubMed] [Google Scholar]
- 2.Van Kimmenade RR, Mohammed AA, Uthamalingam S, Van der Meer P, Felker GM, Januzzi JL., Jr Red blood cell distribution width and 1-year mortality in acute heart failure. Eur J Heart Fail. 2010;12:129–36. doi: 10.1093/eurjhf/hfp179. [CrossRef] [DOI] [PubMed] [Google Scholar]
- 3.Ani C, Ovbiagele B. Elevated red blood cell distribution width predicts mortality in persons with known stroke. J Neurol Sci. 2009;277:103–8. doi: 10.1016/j.jns.2008.10.024. [CrossRef] [DOI] [PubMed] [Google Scholar]
- 4.Uyarel H, Ergelen M, Çicek G, Kaya MG, Ayhan E, Türkkan C, et al. Red cell distribution width as a novel prognostic marker in patients undergoing primary angioplasty for acute myocardial infarction. Coron Artery Dis. 2011;22:138–44. doi: 10.1097/MCA.0b013e328342c77b. [CrossRef] [DOI] [PubMed] [Google Scholar]
- 5.Weiss G, Goodnough LT. Anemia of chronic disease. New Engl J Med. 2005;352:1011–23. doi: 10.1056/NEJMra041809. [CrossRef] [DOI] [PubMed] [Google Scholar]
- 6.Kato H, Ishida J, Imagawa S, Saito T, Suzuki N, Matsuoka T, et al. Enhanced erythropoiesis mediated by activation of the renin angiotensin system via angiotensin II type 1a receptor. FASEB J. 2005;19:2023–5. doi: 10.1096/fj.05-3820fje. [DOI] [PubMed] [Google Scholar]
- 7.Cole J, Ertoy D, Lin H, Sutliff RL, Ezan E, Guyene TT, et al. Lack of angiotensin II-facilitated erythropoiesis causes anemia in angiotensin-converting enzyme-deficient mice. J Clin Invest. 2000;106:1391–8. doi: 10.1172/JCI10557. [CrossRef] [DOI] [PMC free article] [PubMed] [Google Scholar]
- 8.Lippi G, Targher G, Montagnana M, Salvagno GL, Zoppini G, Guidi GC. Relation between red blood cell distribution width and inflammatory biomarkers in a large cohort of unselected outpatients. Arch Pathol Lab Med. 2009;133:628–32. doi: 10.5858/133.4.628. [DOI] [PubMed] [Google Scholar]
- 9.Thygesen K, Alpert J S, White HD, Jaffe AS, Apple FS, Galvani M. on behalf of the Joint ESC/ACCF/AHA/WHF Task Force for the redefinition of myocardial infarction Universal definition of myocardial infarction. Circulation. 2007;116:2634–53. doi: 10.1161/CIRCULATIONAHA.107.187397. [CrossRef] [DOI] [PubMed] [Google Scholar]
- 10.James PA, Oparil S, Carter BL, Cushman WC, Dennison-Himmelfarb C, Handler J, et al. 2014 evidence-based guideline for the management of high blood pressure in adults: report from the panel members appointed to the eighth Joint National Committee (JNC 8) JAMA. 2014;311:507–20. doi: 10.1001/jama.2013.284427. [CrossRef] [DOI] [PubMed] [Google Scholar]
- 11.American Diabetes Association. Diagnosis and classification of diabetes mellitus. Diabetes Care. 2011;34:62–9. [CrossRef] [Google Scholar]
- 12.Lang RM, Bierig M, Devereux RB, Flachskampf FA, Foster E, Pellikka PA, et al. Recommendations for chamber quantification. Eur J Echocardiogr. 2006;2:79–108. doi: 10.1016/j.euje.2005.12.014. [CrossRef] [DOI] [PubMed] [Google Scholar]
- 13.Gensini GG. A more meaningful scoring system for determining the severity of coronary heart disease. Am J Cardiol. 1983;51:606. doi: 10.1016/s0002-9149(83)80105-2. [CrossRef] [DOI] [PubMed] [Google Scholar]
- 14.Horne S, Weston C, Quinn T, Hicks A, Walker L, Chen R, et al. The impact of the pre-hospital thrombolytic treatment on re-infarction rates: analysis of the Myocardial Infarction National Audit Project (MINAP) Heart. 2009;95:559–63. doi: 10.1136/hrt.2007.126821. [CrossRef] [DOI] [PubMed] [Google Scholar]
- 15.Felker GM, Allen LA, Pocock SJ, Shaw LK, McMurray JJ, Pfeffer MA, et al. Red cell distribution width as a novel prognostic marker in heart failure: data from the CHARM Program and the Duke Databank. J Am Coll Cardiol. 2007;50:40–7. doi: 10.1016/j.jacc.2007.02.067. [CrossRef] [DOI] [PubMed] [Google Scholar]
- 16.Işık T, Uyarel H, Tanboğa IH, Kurt M, Ekinci M, Kaya A, et al. Relation of red cell distribution width with the presence, severity, and complexity of coronary artery disease. Coron Artery Dis. 2012;23:51–6. doi: 10.1097/MCA.0b013e32834e4f5c. [CrossRef] [DOI] [PubMed] [Google Scholar]
- 17.Lappe JM, Horne BD, Shah SH, May HT, Muhlestein JB, Lappé DL, et al. Red cell distribution width, C-reactive protein, the complete blood count, and mortality in patients with coronary disease and a normal comparison population. Clin Chim Acta. 2011;412:2094–9. doi: 10.1016/j.cca.2011.07.018. [CrossRef] [DOI] [PubMed] [Google Scholar]
- 18.Cavuşoğlu E, Chopra V, Gupta A, Battala VR, Poludasu S, Eng C, et al. Relation between red blood cell distribution width (RDW) and all-cause mortality at two years in an unselected population referred for coronary angiography. Int J Cardiol. 2010;141:141–6. doi: 10.1016/j.ijcard.2008.11.187. [CrossRef] [DOI] [PubMed] [Google Scholar]
- 19.Wang YL, Hua Q, Bai CR, Tang Q. Relationship between red cell distribution width and short-term outcomes in acute coronary syndrome in a Chinese population. Intern Med. 2011;50:2941–5. doi: 10.2169/internalmedicine.50.6407. [CrossRef] [DOI] [PubMed] [Google Scholar]
- 20.Tanboğa IH, Topçu S, Aksakal E, Kalkan K, Sevimli S, Açıkel M. Determinants of angiographic thrombus burden in patients with ST-segment elevation myocardial infarction. Clin Appl Thromb Hemost. 2013 Mar 27; doi: 10.1177/1076029613483169. Ebup ahead of print. [DOI] [PubMed] [Google Scholar]
- 21.Karabulut A, Uyarel H, Uzunlar B, Çakmak M. Elevated red cell distribution width level predicts worse post-interventional thrombolysis in myocardial infarction flow reflecting abnormal reperfusion in acute myocardial infarction treated with a primary coronary intervention. Coron Artery Dis. 2012;23:68–72. doi: 10.1097/MCA.0b013e32834f1188. [CrossRef] [DOI] [PubMed] [Google Scholar]
- 22.Gül M, Uyarel H, Ergelen M, Karaçimen D, Uğur M, Türer A, et al. The relationship between red blood cell distribution width and the clinical outcomes in non-ST elevation myocardial infarction and unstable angina pectoris: a 3-year follow-up. Coronary Artery Dis. 2012;23:330–6. doi: 10.1097/MCA.0b013e3283564986. [CrossRef] [DOI] [PubMed] [Google Scholar]
- 23.Tanboğa IH, Topçu S, Nacar T, Aksakal E, Kalkan K, Kiki I, et al. Relation of coronary collateral circulation with red cell distribution width in patients with non-ST elevation myocardial infarction. Clin Appl Thromb Hemost. 2014;20:411–5. doi: 10.1177/1076029612470490. [CrossRef] [DOI] [PubMed] [Google Scholar]
- 24.Pascual-Figal DA, Bonaque JC, Redondo B, Caro C, Manzano-Fernandez S, Sánchez-Mas J, et al. Red blood cell distribution width predicts long-term outcome regardless of anaemia status in acute heart failure patients. Eur J Heart Fail. 2009;11:840–6. doi: 10.1093/eurjhf/hfp109. [CrossRef] [DOI] [PubMed] [Google Scholar]
- 25.Al-Najjar Y, Goode KM, Zhang J, Cleland JG, Clark AL. Red cell distribution width: an inexpensive and powerful prognostic marker in heart failure. Eur J Heart Fail. 2009;11:1155–62. doi: 10.1093/eurjhf/hfp147. [CrossRef] [DOI] [PubMed] [Google Scholar]
- 26.Zorlu A, Bektaşoğlu G, Güven FM, Doğan OT, Gücük E, Ege MR, et al. Usefulness of admission red cell distribution width as predictor of early mortality in patients with acute pulmonary embolism. Am J Cardiol. 2012;109:128–34. doi: 10.1016/j.amjcard.2011.08.015. [CrossRef] [DOI] [PubMed] [Google Scholar]
- 27.Pereira IA, Borba EF. The role of inflammation, humoral and cell mediated autoimmunity in the pathogenesis of atherosclerosis. Swiss Med Wkly. 2008;138:534–9. doi: 10.4414/smw.2008.12287. [DOI] [PubMed] [Google Scholar]
- 28.Forhecz Z, Gombos T, Borgulya G, Pozsonyi Z, Prohaszka Z, Janoskuti L. Red cell distribution width in heart failure: prediction of clinical events and relationship with markers of ineffective erythropoiesis, inflammation, renal function, and nutritional state. Am Heart J. 2009;158:659–66. doi: 10.1016/j.ahj.2009.07.024. [CrossRef] [DOI] [PubMed] [Google Scholar]
- 29.Lippi G, Targher G, Montagnana M, Salvagno GL, Zoppini G, Guidi GC. Relationship between red blood cell distribution width and kidney function tests in a large cohort of unselected outpatients. Scand J Clin Lab Invest. 2008;68:745–8. doi: 10.1080/00365510802213550. [CrossRef] [DOI] [PubMed] [Google Scholar]
- 30.Kinugasa Y, Kato M, Sugihara S, Hirai M, Kotani K, Ishida K, et al. A simple risk score to predict in-hospital death of elderly patients with acute decompensated heart failure-hypoalbuminemia as an additional prognostic factor. Circ J. 2009;73:2276–81. doi: 10.1253/circj.cj-09-0498. [CrossRef] [DOI] [PubMed] [Google Scholar]