

Abstract
Objective:
Obesity causes subclinical inflammation. Leukocyte count and high-sensitivity C-reactive protein (hs-CRP) are used to indicate inflammation in clinical practice. Also, inflammatory markers are evaluated as important indicators of cardiovascular risk in patients with obesity and metabolic syndrome (MetS). We aimed to investigate the usage of the neutrophil-lymphocyte ratio (NLR) as an inflammatory marker in obese patients with and without MetS.
Methods:
The study included a total of 1267 patients. The patients were assigned groups according to degree of obesity and status of MetS. Metabolic and inflammatory markers were compared between groups, and correlation analysis was performed.
Results:
Leukocyte count and hs-CRP were significantly different (p<0.001), but NLR was not different between body mass index (BMI) groups (p=0.168). Both lymphocyte and neutrophil counts were significantly increased with increased degree of obesity (p<0.001, p=0.028, respectively). Leukocyte, neutrophil, and lymphocyte counts and hs-CRP level showed a significant correlation with BMI (r=0.198, p<0.001; r=0.163, p<0.001; r=0.167, p<0.001; r=0.445, p<0.001, respectively), whereas NLR was not correlated with BMI (r=0.017, p=0.737). Only a significant association between a MetS severity of 5 and 4 with hs-CRP level was observed (p=0.028), whereas there was no statistically significant association for leukocyte count and NLR (p=0.246; p=0.643, respectively).
Conclusion:
NLR was not a good indicator of inflammation, while leukocyte and hs-CRP were more useful biomarkers to indicate inflammation in non-diabetic patients with obesity and MetS.
Keywords: metabolic syndrome, neutrophil-lymphocyte ratio, obesity, inflammation
Introduction
Obesity has been a growing problem in the world, and it is becoming a pandemic. Metabolic syndrome (MetS) is a metabolic disorder that is related with the increased prevalence of obesity, overeating, sedentary lifestyle, and excess adiposity (1). MetS includes risk factors, such as abdominal obesity, insulin resistance, dyslipidemia, and hypertension (HT), and is associated with other comorbidities, including the prothrombotic state, proinflammatory state, nonalcoholic fatty liver disease, and reproductive disorders (2). Although the exact etiology and related contribution of obesity-associated systemic inflammation are not fully understood, it has been suggested that the direct activation of immune cells in circulation may be involved, as well as inflammatory processes involving immune cells within specific tissues, including the liver, pancreas, muscle, and adipose tissue. Especially, adipose tissue has been offered as both an initiator and the main contributor to systemic inflammation (3, 4). Adipose tissue inflammation causes major events of immune responses, such as the early participation of neutrophils, the following procurement of diverse lymphocyte types, and final procurement of both macrophage and mast cell polarization (5, 6). Some studies have suggested dynamic transitions from the classical pro-inflammatory cascades to the resolution of inflammation and tissue remodeling processes with adipose inflammation in obesity (7, 8).
Several studies have shown total white blood cell (WBC) counts as an independent risk marker for diabetes cases, deteriorated insulin sensitivity, MetS, or coronary artery disease (CAD) (9-11). Also, the range of WBC counts usually alters according to diverse obesity-related factors, as well as genetic, environment, and social factors; height; gender; ethnic background; education level; smoking; and fitness level in the population. Although obesity was suggested as a cause of leukocytosis, in most studies, the values are well within the normal interval (12, 13). Also, recent studies have demonstrated that elevated neutrophils and total WBC counts are potentially related to obesity-induced dysmetabolism, as based on both animal and human experiments (14-18).
The aim of the present study was to investigate the usage of neutrophil-lymphocyte ratio (NLR) as an inflammatory marker in obese patients with and without MetS in addition to other biochemical clinical parameters related to inflammation risk factors.
Methods
Patient enrollment and data collection
The study was designed as cross-sectional and was carried out in a tertiary hospital (Düzce University Hospital) within a 1-year period (January 2012-December 2013). The patients who were consecutively admitted to the out-patient clinic of the family medicine department were enrolled. The following conditions were excluded: diabetes mellitus, cardiac disease, renal disease, pulmonary disease, pregnancy, and suspected infectious disease. The socio-demographic features (gender, age, and smoking status), anthropometric measurements (height, weight, waist circumference, hip circumference), and blood pressure measurement were noted. Body mass index (BMI) was computed by dividing weight (kg) by height (m2) squared. Blood pressure recordings were performed with a sphygmomanometer (Erka, Erlangen, Germany) after 10 min of rest in the seated position, and the right arm was used. The mean of three measurements of each patient was recorded. Weight was measured without shoes in light indoor clothes using a bio-impedance meter (Omron BF 510; Omron Corp. Kyoto, Japan). Height was also measured in the standing position and without shoes. Waist circumference (WC) was measured with a tape, with the subject standing and wearing only underwear, at the level midway between the lower rib margin and the iliac crest. Informed consent was obtained from all patients, and the study was approved by Ethic Committee of our institute.
Biochemical analysis
A total of 10 mL of blood sample was drawn from the antecubital vein of each subject by applying minimal tourniquet pressure; this was done in the early morning (all of the patients were requested to fast for at least 8 hours). The first 2 mL of blood samples was drawn into tubes with EDTA (ethylenediaminetet-raacetic acid) for the complete blood count (CBC), and the CBC was done on a CELL-DYN 3700 SL analyzer (Abbott Diagnostics, Chicago, USA). The remaining of 8 mL was drawn into a Vacutainer tube for measurement of high-sensitivity C-reactive protein (hs-CRP), fasting lipid profile, fasting insulin, and fasting blood glucose (FBG). These blood samples were allowed to clot for 20 min prior to centrifugation. The blood tubes were centrifuged for 10 min at 1500 g and were processed within 30 min in place. Plasma concentrations of cholesterol, fasting triglycerides (TGs), high-density lipoprotein-cholesterol (HDL-chol), glucose, electrolytes, liver function tests, and other biochemical variables were measured on a Cobas 6000 autoanalyzer using commercially available kits (Roche Diagnostics GmbH, Mannheim, Germany). Low-density lipoprotein-cholesterol (LDL-chol) values were computed according to the Friedewald formula.
Obesity and MetS definition
Individuals whose BMI was ≥30 and ≥25.0 kg/m2 were accepted as obese and overweight, according to WHO recommendations (19). MetS was defined as: individuals with MetS were identified when 3 out of the 5 criteria of the National Cholesterol Education Program Adult Treatment Panel III (NCEP ATP III) were met, modified for pre-diabetes (fasting glucose 100-125 mg/dL) (20). The severity of MetS was assigned into three subgroups with increasing severity according to the criteria met: 3 criteria, 4 criteria, and 5 criteria.
Statistical analysis
Statistical Package for Social Sciences software (SPSS 20, Chicago, IL, USA) was used for the analysis. Descriptive parameters were shown as mean ± standard deviation or in percentages. Normality of continuous variables was tested with Kolmogorov-Smirnov test. WBC, neutrophils, lymphocytes, NLR, hs-CRP BMI, WC, hip circumference, waist-height ratio, and waist-hip ratio were not normally distributed (p<0.001). Before analysis, logarithmic transformation was applied for variables that were normally not distributed. Analysis of variance (ANOVA) test was used for (Tukey’s) comparisons of inflammatory markers (WBC, NLR, neutrophils, lymphocytes, and hs-CRP) and anthropometric measurements (WC and BMI) between BMI groups (lean body, overweight, and obesity) and subgroups of MetS severity. Student t-test was used between groups of MetS status. Correlation analysis was performed to determine given values of variables using Pearson’s correlation analysis. Statistical significance was set to a p value of less than 0.05.
Results
The study included a total of 1267 subjects (male: 199 and female: 1068). Of all subjects, 21.7% was a current smoker. Based on BMI classifications, the majority of the subjects was in stage I obesity. Among overweight and obese subjects, they met 37.8% of MetS criteria. The distribution of subgroups of MetS severity according to the number of criteria met is given (Table 1). The mean age of all patients was 37.7±10.8 years (18-59). In Table 2, the mean values of anthropometric measurements (BMI and WC), systolic blood pressure (SBP) and diastolic blood pressure (DBP) records, lipid profiles (TG, HDL-chol), and fasting blood glucose (FBG) level and insulin resistance are given according to BMI group. Statistically significant differences between groups were observed for all parameters.
Table 1.
Basic features of subjects
| Number (1267) | (%) | |
|---|---|---|
| Smoking | ||
| Current | 275 | 21.7 |
| Former | 144 | 11.4 |
| Non-smoker | 848 | 69.9 |
| Gender | ||
| Male | 199 | 15.7 |
| Female | 1068 | 84.3 |
| BMI groups | ||
| Lean body | 167 | 13.1 |
| Overweight | 279 | 22.0 |
| Stage 1 Obesity | 369 | 29.1 |
| Stage 2 Obesity | 249 | 19.7 |
| Stage 3 Obesity | 303 | 16.0 |
| MetS (+) | 487 | 37.8 |
| MetS severity | ||
| 3 criteria | 282 | 57.9 |
| 4 criteria | 138 | 28.3 |
| 5 criteria | 67 | 13.8 |
BMI - body mass index; MetS - metabolic syndrome
Table 2.
Comparison of metabolic profile of subjects according to BMI stage group
| Metabolic parameters (n=1267) | BMI Groups | |||||
|---|---|---|---|---|---|---|
| Lean body (n=167) | Overweight (n=279) | Stage 1 (n=369) | Stage 2 (n=249) | Stage 3 (n=203) | P | |
| Age, years | 34.3±9.9 | 36.8±10.4 | 36.8±9.7 | 38.6±11.6 | 37.8±10.2 | 0.043 |
| BMI, kg/m2 | 22.9±2.6 | 28.1 ±1.2 | 32.3±1.4 | 37.4±1.5 | 44.9±4.2 | <0.001 |
| WC, cm | 78.3±7.7 | 90.1±7.9 | 99.4±6.9 | 106.8±12.1 | 119.1±11.2 | <0.001 |
| SBP mm Hg | 110.3±19.9 | 117.7±13.6 | 123.1±14.4 | 127.2±16.5 | 139.3±21.1 | <0.001 |
| DBP mm Hg | 71.2±6.5 | 76.7±10.6 | 80.4±11.6 | 82.3±12.4 | 88.6±12.4 | <0.001 |
| FBG, mg/dL | 90.4±6.4 | 94.1±10.8 | 95.5±8.2 | 98.4±9.1 | 105.1±5.6 | <0.001 |
| TG, mg/dL | 108.6±43.4 | 133.6±69.1 | 139.1 ±88.2 | 148.2±86.4 | 152.8±69.7 | <0.001 |
| HDL, mg/dL | 57.7±11.7 | 51.2±13.3 | 49.3±14.9 | 49.6±14.3 | 48.3±10.6 | <0.001 |
| HOMAIR | 1.51 ±0.69 | 2.86±2.39 | 3.42±2.29 | 3.91±3.01 | 5.29±4.30 | <0.001 |
The results are shown as mean±SD (standard deviation).
BMI - body mass index; DBP - diastolic blood pressure; FBG - fasting blood glucose; HDL - high-density lipoprotein; HOMO IR - homeostasis model assessment for insulin sensitivity; SBP - systolic blood pressure; TG - triglycerides; WC - waist circumference
One-way ANOVA analysis (Tukey’s) test was used. A P value represented statically significant value between groups according to body mass index classification. p<0.05 was accepted as statistically significant
We compared WBC, lymphocytes, neutrophils, NLR, and hs-CRP as inflammation markers between BMI groups. The mean value of WBC of subjects with a lean body was significantly different from that of the other groups: overweight and obesity stage 1, stage 2, and stage 3 (p=0.026, <0.001, <0.001, and <0.001, respectively). The mean value of NLR was lower in subjects with a lean body than in groups with higher BMI but was not statistically significant (p=0.168). Mean hs-CRP level was statistically different between groups and significantly increased with degree of obesity (p<0.001). Also, both lymphocyte count and neutrophil count were significantly increased among subjects with increased obesity degree (p<0.001 and p=0.028, respectively) (Table 3). Leukocyte, neutrophil, and lymphocyte counts and hs-CRP level showed a significant and positive correlation with BMI (r=0.198, p<0.001; r=0.163, p<0.001; r=0.167, p<0.001 and r=0.445, p<0.001), whereas NLR was not correlated with BMI (r=0.017, p=0.737) (Fig. 1). In Table 4, the correlation analysis between each one of the MetS criteria and inflammatory markers, such as leukocytes, NLR, and hs-CRP is stated. None of them was correlated with NLR (p>0.05). hs-CRP levels showed a meaningful relationship with each criterion (p<0.001). Leukocyte count had a significant correlation with all other criteria of MetS, except FBG (p=0.121). However, did not have a meaningful correlation with each criterion of MetS (p>0.05).
Table 3.
Comparison of proinflammatory indicators according to BMI stage group
| Inflammatory biomarkers (n=1267) | BMI Groups | |||||
|---|---|---|---|---|---|---|
| Lean body (n=167) | Overweight (n=279) | Stage 1 (n=369) | Stage 2 (n=249) | Stage 3 (n=203) | P | |
| WBC, ×103/μL | 7.02±0.96 | 7.25±1.72 | 7.52±2.08 | 7.71 ± 1.83 | 7.97±1.69 | <0.001 |
| LogWBC | 0.82±0.07 | 0.85±0.10 | 0.86±0.11 | 0.88±0.10 | 0.89±0.09 | |
| NC, ×103/μL | 3.73±1.01 | 4.17± 1.41 | 4.41±1.60 | 4.53±1.52 | 4.59±1.35 | 0.028 |
| Log NC | 0.54±0.11 | 0.60±0.15 | 0.62±0.14 | 0.64±0.13 | 0.64±0.13 | |
| LC, ×103/μL | 2.24±0.42 | 2.32±0.65 | 2.33±0.67 | 2.39±0.65 | 2.66±0.78 | <0.001 |
| LogLC | 0.33±0.08 | 0.35±0.13 | 0.35±0.14 | 0.36±0.12 | 0.40±0.12 | |
| NLR | 1.71±0.57 | 1.91±0.89 | 2.07±1.10 | 2.09±1.26 | 2.08±0.83 | 0.168 |
| Log NLR | 0.21±0.12 | 0.25±0.16 | 0.27±0.17 | 0.25±0.17 | 0.24±0.17 | |
| hs-CRP, mg/dL | 1.76± 1.67 | 3.03±1.34 | 3.99±1.12 | 4.87±2.61 | 6.52±2.27 | <0.001 |
| LogHs-CRP | 0.11±0.45 | 0.17±0.44 | 0.39±0.45 | 0.48±0.41 | 0.65±0.43 | |
The results are shown as mean±SD (standard deviation).
BMI - body mass index; hs-CRP - high-sensitivity C-reactive protein; LC - lymphocyte count; Log - logarithm; NC - neutrophil count; NLR - neutrophil-lymphocyte ratio; WBC - white blood cell
One-way ANOVA analysis (Tukey’s) test was used. P value represented statically significant value between groups according to body mass index classification. P<0.05 was accepted as statistically significant
Figure 1.
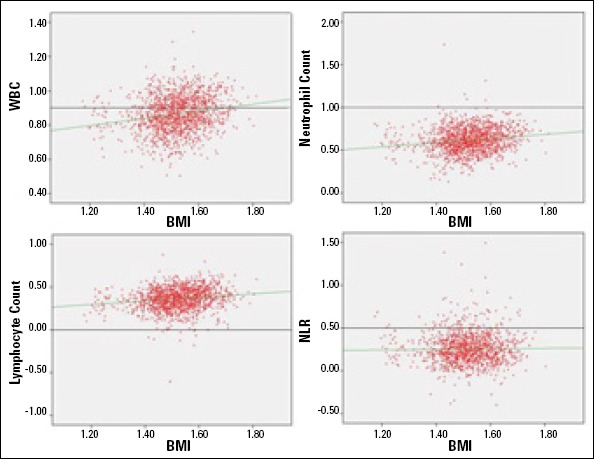
Correlation of WBC, WBC subtypes, and NLR with BMI
BMI - body mass index; NLR - neutrophil-lymphocyte ratio; WBC - white blood cell Correlation analysis
Pearson’s correlation analysis was used, and p <0.05 was accepted as statistically significant
Table 4.
Correlation of metabolic profile with leukocytes, NLR, and hs-CRP
| WBC | NLR | hs-CRP | ||||
|---|---|---|---|---|---|---|
| R | P | R | P | R | P | |
| WC, cm | 0.189 | <0.001 | 0.009 | 0.737 | 0.334 | <0.001 |
| HOMAIR | 0.235 | <0.001 | 0.002 | 0.938 | 0.264 | <0.001 |
| FBG, mg/dL | 0.044 | 0.121 | 0.004 | 0.901 | 0.143 | <0.001 |
| TG, mg/dL | 0.154 | <0.001 | 0.018 | 0.164 | 0.175 | <0.001 |
| HDL, mg/dL | -0.157 | <0.001 | -0.017 | 0.552 | -0.137 | <0.001 |
| SBP, mm Hg | 0.067 | 0.020 | 0.031 | 0.279 | 0.162 | <0.001 |
| DBP, mm Hg | 0.066 | 0.021 | 0.032 | 0.266 | 0.131 | <0.001 |
DBP - diastolic blood pressure; FBG - fasting blood glucose; HDL - high-density lipoprotein; HOMO IR - homeostasis model assessment for insulin sensitivity; hs-CRP - high-sensitivity C-reactive protein; NLR - neutrophil-lymphocyte ratio; SBP - systolic blood pressure; TG - triglycerides; WBC - white blood cell; WC - waist circumference Pearson’s correlation analysis was used, and P<0.05 was accepted as statistically significant
According to MetS status, pro-inflammatory markers were compared between MetS (+) and MetS (-). Level of hs-CRP (5.44±8.02 versus 3.7±5.3 mg/dL), leukocyte count (7.8±1.9 versus 7.2±1.7 ×10³/μL), lymphocyte count (2.5±0.7 versus 2.2±0.6 ×10³/μL), and neutrophil count (4.6±2.7 versus 4.1±1.4 ×10³/μL) were significantly higher among subjects with MetS than in those without MetS (p<0.001, <0.001, <0.001, and <0.001), but there was no significant difference for the comparison of NLR (2.0±1.8 versus 1.9±1.1) between MetS (+) and MetS (-) (p=0.519) (Fig. 2). It was observed that there was only a significant association between MetS severity 5 and 4 criteria with hs-CRP (p=0.028), whereas there was no statistically significant association for leukocyte count and NLR between clusters of MetS severity (p=0.246 and p=0.643, respectively) (Table 5).
Figure 2.
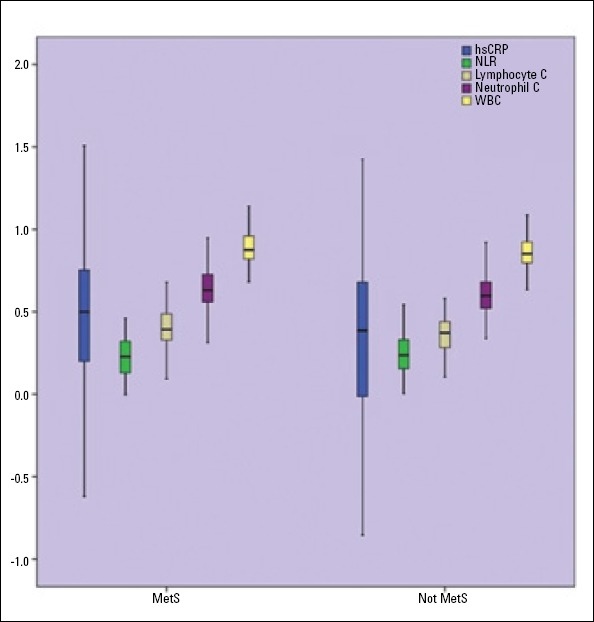
Comparison of hs-CRP, WBC, WBC subtypes, and NLR according to presence or absence of MetS
hs-CRP - high-sensitivity C-reactive protein; NLR - neutrophil-lymphocyte ratio; WBC - white blood cell
Table 5.
Comparison of total WBC, WBC subtypes, NLR, and hs-CRP according to MetS severity
| MetS severity subgroup0073 | ||||
|---|---|---|---|---|
| Inflammatory biomarkers | 3 criteria | 4 criteria | 5 criteria | P |
| WBC, ×103/μL Log WBC |
7.8±2.1 0.88±0.10 |
7.8±1.9 0.88±0.11 |
8.1±1.8 0.89±0.09 |
0.246 |
| hs-CRP, mg/dL Log hs-CRP |
4.5±4.3 0.47±0.42 |
5.4±7.5 0.51±0.44 |
9.1±16.12 0.66±0.46 |
0.034* |
| NC, ×103/μL Log NC |
4.7±3.5 0.62±0.16 |
4.5±1.4 0.64±0.13 |
4.5±1.3 0.64±0.12 |
0.633 |
| LC, ×103/μL Log LC |
2.5±0.7 0.37±0.12 |
2.5±0.8 0.38±0.13 |
2.6±0.7 0.40±0.11 |
0.231 |
| NLR Log NLR |
1.7±0.8 0.26±0.17 |
1.8±0.9 0.23±0.15 |
1.9±0.6 0.21±0.14 |
0.643 |
The results are shown as mean±SD (standard deviation).
Hs-CRP was significantly different between of 4 and 5 MetS criteria subgroups (P=0.028) but not between 3 and 4 and 5 and 4 criteria (P=0.856 and P=0.151, respectively).
Hs-CRP - high-sensitivity C-reactive protein; LC - lymphocyte count; Log - logarithm; MetS - metabolic syndrome; NC - neutrophil count; NLR - neutrophil-lymphocyte ratio; WBC - white blood cell
One-way ANOVA (Turkey’s) was used, and P<0.05 was accepted as statistically significant
Discussion
We studied the indicative value of NLR for the inflammatory state in patients with obesity and MetS, extent to obesity degree and MetS severity and compared them with hs-CRP and total WBC. The study indicated that NLR was not a simple and reliable indicator of inflammation and does not correlate with obesity degree and severity of MetS but that WBC and hs-CRP are good biomarkers for inflammation in obesity and MetS.
Several studies demonstrated a strong correlation between overweight/adiposity and CRP levels. Researchers observed a significant linear positive relation of CRP levels with BMI, SBP DBF; FBG, and TG and a decrease with HDL-chol and showed a significant increase in CRP levels with increase patients with obesity, MetS, hypertriglyceridemia, hypertension, and diabetes. Thus, a relationship between CRP value, which is an inflammation marker, and adipose tissue as the source of proinflammatory cytokines is established (21-24).
Obesity and MetS are clinical entities in which chronic subclinical inflammation develops. MetS is a cluster of atherogenic dyslipidemia, elevated blood pressure, hyperglycemia, and pro-thrombotic and inflammatory state. It consists of multiple and interrelated risk factors of metabolic deterioration, promoting the development of atherosclerosis. In current studies, inflammation was identified as an independent risk factor for CVD and strongly correlated with atherosclerosis (25, 26). Existing subclinical inflammation is progressively responsible for the development of diabetes mellitus and atherosclerotic disorders and is due to endothelial dysfunction. Endothelial dysfunction develops under proinflammatory cytokines, such as IL-6 and TNF-alpha, which are produced and secreted in substantial adipose tissue. Particularly, visceral adiposity is essential adipose tissue that produces these cytokines (27, 28).
Previous studies have shown that obesity degree and severity of MetS are associated with the inflammatory state and eventually with atherosclerotic progression. The prevention of this progression has prognostic, as well as diagnostic, importance (29, 30). In clinical practice, hs-CRP and leukocyte count are widely used to evaluate the degree of subclinical inflammation in patients with CAD and MetS. Also, in the Turkish population, MetS patients have significantly elevated neutrophil counts, along with a decrease in lymphocyte counts, when compared with age- and gender-matched nonMetS controls (31). Therefore, MetS patients had a higher NLR compared to the control group. Thus, they reported a significant correlation between the increases in the number of MetS criteria and increase in NLR. Furthermore, the levels of serum glucose and hs-CRP were increased when 1.84 was chosen as the cut-off value for the NLR in these Turkish MetS patients.
MetS is an inflammatory state and associated with an elevated leukocyte count. Tsai et al. (32) found that with more criteria of MetS present, the higher the total leukocytes and subtypes are. In the current study, the counts of total leukocytes and subtypes were increased with severity of MetS, but NLR was not increased with its severity. Similar to our findings, Shim et al.
(33) also showed that more components of MetS were associated with higher total leukocyte counts and differential leukocyte counts, and they were higher in patients with MetS features than in those without MetS features. Lohsoonthorn et al.
(34) found that WBC count is positively associated with MetS. Kelishadi et al. (35) studied the association of cell blood counts (CBCs) and cardiometabolic risk factors among young obese children and found a significant association between CBC components and obesity. Dsai et al. (36) reported that leukocyte count was associated with obesity, and it was highly dependent on the presence of MetS. In our study, we found a significant association between total leukocyte count with subtypes and obesity degree. However, we found no significant association between obesity degree and NLR. In the previous studies, both neutrophil and lymphocyte counts were increased, but these increases were in favor of neutrophils (37, 38). In the present study, neutrophils and lymphocytes were increased with obesity degree and severity of MetS by a similar quantity. Even NLR was increased with obesity degree and MetS severity, but these increases were not significant.
Study limitations
Our study had some weaknesses. In the study, the predictive value of NLR was evaluated, along with hs-CRP. As a weakness, our study did not differentiate female post-menopausal from pre-menopausal period cases. Smoking also has an inflammatory effect, and its effect was not evaluated in the study. The study was cross-sectional. It would be good to investigate the effect of weight loss on the inflammatory state.
Conclusion
In conclusion, the study indicated that subclinical and chronic inflammation develops in obese patients with and without MetS. NLR was not a good biomarker to show inflammation in non-diabetic patients with obesity and MetS. Leukocyte and hs-CRP were more useful biomarkers to indicate inflammation in the obesity with degree and MetS severity.
Footnotes
Conflict of interest: None declared.
Peer-review: Externally peer-reviewed.
Authorship contributions: Concept - A.B.; Design - Y.T., D.B.; Supervision - D.B., A.B.; Resource - M.H.D., Yasin.T.; Data collection &/or processing - M.H.D., Y.C.S.; Analysis &/or interpretation - D.I., S.Ö.; Literature search - M.H.D., S.Ö., Y.T.; Writing - A.B., D.B.; Critical review - D.I., S.Ö., Yasin.T.; Other - D.I., Y.C.S., Y.T.
References
- 1.Eckel RH, Grundy SM, Zimmet PZ. The metabolic syndrome. Lancet. 2005;365:1415–28. doi: 10.1016/S0140-6736(05)66378-7. [CrossRef] [DOI] [PubMed] [Google Scholar]
- 2.Cornier MA, Dabelea D, Hernandez TL, Lindstrom RC, Steig AJ, Stob NR, et al. The metabolic syndrome. Endocr Rev. 2008;29:777–822. doi: 10.1210/er.2008-0024. [CrossRef] [DOI] [PMC free article] [PubMed] [Google Scholar]
- 3.Pecht T, Gutman-Tirosh A, Bashan N, Rudich A. Peripheral blood leucocyte subclasses as potential biomarkers of adipose tissue inflammation and obesity subphenotypes in humans. Obes Rev. 2014;15:322–37. doi: 10.1111/obr.12133. [CrossRef] [DOI] [PubMed] [Google Scholar]
- 4.Elgazar-Carmon V, Rudich A, Hadad N, Levy R. Neutrophils transiently infiltrate intra-abdominal fat early in the course of high-fat feeding. J Lipid Res. 2008;49:1894–903. doi: 10.1194/jlr.M800132-JLR200. [CrossRef] [DOI] [PubMed] [Google Scholar]
- 5.Lolmede K, Duffaut C, Zakaroff-Girard A, Bouloumie A. Immune cells in adipose tissue: key players in metabolic disorders. Diabetes Metab. 2011;37:283–90. doi: 10.1016/j.diabet.2011.03.002. [CrossRef] [DOI] [PubMed] [Google Scholar]
- 6.Chatzigeorgiou A, Karalis KP, Bornstein SR, Chavakis T. Lymphocytes in obesity-related adipose tissue inflammation. Diabetologia. 2012;55:2583–92. doi: 10.1007/s00125-012-2607-0. [CrossRef] [DOI] [PubMed] [Google Scholar]
- 7.Divoux A, Tordjman J, Lacasa D, Veyrie N, Hugol D, Aissat A, et al. Fibrosis in human adipose tissue: composition, distribution, and link with lipid metabolism and fat mass loss. Diabetes. 2010;59:2817–25. doi: 10.2337/db10-0585. [CrossRef] [DOI] [PMC free article] [PubMed] [Google Scholar]
- 8.Catalan V, Gomez-Ambrosi J, Rodriguez A, Fruhbeck G. Role of extracellular matrix remodelling in adipose tissue pathophysiology: relevance in the development of obesity. Histol Histopathol. 2012;27:1515–28. doi: 10.14670/HH-27.1515. [DOI] [PubMed] [Google Scholar]
- 9.Vozarova B, Weyer C, Lindsay RS, Pratley RE, Bogardus C, Tataranni PA. High white blood cell count is associated with a worsening of insulin sensitivity and predicts the development of type 2 diabetes. Diabetes. 2002;51:455–61. doi: 10.2337/diabetes.51.2.455. [CrossRef] [DOI] [PubMed] [Google Scholar]
- 10.Twig G, Afek A, Shamiss A, Derazne E, Tzur D, Gordon B, et al. White blood cell count and the risk for coronary artery disease in young adults. PLoS ONE. 2012;7:e47183. doi: 10.1371/journal.pone.0047183. [CrossRef] [DOI] [PMC free article] [PubMed] [Google Scholar]
- 11.Babio N, Ibarrola-Jurado N, Bulló M, Martínez-González MÁ, Wärnberg J, Salaverría I, et al. White blood cell counts as risk markers of developing metabolic syndrome and its components in the PREDIMED study. PLoS ONE. 2013;8:e58354. doi: 10.1371/journal.pone.0058354. [CrossRef] [DOI] [PMC free article] [PubMed] [Google Scholar]
- 12.Herishanu Y, Rogowski O, Polliack A, Marilus R. Leukocytosis in obese individuals: possible link in patients with unexplained persistent neutrophilia. Eur J Haematol. 2006;76:516–20. doi: 10.1111/j.1600-0609.2006.00658.x. [CrossRef] [DOI] [PubMed] [Google Scholar]
- 13.Laurson KR, McCann DA, Senchina DS. Age, sex, and ethnicity may modify the influence of obesity on inflammation. J Investig Med. 2011;59:27–31. doi: 10.231/JIM.0b013e318200151a. [DOI] [PubMed] [Google Scholar]
- 14.Talukdar S, Oh da Y, Bandyopadhyay G, Li D, Xu J, McNelis J, et al. Neutrophils mediate insulin resistance in mice fed a high-fat diet through secreted elastase. Nat Med. 2012;18:1407–12. doi: 10.1038/nm.2885. [CrossRef] [DOI] [PMC free article] [PubMed] [Google Scholar]
- 15.Hadad N, Burgazliev O, Elgazar-Carmon V, Solomonov Y, Wueest S, Item F, et al. Induction of cytosolic phospholipase a2alpha is required for adipose neutrophil infiltration and hepatic insulin resistance early in the course of high-fat feeding. Diabetes. 2013;62:3053–63. doi: 10.2337/db12-1300. [CrossRef] [DOI] [PMC free article] [PubMed] [Google Scholar]
- 16.Huang ZS, Chien KL, Yang CY, Tsai KS, Wang CH. Peripheral differential leukocyte counts in humans vary with hyperlipidemia, smoking, and body mass index. Lipids. 2001;36:237–45. doi: 10.1007/s11745-001-0713-9. [CrossRef] [DOI] [PubMed] [Google Scholar]
- 17.Samocha-Bonet D, Chisholm DJ, Tonks K, Campbell LV, Greenfield JR. Insulin-sensitive obesity in humans-a ’favorable fat’pheno-type? Trends Endocrinol Metab. 2012;23:116–24. doi: 10.1016/j.tem.2011.12.005. [CrossRef] [DOI] [PubMed] [Google Scholar]
- 18.Dixon JB, O’Brien PE. Obesity and the white blood cell count: changes with sustained weight loss. Obes Surg. 2006;16:251–7. doi: 10.1381/096089206776116453. [CrossRef] [DOI] [PubMed] [Google Scholar]
- 19.International Obesity Task Force. Managing the Global Epidemic of Obesity. Report of the WHO Consultation on Obesity, Geneva 5-7 June. Geneva: WHO; 1997. [Google Scholar]
- 20.International Diabetes Federation. The IDF consensus worldwide definition of metabolic syndrome (article online) 2006. [Accessed December 15 2011]. http//www.idf.org.webdata/docs/IDF_Meta_def_final.pdf .
- 21.Twig G, Afek A, Shamiss A, Derazne E, Tzur D, Gordan B, et al. White blood cells count and incidence of type 2 diabetes in young men. Diabetes Care. 2013;36:276–82. doi: 10.2337/dc11-2298. [CrossRef] [DOI] [PMC free article] [PubMed] [Google Scholar]
- 22.Kim K, Valentine RJ, Shin Y, Gong K. Associations of visceral adiposity and exercise participation with C-reactive protein, insulin resistance, and endothelial dysfunction in Korean healthy adults. Metabolism. 2008;57:1181–9. doi: 10.1016/j.metabol.2008.04.009. [CrossRef] [DOI] [PubMed] [Google Scholar]
- 23.Moran LJ, Noakes M, Clifton PM, Wittert GA, Belobrajdic DP, Norman RJ. C-reactive protein before and after weight loss in overweight women with and without polycystic ovary syndrome. J Clin Endocrinol Metab. 2007;92:2944–51. doi: 10.1210/jc.2006-2336. [CrossRef] [DOI] [PubMed] [Google Scholar]
- 24.McDade TW, Rutherford JN, Adair L, Kuzawa C. Adiposity and pathogen exposure predict C-reactive protein in Filipino women. J Nutr. 2008;138:2442–7. doi: 10.3945/jn.108.092700. [CrossRef] [DOI] [PMC free article] [PubMed] [Google Scholar]
- 25.Klöting N, Fasshauer M, Dietrich A, Kovacs P, Schön MR, Kern M, et al. Insulin-sensitive obesity. Am J Physiol Endocrinol Metab. 2010;299:E506–15. doi: 10.1152/ajpendo.00586.2009. [CrossRef] [DOI] [PubMed] [Google Scholar]
- 26.Robinson LE, Graham TE. Metabolic syndrome, a cardiovascular disease risk factor: role of adipocytokines and impact of diet and physical activity. Can J Appl Physiol. 2004;29:808–29. doi: 10.1139/h04-053. [CrossRef] [DOI] [PubMed] [Google Scholar]
- 27.Casula M, Tragni E, Zambon A, Filippi A, Brignoli O, Cricelli C, et al. C-reactive protein distribution and correlation with traditional cardiovascular risk factors in the Italian population. Eur J Intern Med. 2013;24:161–6. doi: 10.1016/j.ejim.2012.09.010. [CrossRef] [DOI] [PubMed] [Google Scholar]
- 28.Brooks GC, Blaha MJ, Blumenthal RS. Relation of C-reactive protein to abdominal adiposity. Am J Cardiol. 2010;106:56–61. doi: 10.1016/j.amjcard.2010.02.017. [CrossRef] [DOI] [PubMed] [Google Scholar]
- 29.De Ferranti SD, Gauvreau K, Ludwig DS, Newburger JW, Rifai N. Inflammation and changes in metabolic syndrome abnormalities in US adolescents: findings from the 1988-1994 and 1999-2000 National Health and Nutrition Examination Surveys. Clin Chem. 2006;52:1325–30. doi: 10.1373/clinchem.2006.067181. [CrossRef] [DOI] [PubMed] [Google Scholar]
- 30.Ryu SY, Kim KS, Park J, Kang MG, Han MA. The association between circulating inflammatory markers and metabolic syndrome in Korean rural adults. J Prev Med Public Health. 2008;41:413–8. doi: 10.3961/jpmph.2008.41.6.413. [CrossRef] [DOI] [PubMed] [Google Scholar]
- 31.Büyükkaya E, Karakaş MF, Karakaş E, Akçay AB, Tanboğa IH, Kurt M, et al. Correlation of neutrophil to lymphocyte ratio with the presence and severity of metabolic syndrome. Clin Appl Thromb Hemost. 2014;20:159–63. doi: 10.1177/1076029612459675. [CrossRef] [DOI] [PubMed] [Google Scholar]
- 32.Tsai JC, Sheu SH, Chiu HC, Chung FM, Chang DM, Chen MP, et al. Association of peripheral total and differential leukocyte counts with metabolic syndrome and risk of ischemic cardiovascular diseases in patients with type 2 diabetes mellitus. Diabetes Metab Res Rev. 2007;23:111–8. doi: 10.1002/dmrr.647. [CrossRef] [DOI] [PubMed] [Google Scholar]
- 33.Shim WS, Kim HJ, Kang ES, Ahn CW, Lim SK, Lee HC, et al. The associations of total and differential white blood cell count with metabolic syndrome in type 2 diabetic patients. Diabetes Res Clin Pract. 2006;73:284–91. doi: 10.1016/j.diabres.2006.02.001. [CrossRef] [DOI] [PubMed] [Google Scholar]
- 34.Lohsoonthorn V, Dhanamun B, Williams MA. Prevalence of metabolic syndrome and its relationship to white blood cell count in a population of Thai men and women receiving routine health examinations. Am J Hypertens. 2006;19:339–45. doi: 10.1016/j.amjhyper.2005.10.008. [CrossRef] [DOI] [PubMed] [Google Scholar]
- 35.Kelishadi R, Hashemipour M, Ashtijou P, Mirmoghtadaee P, Poursafa P, Khavarian N, et al. Association of cell blood counts and cardiometabolic risk factors among young obese children. Saudi Med J. 2010;31:406–12. [PubMed] [Google Scholar]
- 36.Desai MY, Dalal D, Santos RD, Carvalho JA, Nasir K, Blumenthal RS. Association of body mass index, metabolic syndrome, and leukocyte count. Am J Cardiol. 2006;97:835–8. doi: 10.1016/j.amjcard.2005.10.021. [CrossRef] [DOI] [PubMed] [Google Scholar]
- 37.Brun JF, Aloulou I, Varlet-Marie E. Hemorheological aspects of the metabolic syndrome: markers of insulin resistance, obesity or hyperinsulinemia? Clin Hemorheol Microcirc. 2004;30:203–9. [PubMed] [Google Scholar]
- 38.Wang YY, Lin SY, Liu PH, Cheung BM, Lai WA. Association between hematological parameters and metabolic syndrome components in a Chinese population. J Diabetes Complications. 2004;18:322–7. doi: 10.1016/S1056-8727(04)00003-0. [CrossRef] [DOI] [PubMed] [Google Scholar]