Abstract
Purpose
To estimate the prevalence of refractive errors in adult Chinese Americans, and evaluate factors associated with myopia and high myopia.
Design
A population-based, cross-sectional study.
Methods
Chinese Americans 50 years and older residing in Monterey Park, California, were recruited. Noncycloplegic automated refraction with supplemental subjective refraction was performed. Myopia, high myopia, hyperopia, and high hyperopia were defined as a spherical equivalent of < −0.5 diopter (D), < −5.0D, > +0.5D, and ≥ +3.0D, respectively. Astigmatism and high astigmatism were defined as a cylinder of > 0.5D and > 2.25D, respectively. Risk factor assessment was guided by a conceptual model.
Results
Data from 4144 participants were analyzed. The overall prevalence of myopia, high myopia, hyperopia, high hyperopia, astigmatism, and high astigmatism was 35.1% (95% confidence interval, 33.6%–36.6%), 7.4% (6.6%–8.3%), 40.2% (38.7%–41.8%), 2.7% (2.2%–3.3%), 45.6% (44.1%–47.2%), and 3.7% (3.1%–4.3%), respectively. The prevalence of myopia and high myopia was lower among older individuals (Ps < 0.05). Reversed age trends were observed for the other refractive errors (Ps < 0.05). There was no sex difference in the prevalence of refractive errors, except for a higher prevalence of hyperopia among females (P = 0.010). Age, acculturation, education, income, marital status, birth country, history of ocular disease, non-ocular comorbidities, and recent eye exam were associated with prevalence of myopia. All of these factors, except for acculturation, were also associated with high myopia.
Conclusions
Our data present the first population-based estimates of the prevalence of refractive errors among adult Chinese Americans. Compared with whites, Hispanics, and blacks, Chinese Americans have a higher burden of myopia, high myopia, and astigmatism.
INTRODUCTION
Refractive error is a common vision problem affecting half of American adults.1 In the United States (US), the costs for detection and treatment of refractive error—including glasses, contact lenses, or refractive eye surgery for vision correction—exceed $3.9 billion annually.2 Furthermore, without adequate intervention, refractive error can be a major cause of visual impairment and blindness.3–5 Globally, 153 million people are estimated to be visually impaired and 8 million are estimated to be blind from uncorrected refractive error.6 One type of refractive error, high myopia, can lead to blinding pathological complications, such as retinal detachment, degenerative maculopathy, and glaucoma,7–10 and some studies suggest that even mild and moderate levels of myopia can be associated with higher risk of these complications.11, 12
Striking racial/ethnic differences have been observed in the prevalence of refractive error.13–16 Individuals of Chinese ancestry were found to have one of the highest prevalences of myopia and astigmatism. This means that adult Chinese Americans are potentially a high-risk population for myopia, high myopia, and astigmatism. Despite our awareness of this fact, there is a lack of population-based data characterizing the prevalence of refractive errors among adult Chinese Americans. Some reports of the prevalence of refractive errors in Chinese Americans were provided by the Multi-Ethnic Study of Atherosclerosis (MESA).13 However, the MESA sample was restricted to adults without known cardiovascular disease, and therefore, its estimates may not be generalizable to Chinese Americans as a whole. In addition, its small sample size (N = 487) does not allow accurate estimates of age- and/or sex-specific prevalence of refractive errors, particularly high myopia and high hyperopia. Results from studies of Chinese living in Asia17–21 may not be generalizable to Chinese living elsewhere, because differences in lifestyle and environmental factors may contribute to changes in refraction at older ages.22 It is also unclear if Asians that emigrate to the US are representative of those living in Asia. It has been reported that compared with the population of their country of origin, recent Asian immigrants to the US have a higher level of educational attainment,23 a factor strongly associated with myopia.
With the rapid growth of the Asian population in the US (from 10.2 million in 2000 to 14.7 million 2010)24 and the worldwide rise in the prevalence of myopia in the past few decades,15, 25, 26 it is important to evaluate the current prevalence of refractive errors among Chinese Americans, who comprise the majority of Asian Americans. To our knowledge, the Chinese American Eye Study (CHES) is the largest, most comprehensive population-based ophthalmologic study of persons 50 years and older of Chinese ancestry living in the US, with standardized clinical measurements that allow for comparisons of refractive error prevalence across studies. In this report, we aim to evaluate the presence and severity of different types of refractive errors in Chinese Americans, to compare these estimates with those from studies of Chinese in Asia and of other racial/ethnic groups in the US, and to identify demographic, lifestyle, anthropometric, clinical, and health care access/utilization factors associated with myopia and high myopia. Variations in ocular biometry, such as axial lengths and their relationships to refractive differences, will be reported in detail in a separate manuscript.
METHODS
Study Cohort
Details of the study design and baseline data have been reported.27 In brief, the study population consists of self-identified Chinese Americans, 50 years and older, residing in 10 census tracts of the City of Monterey Park, California, from 2010 to 2013. A door-to-door census was completed, covering all dwelling units within the 10 targeted census tracts. Informed consent was obtained. A detailed in-home interview was conducted to determine demographic factors (e.g., age, sex, country of birth), level of acculturation, ocular and systemic medical histories, various risk factors, and access to medical and ocular care. Level of acculturation was determined based on the Suinn-Lew Asian Self-Identity Acculturation Scale (SL-ASIA).14, 15 All eligible participants were invited to the Local Eye Examination Center (LEEC) for a comprehensive ocular examination, including visual acuity and examination with LOCS II lens opacity grading. Institutional review board/ethics committee approval was obtained from the University of Southern California Health Sciences Institutional Review Board. All study procedures adhered to the principles outlined in the Declaration of Helsinki for research involving human subjects.
Refractive Error Measurements
If presenting visual acuity was 20/20 or better (≥ 55 letters) in each eye according to the Standard Early Treatment Diabetic Retinopathy Study protocol at 4 m, refraction was the presenting spectacle correction or plano. Otherwise, a noncycloplegic autorefraction (Humphrey Autorefractor; Carl Zeiss Meditec, Dublin, CA) was performed. For participants with visual acuity less than 20/20, refraction was further refined by subjective refraction, using standard protocols. During the phoropter refining process, autorefraction readings were used as the starting point, and then sphere choices in the plus direction were offered first to avoid over-minusing. If additional minus was preferred, a 0.5D increment was added each time and stopped at the least minus power at which the patient did not experience any improvement in visual acuity. When best-corrected visual acuity was achieved, the derived refraction was recorded as the final refraction. If different autorefraction and subjective refraction yielded identical visual acuity, subjective refraction was recorded as the final refraction. Cylindrical refractive error was measured and recorded in the positive form.
Definition of Outcome Variables
To enable comparison with refractive errors defined in studies of Chinese in Asia, presence of any myopia (< −0.5D), high myopia (< −5.0D), any hyperopia (> +0.5D), and high hyperopia (≥ +3.0D) was based on the spherical equivalent refractive error of the right eye (for phakic right eye). Spherical equivalent was calculated as the sum of the spherical diopter value and half of the cylinder diopter value. To enable comparisons with studies of other racial/ethnic groups in the US, we also estimated prevalence of myopia (defined as ≤ −1.0D), high myopia (≤ −5.0D), and high hyperopia (≥ +3.0D) for the worse eye (defined as the phakic eye with larger absolute refractive error). Presence of any astigmatism was defined as a cylinder power of greater than 0.50D without reference to the axis. This definition allows direct comparison of our estimates with those from other studies.20, 28, 29 We also defined high astigmatism as a cylinder power of greater than 2.25D without reference to the axis. Astigmatism was further defined as with-the-rule (WTR) (+ cylinder axis 90° ± 15°) and against-the-rule (ATR) (+ cylinder axis 180° ± 15°); all other orientations were considered oblique (OBL).
Risk Factor Assessment
Candidate demographic, lifestyle, anthropometric and clinical, and health care access and utilization factors were obtained from interview and clinical examination. Demographic factors included age (by decade), gender, birth country, years residing in the US, level of acculturation (SL-ASIA score < the median −1.8, ≥ 1.8), level of education, annual household income, marital status, and employment status. Lifestyle factors were history of cigarette smoking and alcohol drinking. Anthropometric and clinical factors included height and body mass index, diabetes mellitus, hypertension, self-reported history of ocular disease (cataract, glaucoma, macular degeneration, or diabetic eye disease), and non-ocular comorbid conditions (arthritis, stroke or brain hemorrhage, angina, heart attack, heart failure, asthma, skin cancer, other cancers, back problems, and deafness or hearing problems). Health care access/utilization factors consisted of time since last complete eye exam, time since last health examination, and possession of health and vision insurance.
Statistical Analysis
Statistical analyses were conducted using SAS 9.2 (SAS Institute Inc., Cary, NC). All reported P values were two-sided. When comparing prevalence across studies, in order to reduce potential confounding due to different age and sex structures in each study, we obtained age- and sex-specific prevalence reported by each study, and calculated age- and sex-adjusted prevalence by direct standardization of the study samples to the Asian population in the 2010 US Census.24 Mantel-Haenszel Chi-square tests were conducted to evaluate differences by age groups. Logistic regression was used to test for age-adjusted sex differences.
The risk factor assessment was guided by a conceptual model, which includes 4 categories of potential risk factors: demographic, lifestyle, anthropometric/clinical, and health care access/utilization factors, as listed above. Potential risk factors were first explored by multivariate analyses of all factors within the same category. If a variable achieved a P value of < 0.10 in the multivariate analyses of all factors within its category, the variable was then selected for inclusion in the combined multivariable model. Variables from each of the 4 categories were evaluated in the final analysis using a threshold of P < 0.05. Odds ratios (ORs) and 95% confidence intervals (CIs) were estimated using logistic regression. Given the known contribution of nuclear opacification (NO) to myopic refraction among older participants, variables in the final model were further evaluated in analyses stratified by the presence of NO.
RESULTS
Study Cohort
Of the 5782 eligible participants, 4582 (79.2%) completed both a home interview and a clinical examination at the LEEC. The majority of the participants was first generation immigrants from mainland China (69.4% in total with 26.0% from Guangdong Province, 8.6% from Hong Kong, 7.0% from Shanghai, 4.5% from Liaoning Province, 2.7% from Fujian Province, 2.4% from Tianjin, and 2.1% from Beijing) and Taiwan (13.4%). Most (75%) had lived in the US for more than 10 years and (98%) lived in the US year round. Compared to the Chinese population 50 years and older living in the US,30 CHES participants were similar in age (47% of CHES participants vs. 44% of US Chinese were 50–59 years old), more likely to be female (63% of CHES vs. 52% of US Chinese), and slightly less likely to have more than 12 years of education (67% of CHES participants vs. 77% of US Chinese). Among the 4582 participants, 303 had previous cataract surgery in both eyes, 41 had missing lens status, 3 did not have refraction data for both eyes, and 91 reported having previous refractive surgery; these participants were excluded from the subsequent analyses. The remaining 4144 (90.4%) participants were our analysis cohort.
Prevalence of Refractive Errors in CHES
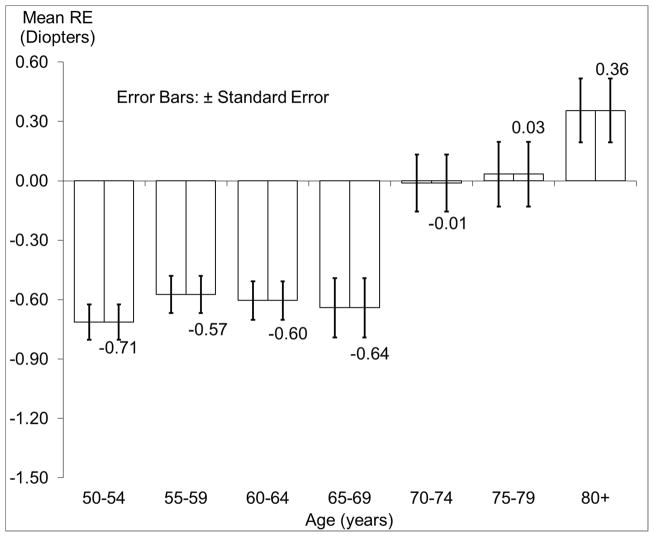
Figure 1 shows the distribution of mean spherical equivalent refraction by age. Spherical equivalent refractive error was more negative among younger groups, especially those younger than 70 years. Table 1 presents the prevalence of refractive errors in the right eye by age and/or sex.
Figure 1.
Distribution of Mean Spherical Equivalent Refractive Error (±Standard Error) in the Right Eye by Age in the Chinese American Eye Study (CHES).
Abbreviations: CHES = Chinese American Eye Study; RE = refractive error; SE = spherical equivalent
Table 1.
Age-specific Prevalence of Refractive Error in the Right Eye by Sex in CHES
| Myopia (< −0.5D)
|
High Myopia (< −5.0D)
|
Hyperopia (> +0.5D)
|
High Hyperopia (≥ +3.0D)
|
Astigmatism (> +0.5D)
|
High Astigmatism (> +2.25D)
|
|||||||
|---|---|---|---|---|---|---|---|---|---|---|---|---|
| na | % (95% CI) | na | % (95% CI) | na | % (95% CI) | na | % (95% CI) | na | % (95% CI) | na | % (95% CI) | |
| Total | 1425 | 35.1 (33.6, 36.6) | 302 | 7.4 (6.6, 8.3) | 1638 | 40.2 (38.7, 41.8) | 110 | 2.7 (2.2, 3.3) | 1854 | 45.6 (44.1, 47.2) | 149 | 3.7 (3.1, 4.3) |
| 50–59 yrs | 751 | 36.1 (34.1, 38.2) | 154 | 7.4 (6.3, 8.6) | 766 | 36.8 (34.8, 39.0) | 32 | 1.5 (1.1, 2.2) | 705 | 33.9 (31.9, 36.0) | 41 | 2.0 (1.4, 2.7) |
| 60–69 yrs | 524 | 36.6 (34.1, 39.1) | 132 | 9.2 (7.8, 10.8) | 603 | 42.1 (39.5, 44.7) | 42 | 2.9 (2.1, 3.9) | 744 | 51.9 (49.3, 54.5) | 53 | 3.7 (2.8, 4.8) |
| 70–79 yrs | 120 | 28.8 (24.5, 33.4) | 14 | 3.4 (1.8, 5.6) | 199 | 47.7 (42.8, 52.6) | 24 | 5.8 (3.7, 8.4) | 296 | 71.0 (66.4, 75.3) | 33 | 7.9 (5.5, 10.9) |
| 80+ yrs | 30 | 22.2 (15.5, 30.2) | 2 | 1.5 (0.2, 5.2) | 70 | 51.9 (43.1, 60.5) | 12 | 8.9 (4.7, 15.0) | 109 | 80.7 (73.1, 87.0) | 22 | 16.3 (10.5, 23.6) |
| P for trend by age | < 0.001 | 0.014 | < 0.001 | < 0.001 | < 0.001 | < 0.001 | ||||||
| Males | ||||||||||||
| Total | 531 | 35.5 (33.1, 38.0) | 108 | 7.2 (6.0, 8.7) | 573 | 38.3 (35.9, 40.9) | 38 | 2.5 (1.8, 3.5) | 722 | 48.3 (45.8, 50.9) | 64 | 4.3 (3.3, 5.4) |
| 50–59 yrs | 245 | 36.2 (32.6, 40.0) | 47 | 7.0 (5.2, 9.1) | 230 | 34.0 (30.5, 37.7) | 10 | 1.5 (0.7, 2.7) | 239 | 35.4 (31.7, 39.1) | 18 | 2.6 (1.6, 4.2) |
| 60–69 yrs | 214 | 38.9 (34.8, 43.1) | 55 | 10.0 (7.6, 12.8) | 210 | 38.2 (34.1, 42.4) | 11 | 2.0 (1.0, 3.6) | 287 | 52.2 (47.9, 56.4) | 23 | 4.2 (2.7, 6.2) |
| 70–79 yrs | 52 | 26.8 (20.7, 33.6) | 4 | 2.1 (0.6, 5.2) | 97 | 50.0 (42.8, 57.2) | 9 | 4.6 (2.1, 8.6) | 140 | 72.2 (65.3, 78.3) | 13 | 6.7 (3.6, 11.2) |
| 80+ yrs | 20 | 27.0 (17.4, 38.6) | 2 | 2.7 (0.3, 9.4) | 36 | 48.6 (36.9, 60.6) | 8 | 10.8 (4.8, 20.2) | 56 | 75.7 (64.3, 84.9) | 10 | 13.5 (6.7, 23.5) |
| P for trend by age | 0.030 | 0.083 | < 0.001 | < 0.001 | < 0.001 | < 0.001 | ||||||
| Females | ||||||||||||
| Total | 894 | 34.8 (32.9, 36.7) | 194 | 7.5 (6.6, 8.6) | 1065 | 41.4 (39.5, 43.4) | 72 | 2.8 (2.2, 3.5) | 1132 | 44.0 (42.1, 46.0) | 85 | 3.3 (2.7, 4.1) |
| 50–59 yrs | 506 | 36.1 (33.5, 38.6) | 107 | 7.6 (6.3, 9.1) | 536 | 38.2 (35.7, 40.8) | 22 | 1.6 (1.0, 2.4) | 466 | 33.2 (30.8, 35.7) | 23 | 1.6 (1.0, 2.4) |
| 60–69 yrs | 310 | 35.1 (32.0, 38.4) | 77 | 8.7 (6.9, 10.8) | 393 | 44.5 (41.2, 47.9) | 31 | 3.5 (2.4, 4.9) | 457 | 51.8 (48.4, 55.1) | 30 | 3.4 (2.3, 4.8) |
| 70–79 yrs | 68 | 30.5 (24.5, 37.0) | 10 | 4.5 (2.2, 8.1) | 102 | 45.7 (39.1, 52.5) | 15 | 6.7 (3.8, 10.9) | 156 | 70.0 (63.5, 75.9) | 20 | 9.0 (5.6, 13.5) |
| 80+ yrs | 10 | 16.4 (8.2, 28.1) | 0 | 0.0 (0.0, 5.9) | 34 | 55.7 (42.4, 68.5) | 4 | 6.6 (1.8, 15.9) | 53 | 86.9 (75.8, 94.2) | 12 | 19.7 (10.6, 31.8) |
| P for trend by age | 0.006 | 0.087 | < 0.001 | < 0.001 | < 0.001 | < 0.001 | ||||||
| P for sex difference b | 0.36 | 0.97 | 0.010 | 0.21 | 0.50 | 0.61 | ||||||
Abbreviation: CHES = Chinese American Eye Study, CI=confidence interval; D=Diopters
Number of participants with each type of refractive error, out of 4,064 participants with refraction data of the right eye
Test for sex differences in the prevalence of refractive errors with adjustment for age
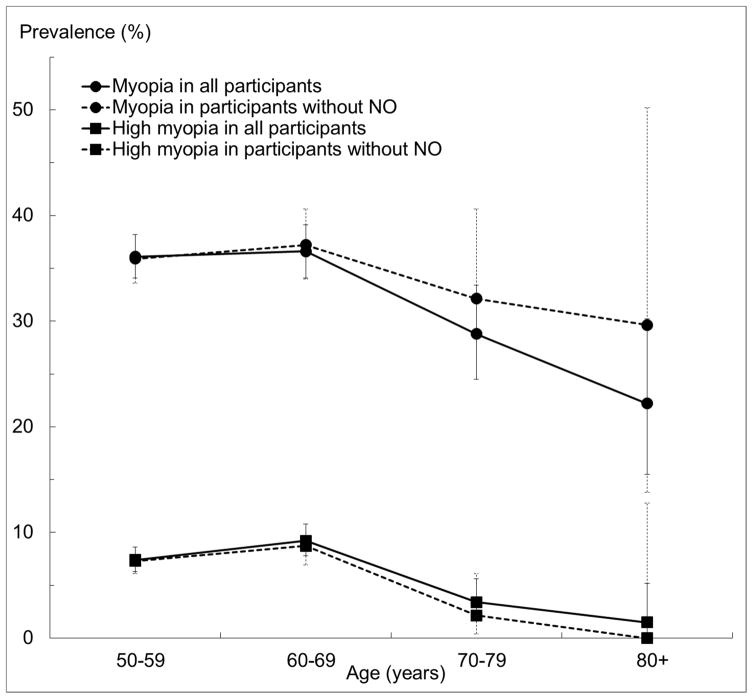
The overall prevalence of myopia and high myopia in the right eye was 35.1% (95% CI, 33.6%–36.6%) and 7.4% (6.6%–8.3%), respectively. The prevalence of myopia was lower among individuals older than 70 (P trend < 0.001). A similar trend by age group was observed for high myopia (P = 0.014). There was no sex difference in the prevalence of myopia or high myopia (P = 0.36 and 0.97, respectively). If subjects with any NO were excluded (Figure 2), the prevalence of myopia remained mostly unchanged, with significant overlap in confidence intervals. The prevalence of high myopia was reduced slightly for all age groups after exclusion of NO. There was no sex difference in the prevalence of myopia or high myopia (P = 0.36 and 0.97, respectively).
Figure 2.
Age-specific Prevalence of Myopia (< −0.5D) and High Myopia (< −5.0D) and 95% Confidence Intervals in the Right Eye Among All Participants and Participants without Any Nuclear Opacification in the Chinese American Eye Study (CHES).
Abbreviations: CHES = Chinese American Eye Study; NO = nuclear opacification
The overall prevalence of hyperopia and high hyperopia in CHES was 40.2% (95% CI: 38.7%–41.8%) and 2.7% (2.2%–3.3%), respectively. There was an almost linear age trend, with the prevalence of both hyperopia and high hyperopia become consistently higher in older age groups (Ps < 0.001). Hyperopia was more common among females than males (41.4% vs. 38.3%), a sex difference that remained after controlling for age (P = 0.010). Similarly, high hyperopia was more prevalent in women than men, although there was no sex difference after adjusting for age (P = 0.21). The overall prevalence of astigmatism (> 0.5D) and high astigmatism (> 2.25D) in CHES was 45.6% (95% CI: 44.1%–47.2%) and 3.7% (3.1%–4.3%), respectively. Prevalence of both astigmatism and high astigmatism were higher among older groups (P < 0.001). Similar trends were observed for both sexes. Both astigmatism and high astigmatism seemed less prevalent among women than men, but there were no sex differences after adjusting for age (Ps = 0.50 and 0.61). Overall, the prevalence of WTR, ATR, and oblique astigmatism were 3.8%, 16.8%, and 25.0%, respectively (Table 2). The axis of astigmatism varied by age (Ps < 0.05), with older participants having a higher prevalence of ATR or oblique astigmatism and a lower prevalence of WTR than younger participants. Among participants with astigmatism, 44.7% had myopia, and 33.2% had hyperopia, representing a prevalence of 20.4% for myopic astigmatism and 15.1% for hyperopic astigmatism.
Table 2.
Prevalence of Subtypes of Astigmatism (> +0.5D) in the Right Eye by Age in CHES
| Subtypes of astigmatism (> +0.5D)
|
|||
|---|---|---|---|
| WTR | ATR | Oblique | |
| Total | 3.8% | 16.8% | 25.0% |
| 50–59 | 4.3% | 10.6% | 18.9% |
| 60–69 | 3.6% | 21.0% | 27.4% |
| 70–79 | 2.6% | 27.3% | 41.0% |
| 80+ | 1.5% | 36.3% | 43.0% |
| P age trend a | 0.018 | < 0.001 | < 0.001 |
Abbreviations: ATR = against-the-rule; CHES = Chinese American Eye Study; WTR = with-the-rule; D=Diopters
P values were adjusted for sex.
Comparison with Other Studies of Chinese and of Other Racial/Ethnic Groups in the US
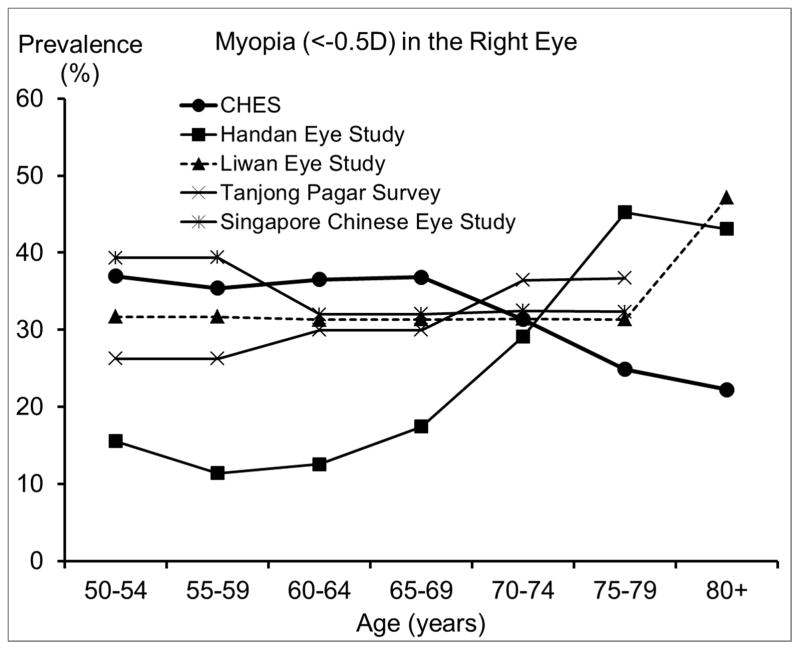
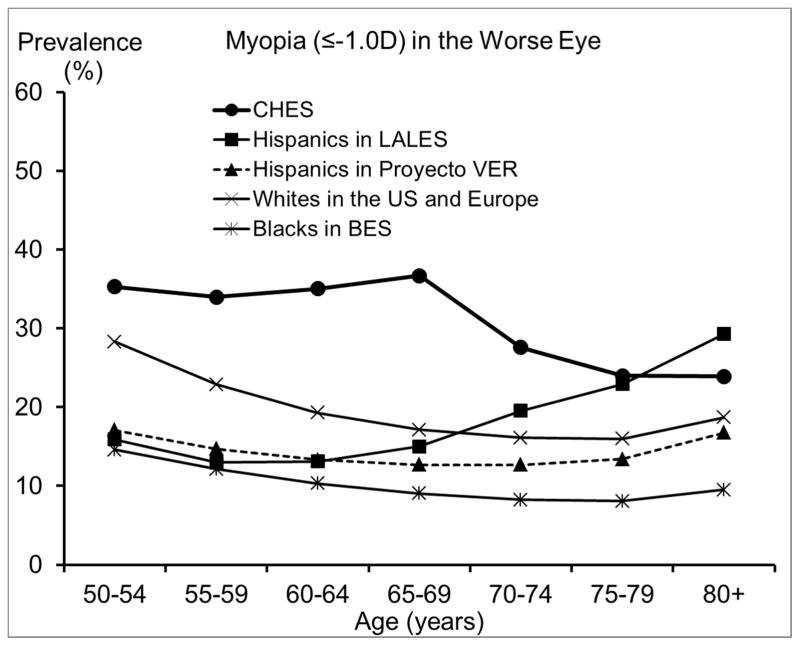
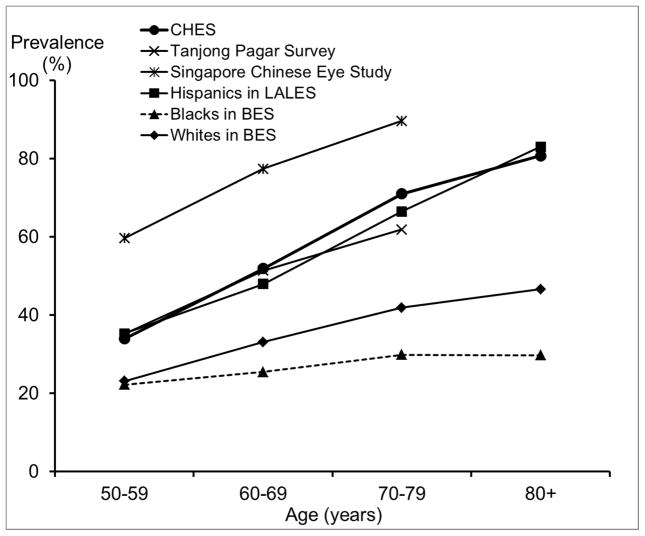
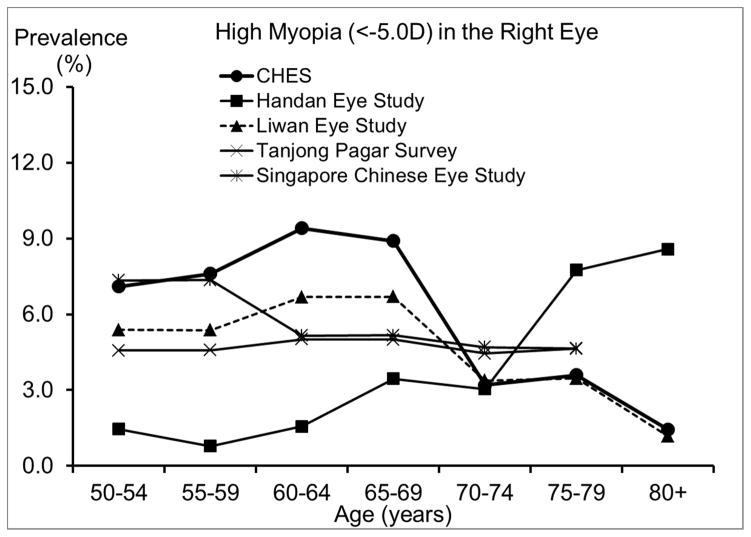
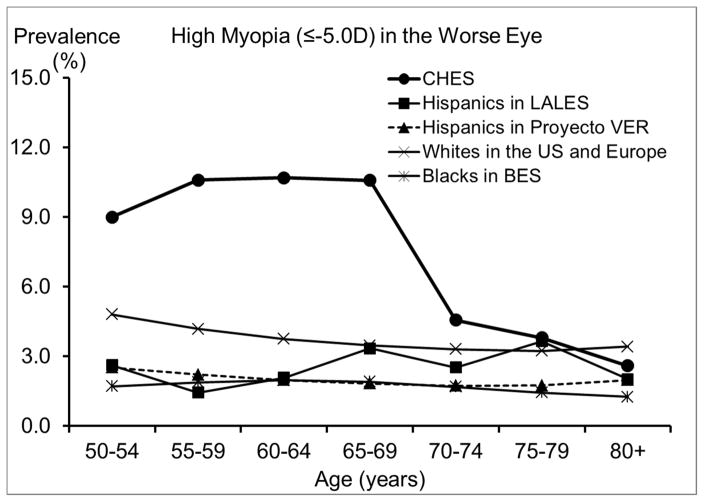
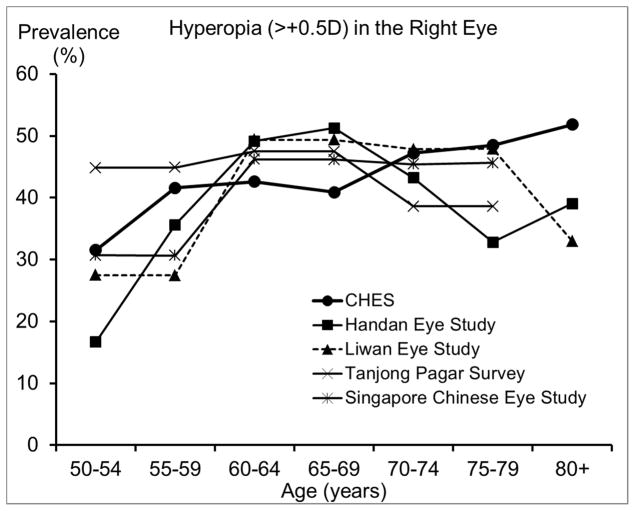
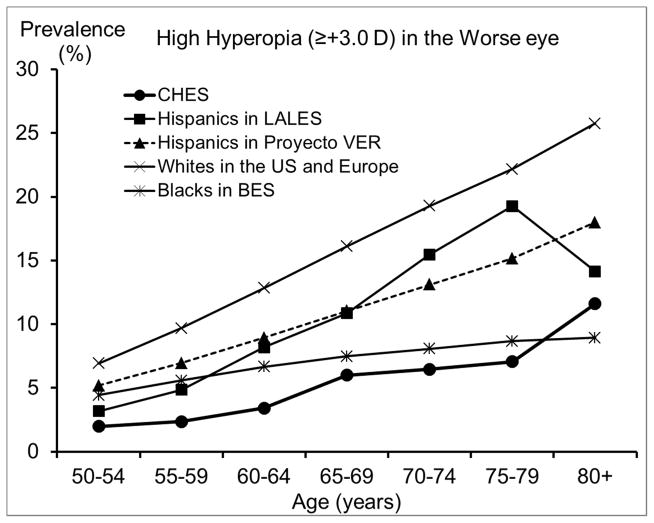
We also compared our estimated prevalence of refractive errors among Chinese Americans in CHES with those reported by other population-based studies of Chinese in Asia and of other racial/ethnic groups in the US. To ensure compatibility in measurement methods and definitions across studies and to control for potential confounding from age, studies that did not perform subjective refraction or did not report proper age-specific prevalence were excluded. Age- and sex-standardized overall prevalence across all reported prevalences is presented in Table 3. We presented a range of the most commonly used definitions to facilitate comparison across studies. While estimates from most other studies of Chinese18–20, 28 and from some earlier US studies29, 31 were based on the refraction of the right eye, recent US studies1, 13, 14, 32 were mostly based on the refraction of the worse eye. Figures 3–6 are the plotted comparisons of age-specific prevalences of myopia, high myopia, hyperopia, high hyperopia, and astigmatism. In these figures, studies of Chinese were compared based on the refraction of the right eye, and studies of US populations were compared based on the refraction of the worse eye. Details of these comparisons are presented in the Discussion.
Table 3.
Comparison of Age- and Sex-standardizeda Prevalence of Refractive Error in CHES with Other Population-based Studies
| Study | Study Site and Period | Myopia, %
|
High Myopia, %
|
Hyperopia (> +0.5D) in the right eye, % | High hyperopia (≥ +3.0 D) in the worse eye, % | Astigmatism (>0.5D cyl.) in the right eye, % | ||
|---|---|---|---|---|---|---|---|---|
| < −0.5D in the right eye | ≤ − 1.0D in the worse eye | < −5.0 D in the right eye | ≤ −5.0 D in the worse eye | |||||
| CHES | Urban US, 2009–13 | 34.1 | 32.8 | 6.8 | 8.6 | 40.6 | 4.3 | 49.0 |
| Other studies of Chinese | ||||||||
| Handan Eye Study | Rural China, 2006–7 | 19.6 | - | 2.7 | - | 35.9 | - | - |
| Liwan Eye Study | Urban China, 2003–4 | 32.7 | - | 5.1 | - | 37.6 | - | - |
| Tanjong Pagar Survey b | Urban Singapore, 1997–8 | 29.8 | - | 4.7 | - | 44.2 | - | 46.3 |
| Singapore Chinese Eye Study b | Urban Singapore, 2009–11 | 35.5 | - | 6.1 | - | 38.8 | - | 71.9 |
| Other racial/ethnic groups | ||||||||
| Hispanics in LALES | Urban US, 2000–3 | 17.6 | 16.7 | - | 2.4 | 43.3 | 7.7 | 47.8 |
| Hispanics in Proyecto VER | Urban US, 1997–9 | - | 14.7 | - | 2.1 | - | 9.3 | - |
| Blacks in BES | Urban US, 1985–8 | 18.0 | 11.2 | - | 1.8 | 45.1 | 6.4 | 24.9 |
| Whites in BES | Urban US, 1985–8 | 21.0 | - | - | - | 52.0 | - | 30.8 |
| Whites in BDES c | Urban US, 1988–90 | 25.9 | - | - | - | 49.4 | - | - |
| Whites in the US and Europe d | 1985–96 | - | 21.5 | - | 4.0 | - | 13.3 | - |
Abbreviations: BES = Baltimore Eye Study; BDES = Beaver Dam Eye Study; CHES = Chinese American Eye Study; LALES = Los Angeles Latino Eye Study; Proyecto VER = Proyecto Vision Evaluation and Research Study; US = United States; D=diopters
The Asian population in the 2010 United States Census was used as the standard population
The oldest participant in the Tanjong Pagar Survey was 81 years old, and the oldest in the Singapore Chinese Eye Study was 80 years old. The prevalence rate for 70–79 years old was estimated based on rates reported for all 70+ years old. To calculate the age-standardized overall rate, the prevalence rate for 80+ years was assumed to be the same as the rate for 75–79 years
Rates for 50–54 years old were estimated for those for 43–54 years old in the BDES
From the Eye Disease Prevalence Research Group, which included whites from the BES, BDES, the Rotterdam Study, the Blue Mountains Eye Study, and the Melbourne Visual Impairment Project
Figure 3.
Comparison of the Prevalence of Myopia in the Chinese American Eye Study (CHES) with Estimates from (top) Other Studies of Chinese and (bottom) Studies of Other Racial/ethnic Groups.
Abbreviations: BES = Baltimore Eye Survey; CHES = Chinese American Eye Study; LALES = Los Angeles Latino Eye Study; Proyecto VER = Proyecto Vision Evaluation and Research Study; US = United States
Figure 6.
Comparison of the Prevalence of Astigmatism (> 0.5D) In the Right Eye in the Chinese American Eye Study (CHES) with Estimates from Other Studies.
Abbreviations: BES = Baltimore Eye Survey; CHES = Chinese American Eye Study; LALES = Los Angeles Latino Eye Study
Risk Factors for Myopia and High Myopia
Table 4 presents the multivariate associations after a conceptual model-based model selection. Younger age, higher level of acculturation, more education, higher household income, never being married, birth in the US, history of ocular disease, lack of other non-ocular comorbidities, and recent eye examination were all associated with a higher prevalence of myopia. Further analyses revealed that the association between history of non-ocular comorbidities and myopia was driven mainly by an inverse association between history of arthritis and myopia. In addition, history of ocular disease was not associated with myopia if participants with NO were excluded. Factors associated with high myopia were similar to those associated with myopia, although there was no association between high myopia and level of acculturation.
Table 4.
Multivariate Analysis of Factors Associated with Myopia (< −0.5D) and High Myopia (−5.0D) in the Right Eye in CHES
| Risk Factors | Myopia
|
High Myopia
|
||
|---|---|---|---|---|
| No/yes | OR (95%CI) | No/yes | OR (95%CI) | |
| Age (y) | ||||
| 50–59 | 1328/751 | 1.00 | 1925/154 | 1.00 |
| 60–69 | 909/524 | 0.92 (0.79–1.07) | 1301/132 | 1.04 (0.79–1.36) |
| 70–79 | 297/120 | 0.58 (0.45–0.76) | 403/14 | 0.24 (0.13–0.45) |
| 80+ | 105/30 | 0.36 (0.22–0.58) | 133/2 | 0.11 (0.03–0.41) |
| Level of acculturation | ||||
| Low (SL-ASIA score < 1.8) | 1453/559 | 1.00 | - | |
| High (SL-ASIA score ≥ 1.8) | 1176/865 | 1.22 (1.05–1.42) | - | N/A |
| Level of education (y) | ||||
| 0–5 | 129/37 | 1.00 | 160/6 | 1.00 |
| 6–11 | 858/264 | 0.93 (0.63–1.39) | 1080/42 | 0.86 (0.36–2.08) |
| 12 | 812/392 | 1.35 (0.91–2.01) | 1139/65 | 1.23 (0.52–2.91) |
| > 12 | 812/727 | 2.09 (1.41–3.09) | 1351/188 | 2.30 (0.98–5.36) |
| Annual household income | ||||
| < $20,000 | 1465/641 | 1.00 | 1981/125 | 1.00 |
| $20,000–< $40,000 | 672//354 | 1.07 (0.91–1.27) | 967/59 | 0.87 (0.63–1.22) |
| ≥ $40,000 | 312/329 | 1.51 (1.23–1.85) | 548/93 | 1.62 (1.17–2.24) |
| Unknown/refuse to disclose | 182/100 | 1.12 (0.84–1.50) | 257/25 | 1.30 (0.80–2.14) |
| Marital status | ||||
| Married/with stable partner | 2083/1035 | 1.00 | 2919/199 | 1.00 |
| Separated/Divorced/widowed | 413/248 | 1.24 (1.03–1.49) | 603/58 | 1.40 (1.01–1.94) |
| Never married | 112/127 | 2.11 (1.60–2.79)) | 200/39 | 2.62 (1.76–3.88) |
| Country of birth | ||||
| Outside of US | 2611/1393 | 1.00 | 3714/290 | 1.00 |
| US | 16/31 | 1.92 (1.02–3.61) | 35/12 | 2.19 (1.07–4.51) |
| History of ocular disease | ||||
| No | 2048/1054 | 1.00 | 2905/197 | 1.00 |
| Yes | 584/370 | 1.28 (1.07–1.54) | 849/105 | 2.07 (1.54–2.78) |
| History of non-ocular comorbidities | ||||
| 0 | 1099/662 | 1.00 | 1605/155 | 1.00 |
| 1 | 1206/621 | 0.84 (0.72–0.97) | 1711/116 | 0.65 (0.49–0.85) |
| ≥ 2 | 326/140 | 0.83 (0.65–1.07) | 435/31 | 0.86 (0.55–1.34) |
| Last complete eye exam | ||||
| More than 12 months ago | 1843/865 | 1.00 | 2550/158 | 1.00 |
| Within 12 months | 775/550 | 1.40 (1.20–1.63) | 1182/143 | 1.63 (1.25–2.13) |
Abbreviations: CHES = the Chinese American Eye Study; CI = confidence interval; OR = odds ratio; D=diopters; SL-ASIA= the Suinn-Lew Asian Self-Identity Acculturation Scale
N/A = odds ratio not applicable, because the variable was not a significant independent predictor in the final model for the given disease (myopia or high myopia)
DISCUSSION
As a large population-based study of eye diseases among Chinese 50 years and older living in the US, CHES provides robust estimates of overall and age- and sex-specific prevalence of refractive error. We have incorporated standardized ocular testing procedures and definitions of refractive errors to allow comparison of prevalence of refractive error in CHES to those for Chinese in Asia and for other racial/ethnic groups in the US.
The prevalence of myopia and high myopia in CHES are similar to or slightly higher than those from other studies of Chinese,18, 20, 28 except the Handan Eye Study. 19 Compared to the Handan Eye Study, CHES has higher prevalence of myopia and high myopia among individuals younger than 70 years, but a lower prevalence among older individuals.19 It is important to note that participants in the Handan Eye Study were rural residents, while participants in the other studies were urban residents. The lower prevalence of myopia observed in the Handan Eye Study before age 70 may be partly due to differences in the myopia genic environment experienced by rural and urban residents. For example, only 3% of participants in the Handan Eye Study had high school or more education,19 while the corresponding figure was 68% in CHES. However, even after controlling for differences in education level,21 urban living is still associated with a higher prevalence of myopia, suggesting other contributing factors. Due to limited access to care in rural areas, rural residents older than 70 may be less likely to receive cataract surgery and more likely to have refractive myopia as a result. This hypothesis is supported by the higher prevalence of cataract surgery in CHES (9.9%) than in the Handan Eye Study (0.9%).33 Moreover, rural residency has been associated with more visual impairment after cataract surgery in China.34 On the other hand, Chinese Americans in CHES have similar prevalence of hyperopia to both urban- and rural-living Chinese in Asia. However, there may be different age trends in hyperopia prevalence, which seemed to plateau or peak among Chinese in their 60s in Asia, but consistently increase among Chinese Americans in their 70s and 80s in CHES. This suggests potential environmental contributors to the development of hyperopia in older Chinese Americans.
Compared with other racial/ethnic groups in the US, especially blacks and Hispanics,29, 35, 36 Chinese Americans in CHES have a substantially higher prevalence of myopia. For high myopia, we saw similar patterns of an even greater magnitude. One contributing factor could be differences in the level of education, which has been consistently associated with rates of myopia.16 While 68% of Chinese Americans in CHES had at least 12 years of education, the corresponding figure was much lower for Hispanics and blacks: only 34% of Mexican Americans32, and 22% of blacks.29 However, differences in the level of education are unlikely to explain the higher prevalence of myopia and high myopia in Chinese Americans when compared with whites. For example, high myopia (≤ −5.0D) was almost twice as high among Chinese Americans in CHES as among whites in the Beaver Dam Eye Study,14, 31 despite similar levels of education. It is possible that the amount of time spent outdoors during childhood, which may be more biologically relevant for myopia development,16 could differ between whites and Chinese Americans, despite similar educational attainment. It is also possible that Chinese Americans may be more genetically susceptible to developing myopia and particularly high myopia, which is believed to have a larger genetic component.16 It has also been suggested that differences in myopia prevalence between populations may be related to differences in the prevalence of lens opacity; however, this hypothesis is difficult to directly evaluate because of between-study differences in the classification of lens opacity. It is worth noting that the biggest racial/ethnic disparity was observed among individuals 50 to 70 years old, ages at which cataract and cataract surgery are less frequent. Prevalence of any hyperopia (> +0.5D) is slightly lower, and prevalence of high hyperopia (≥ +3.0D) is much lower in Chinese Americans in CHES than in other racial/ethnic groups in the US. This is consistent with the higher prevalence of myopia in CHES, because factors associated with higher risk of myopia, such as level of education, are often associated with lower risk of hyperopia. Similarly, the high prevalence of astigmatism in CHES is probably partly due to the high prevalence of myopia. Myopia and astigmatism are highly correlated,37 and myopic astigmatism accounts for a large proportion of the astigmatism in CHES.
We observed a lower prevalence of myopia after age 70, even after controlling for other potential risk factors. Prior reports of age patterns for myopia have been inconsistent across studies, 14, 17–20, 32 possibly due to the combined effects of 3 factors, which vary across populations: a secular trend of higher myopia prevalence in recent generations due to a birth cohort effect, an age-related hyperopic shift due to intrinsic changes in the optic system, and the increasing prevalence of cataract surgery among older individuals and its association with myopia. For example, in the Handan Eye Study19 and the Tanjong Pagar Study,20 a reverse trend was observed, with higher prevalence of myopia among individuals older than 70. This discrepancy in the age trend of myopia may be partly due to the higher prevalence of cataract surgery in CHES (9.9% in CHES, 0.9% in the Handan Eye Study,33 and 5.1% in the Tanjong Pagar Study38). As participants who had cataract surgery were often excluded from analysis, myopia prevalence may be underestimated among older groups due to myopia’s association with a higher risk of cataract surgery.39 This underestimation may be particularly pronounced in CHES, given its higher prevalence of cataract surgery. Prevalence of hyperopia and astigmatism are consistently higher among older CHES participants. This age-related pattern of hyperopia may be influenced by the hyperopic shift that occurs with older age or associated with a birth cohort effect related to more myopic refractive error in younger generations.14 The higher prevalence of astigmatism among older participants may be largely due to the higher prevalence of hyperopia among older adults, as our subtype analyses (data not shown) revealed that the age-associated increase in astigmatism was more pronounced for hyperopic astigmatism.
We did not observe any marked sex difference in the prevalence of myopia and astigmatism in CHES. However, prevalence of hyperopia appeared to be slightly higher among females. Results from previous studies have been mostly inconsistent regarding sex differences in the prevalence of refractive error. While many studies found no sex differences in the prevalence of myopia,17–19, 29, 40 the Barbados Eye Study found a higher prevalence of myopia among men, and other studies found a higher prevalence of myopia1, 21, 31 and high myopia1, 20, 21 among women. As for hyperopia, several studies report a higher prevalence among older women,1, 14, 19, 29, 40 while other studies18, 20 reported no sex difference in hyperopia prevalence. As for astigmatism, some studies17, 19, 20 found higher prevalence among women, the Baltimore Eye Survey29 and the 1999–2004 NHANES1 reported lower prevalence among women, and other studies reported no sex difference.17, 20, 29, 40
In CHES, consistent with most previous studies,22 we found that level of education, income, and history of ocular disease were associated with prevalence of myopia/high myopia. The association between history of ocular disease and myopia/high myopia may be mostly attributed to NO-related myopic shift, because history of ocular disease was no longer associated with myopia and high myopia after excluding participants with NO. A high acculturation score, being born in the US, and lack of non-ocular comorbidities were also associated with higher prevalence of myopia, independent of education and income level. It is possible that acculturation, lack of non-ocular comorbidities (mainly arthritis), and country of birth may be surrogate measures for socioeconomic status, occupations associated with near work,41 and some aspects of the educational system (e.g., time devoted to indoor-versus-outdoor activities, academic competitiveness) that were not adequately captured by household income and years of formal education.32 Unique to CHES was the finding that the prevalence of myopia and high myopia was associated with marital status, which was examined but not found in previous studies.32, 42 The association between recent eye exam and higher prevalence of myopia is consistent with previous observations that individuals with impaired vision are more likely to use eye care.32, 43
CHES has a number of strengths, including its large sample size, high participation rate, and the use of standardized protocols. However, our study also has a number of limitations. First, because eligible individuals who participated were more likely to be better educated than those who did not,44 we may have overestimated myopia prevalence. On the other hand, we may have underestimated prevalence of myopia among older participants, because those excluded from analysis were mostly individuals who had cataract surgery. Second, use of noncycloplegic refraction may have led to overestimation of myopia prevalence due to excessive accommodation. However, because all CHES participants were older than 50 and had limited accommodative amplitude (< 0.5D),45 this overestimation is most likely small (≤ 2%46). Third, the actual differences in myopia prevalence between Chinese Americans, blacks, and whites may be smaller than what we observed, because data on blacks and whites were collected 10 to 25 years earlier, and older cohorts tend to have lower prevalence of myopia. Finally, the cross-sectional design of our study does not permit direct assessment of age-related changes in refraction and the establishment of temporal relationships between potential risk factors and myopia risk. In addition, we did not report our assessment of the contributions of ocular biometry and other ocular measurements to refractive error. Given the complexity of this subject, a comprehensive investigation will be reported in a separate manuscript.
In summary, we found that compared with other racial/ethnic groups in the US, Chinese Americans in CHES have substantially higher prevalence of myopia, high myopia, and astigmatism, but less hyperopia and high hyperopia. The particularly high prevalence of high myopia among Chinese Americans is an important public health concern, because high myopia can lead to a much higher risk of vision-threatening diseases, such as myopic retinopathy and glaucoma. The high prevalence of astigmatism among Chinese Americans can also be a concern given the crucial role of vision clarity for daily activities. Further evaluation of longitudinal changes in refraction are needed to identify causes of various refractive errors among Chinese Americans and to develop public health strategies to prevent the onset and development of myopia-related complications in this important and growing population.
Figure 4.
Comparison of the Prevalence of High Myopia in the Chinese American Eye Study (CHES) with Estimates from (top) Other Studies of Chinese and (bottom) Studies of Other Racial/ethnic Groups
Abbreviations: BES = Baltimore Eye Survey; CHES = Chinese American Eye Study; LALES = Los Angeles Latino Eye Study; Proyecto VER = Proyecto Vision Evaluation and Research Study; US = United States
Figure 5.
Comparison of (top) the Prevalence of Hyperopia in the Chinese American Eye Study (CHES) with Estimates from Other Studies of Chinese and (bottom) the Prevalence of High Hyperopia with Estimates from Studies of Other Racial/ethnic Groups.
Abbreviations: BES = Baltimore Eye Survey; CHES = Chinese American Eye Study; LALES = Los Angeles Latino Eye Study; Proyecto VER = Proyecto Vision Evaluation and Research Study; US = United States
Acknowledgments
Funding/Support: This work was supported by grant EY-017337 from the National Eye Institute, National Institutes of Health, Bethesda, Maryland, and an unrestricted Departmental grant from Research to Prevent Blindness, New York, NY 10022.
Other acknowledgements: See Appendix for members/affiliations of the Chinese American Eye Study Group
Appendix
The Chinese American Eye Study Group
USC Roski Eye Institute, University of Southern California, Rohit Varma, MD, MPH (Principal Investigator); Roberta McKean-Cowdin, PhD (Co- Investigator); Stanley P. Azen, PhD (Co–Investigator); Mina Torres, MS (Project Director); Chunyi Hsu, MPH (Project Manager); David Dinh, BA (Research Assistant); Ruzhang Jiang, MD (Examiner); Jie Sun, MD, PhD, MPH (Examiner); Dandan Wang, MD (Examiner); YuPing Wang, COT (Examiner); Justine Wong, BA (Clinical interviewer); Shuang Wu, MS (Statistician): Rucha Desai, MS (Programmer); the Battelle Survey Research Center, Lisa V. John, PhD (Recruitment Director); Michelle Cheng, MS (Field Supervisor).
CHES Data Monitoring and Oversight Committee
Alfred Sommer, MD, MHS (Chair); Anne Coleman, MD, PhD; Dennis Han, MD; Craig Hanis, PhD; Louise Wideroff, PhD; and Terri Young, MD.
Footnotes
Disclosure
Financial Disclosures: No financial disclosures.
Publisher's Disclaimer: This is a PDF file of an unedited manuscript that has been accepted for publication. As a service to our customers we are providing this early version of the manuscript. The manuscript will undergo copyediting, typesetting, and review of the resulting proof before it is published in its final citable form. Please note that during the production process errors may be discovered which could affect the content, and all legal disclaimers that apply to the journal pertain.
References
- 1.Vitale S, Ellwein L, Cotch M, Ferris FL, III, Sperduto R. Prevalence of refractive error in the United States, 1999–2004. Arch Ophthalmol. 2008;126(8):1111–1119. doi: 10.1001/archopht.126.8.1111. [DOI] [PMC free article] [PubMed] [Google Scholar]
- 2.Vitale S, Cotch MF, Sperduto R, Ellwein L. Costs of refractive correction of distance vision impairment in the United States, 1999–2002. Ophthalmology. 2006;113(12):2163–2170. doi: 10.1016/j.ophtha.2006.06.033. [DOI] [PubMed] [Google Scholar]
- 3.Pascolini D, Mariotti SP. Global estimates of visual impairment: 2010. Br J Ophthalmol. 2012;96(5):614–618. doi: 10.1136/bjophthalmol-2011-300539. [DOI] [PubMed] [Google Scholar]
- 4.Congdon NG, Friedman DS, Lietman T. Important causes of visual impairment in the world today. JAMA. 2003;290(15):2057–2060. doi: 10.1001/jama.290.15.2057. [DOI] [PubMed] [Google Scholar]
- 5.Dandona R, Dandona L. Refractive error blindness. Bull World Health Organ. 2001;79(3):237–243. [PMC free article] [PubMed] [Google Scholar]
- 6.Resnikoff S, Pascolini D, Mariotti SP, Pokharel GP. Global magnitude of visual impairment caused by uncorrected refractive errors in 2004. Bull World Health Organ. 2008;86(1):63–70. doi: 10.2471/BLT.07.041210. [DOI] [PMC free article] [PubMed] [Google Scholar]
- 7.Saw SM, Gazzard G, Shih-Yen EC, Chua WH. Myopia and associated pathological complications. Ophthalmic Physiol Opt. 2005;25(5):381–391. doi: 10.1111/j.1475-1313.2005.00298.x. [DOI] [PubMed] [Google Scholar]
- 8.Wong TY, Ferreira A, Hughes R, Carter G, Mitchell P. Epidemiology and disease burden of pathologic myopia and myopic choroidal neovascularization: an evidence-based systematic review. Am J Ophthalmol. 2014;157(1):9–25. e12. doi: 10.1016/j.ajo.2013.08.010. [DOI] [PubMed] [Google Scholar]
- 9.Chang L, Pan CW, Ohno-Matsui K, et al. Myopia-related fundus changes in Singapore adults with high myopia. Am J Ophthalmol. 2013;155(6):991–999. e991. doi: 10.1016/j.ajo.2013.01.016. [DOI] [PubMed] [Google Scholar]
- 10.Koh VT, Nah GK, Chang L, et al. Pathologic changes in highly myopic eyes of young males in Singapore. Ann Acad Med Singapore. 2013;42(5):216–224. [PubMed] [Google Scholar]
- 11.The Eye Disease Case-Control Study G. Risk factors for idiopathic rhegmatogenous retinal detachment. American Journal of Epidemiology. 1993;137(7):749–757. [PubMed] [Google Scholar]
- 12.Mitchell P, Hourihan F, Sandbach J, Wang JJ. The relationship between glaucoma and myopia: the Blue Mountains Eye Study. Ophthalmology. 1999;106(10):2010–2015. doi: 10.1016/s0161-6420(99)90416-5. [DOI] [PubMed] [Google Scholar]
- 13.Pan C-W, Klein BE, Cotch MF, et al. Racial variations in the prevalence of refractive errors in the United States: the Multi-Ethnic Study of Atherosclerosis. Am J Ophthalmol. 2013;155(6):1129–1138. e1121. doi: 10.1016/j.ajo.2013.01.009. [DOI] [PMC free article] [PubMed] [Google Scholar]
- 14.Kempen JH, Mitchell P, Lee KE, et al. The prevalence of refractive errors among adults in the United States, Western Europe, and Australia. Arch Ophthalmol. 2004;122(4):495–505. doi: 10.1001/archopht.122.4.495. [DOI] [PubMed] [Google Scholar]
- 15.Vitale S, Sperduto RD, Ferris FL., III Increased prevalence of myopia in the United States between 1971–1972 and 1999–2004. Arch Ophthalmol. 2009;127(12):1632–1639. doi: 10.1001/archophthalmol.2009.303. [DOI] [PubMed] [Google Scholar]
- 16.Morgan IG, Ohno-Matsui K, Saw S-M. Myopia. The Lancet. 2012;379(9827):1739–1748. doi: 10.1016/S0140-6736(12)60272-4. [DOI] [PubMed] [Google Scholar]
- 17.Cheng CY, Hsu WM, Liu JH, Tsai SY, Chou P. Refractive errors in an elderly Chinese population in Taiwan: the Shihpai Eye Study. Invest Ophthalmol Vis Sci. 2003;44(11):4630–4638. doi: 10.1167/iovs.03-0169. [DOI] [PubMed] [Google Scholar]
- 18.He M, Huang W, Li Y, Zheng Y, Yin Q, Foster PJ. Refractive error and biometry in older Chinese adults: the Liwan eye study. Invest Ophthalmol Vis Sci. 2009;50(11):5130–5136. doi: 10.1167/iovs.09-3455. [DOI] [PubMed] [Google Scholar]
- 19.Liang YB, Wong TY, Sun LP, et al. Refractive errors in a rural Chinese adult population the Handan eye study. Ophthalmology. 2009;116(11):2119–2127. doi: 10.1016/j.ophtha.2009.04.040. [DOI] [PubMed] [Google Scholar]
- 20.Wong TY, Foster PJ, Hee J, et al. Prevalence and risk factors for refractive errors in adult Chinese in Singapore. Invest Ophthalmol Vis Sci. 2000;41(9):2486–2494. [PubMed] [Google Scholar]
- 21.Xu L, Li J, Cui T, et al. Refractive error in urban and rural adult Chinese in Beijing. Ophthalmology. 2005;112(10):1676–1683. doi: 10.1016/j.ophtha.2005.05.015. [DOI] [PubMed] [Google Scholar]
- 22.Foster PJ, Jiang Y. Epidemiology of myopia. Eye (Lond) 2014;28(2):202–208. doi: 10.1038/eye.2013.280. [DOI] [PMC free article] [PubMed] [Google Scholar]
- 23.The rise of Asian Americans. Pew Research Center; http://www.pewsocialtrends.org/files/2013/04/Asian-Americans-new-full-report-04-2013.pdf Updated edition: April 4, 2013. [Google Scholar]
- 24.Hoeffel EM, Rastogi S, Kim MO, Shahid H. The Asian Population: 2010. United Sstates Census Bureau Website; https://www.census.gov/prod/cen2010/briefs/c2010br-11.pdf. [Google Scholar]
- 25.Foster PJ. Myopia in Asia. Br J Ophthalmol. 2004;88(4):443–444. doi: 10.1136/bjo.2003.031476. [DOI] [PMC free article] [PubMed] [Google Scholar]
- 26.Grosvenor T. Why is there an epidemic of myopia? Clin Exp Optom. 2003;86(5):273–275. doi: 10.1111/j.1444-0938.2003.tb03122.x. [DOI] [PubMed] [Google Scholar]
- 27.Varma R, Hsu C, Wang D, Torres M, Azen SP. The Chinese American Eye Study: design and methods. Ophthalmic Epidemiol. 2013;20(6):335–347. doi: 10.3109/09286586.2013.823505. [DOI] [PMC free article] [PubMed] [Google Scholar]
- 28.Pan C-W, Zheng Y-F, Anuar AR, et al. Prevalence of refractive errors in a multiethnic Asian population: the Singapore Epidemiology of Eye Disease Study. Invest Ophthalmol Vis Sci. 2013;54(4):2590–2598. doi: 10.1167/iovs.13-11725. [DOI] [PubMed] [Google Scholar]
- 29.Katz J, Tielsch JM, Sommer A. Prevalence and risk factors for refractive errors in an adult inner city population. Invest Ophthalmol Vis Sci. 1997;38(2):334–340. [PubMed] [Google Scholar]
- 30.Profile of general population and housing characteristics: 2010 (2010 Census Summary file 2) United States Census Bureau Website; [Accessed April 25, 2013]. http://factfinder2.census.gov/faces/tableservices/jsf/pages/productview.xhtml?pid=DEC_10_SF2_SF2DP1&prodType=table. [Google Scholar]
- 31.Wang Q, Klein BE, Klein R, Moss SE. Refractive status in the Beaver Dam Eye Study. Invest Ophthalmol Vis Sci. 1994;35(13):4344–4347. [PubMed] [Google Scholar]
- 32.Tarczy-Hornoch K, Ying-Lai M, Varma R the Los Angeles Latino Eye Study Group. Myopic refractive error in adult Latinos: the Los Angeles Latino Eye Study. Invest Ophthalmol Vis Sci. 2006;47(5):1845–1852. doi: 10.1167/iovs.05-1153. [DOI] [PubMed] [Google Scholar]
- 33.Duan XR, Liang YB, Wang NL, et al. Prevalence and associations of cataract in a rural Chinese adult population: the Handan Eye Study. Graefes Arch Clin Exp Ophthalmol. 2013;251(1):203–212. doi: 10.1007/s00417-012-2012-x. [DOI] [PubMed] [Google Scholar]
- 34.Liu B, Xu L, Wang YX, Jonas JB. Prevalence of cataract surgery and postoperative visual outcome in greater Beijing: the Beijing Eye Study. Ophthalmology. 2009;116(7):1322–1331. doi: 10.1016/j.ophtha.2009.01.030. [DOI] [PubMed] [Google Scholar]
- 35.Muñoz B, West SK, Rodriguez J, et al. Blindness, visual impairment and the problem of uncorrected refractive error in a Mexican-American population: Proyecto VER. Invest Ophthalmol Vis Sci. 2002;43(3):608–614. [PubMed] [Google Scholar]
- 36.Broman AT, Munoz B, Rodriguez J, et al. The impact of visual impairment and eye disease on vision-related quality of life in a Mexican-American population: Proyecto VER. Invest Ophthalmol Vis Sci. 2002;43(11):3393–3398. [PubMed] [Google Scholar]
- 37.Kaye SB, Patterson A. Association between total astigmatism and myopia. J Cataract Refract Surg. 1997;23(10):1496–1502. doi: 10.1016/s0886-3350(97)80020-x. [DOI] [PubMed] [Google Scholar]
- 38.Seah SK, Wong TY, Foster PJ, Ng TP, Johnson GJ. Prevalence of lens opacity in Chinese residents of Singapore: the Tanjong Pagar Survey. Ophthalmology. 2002;109(11):2058–2064. doi: 10.1016/s0161-6420(02)01221-6. [DOI] [PubMed] [Google Scholar]
- 39.Younan C, Mitchell P, Cumming RG, Rochtchina E, Wang JJ. Myopia and incident cataract and cataract surgery: the Blue Mountains Eye Study. Investigative Ophthalmology & Visual Science. 2002;43(12):3625–3632. [PubMed] [Google Scholar]
- 40.Attebo K, Ivers RQ, Mitchell P. Refractive errors in an older population: the Blue Mountains Eye Study. Ophthalmology. 1999;106(6):1066–1072. doi: 10.1016/S0161-6420(99)90251-8. [DOI] [PubMed] [Google Scholar]
- 41.Li X, Sundquist J, Sundquist K. Socioeconomic and occupational risk factors for rheumatoid arthritis: a nationwide study based on hospitalizations in Sweden. J Rheumatol. 2008;35(6):986–991. [PubMed] [Google Scholar]
- 42.Shen SY, Wong TY, Foster PJ, et al. The prevalence and types of glaucoma in Malay people: the Singapore Malay Eye Study. Invest Ophthalmol Vis Sci. 2008;49(9):3846–3851. doi: 10.1167/iovs.08-1759. [DOI] [PubMed] [Google Scholar]
- 43.McCarty CA, Taylor HR. Myopia and vision 2020. Am J Ophthalmol. 2000;129(4):525–527. doi: 10.1016/s0002-9394(99)00444-4. [DOI] [PubMed] [Google Scholar]
- 44.Varma R, Kim JS, Burkemper BS, et al. Prevalence and Causes of Visual Impairment and Blindness in Chinese American Adults: The Chinese American Eye Study. JAMA Ophthalmol. 2016;134(7):785–793. doi: 10.1001/jamaophthalmol.2016.1261. [DOI] [PubMed] [Google Scholar]
- 45.Anderson HA, Hentz G, Glasser A, Stuebing KK, Manny RE. Minus-Lens–Stimulated accommodative amplitude decreases sigmoidally with age: a study of objectively measured accommodative amplitudes from age 3. Invest Ophthalmol Vis Sci. 2008;49(7):2919–2926. doi: 10.1167/iovs.07-1492. [DOI] [PMC free article] [PubMed] [Google Scholar]
- 46.Fotouhi A, Morgan IG, Iribarren R, Khabazkhoob M, Hashemi H. Validity of noncycloplegic refraction in the assessment of refractive errors: the Tehran Eye Study. Acta Ophthalmol. 2012;90(4):380–386. doi: 10.1111/j.1755-3768.2010.01983.x. [DOI] [PubMed] [Google Scholar]


