

Abstract
Study Objectives:
Obstructive sleep apnea (OSA) and type 2 diabetes mellitus (T2DM) are prevalent disorders that pose increased risk of cardiovascular disease and death. The objective of this study was to clarify if continuous positive airway pressure (CPAP) therapy for OSA affects T2DM control and emergence.
Methods:
Point-of-care, comparative effectiveness study; cross-sectional and longitudinal analyses.
Results:
Our cohort included 928 consecutive patients; 13% were women; 36% were Caucasians and 61% African-Americans. OSA was diagnosed in approximately 738 patients and CPAP was initiated in 718 patients; median duration of therapy was 5 mo (25% to 75% interquartile range [IQR] 3–14). Patients with OSA used CPAP therapy for a median duration of 4.8 h, 34.5% of the nights. Adherence to CPAP was prespecified as follows: good (≥ 70% nights and ≥ 4 h/night), excellent (≥ 80% nights and ≥ 6 h/night) or outstanding (≥ 90% of nights and 8 h/night). Based on objective data, good, excellent, and outstanding compliance were found in only 30%, 20%, and 6%, respectively. Three percent of subjects without CPAP follow-up and less than 4% of those nonadherent to CPAP therapy (based on the established criteria) developed incident T2DM. Incident T2DM developed in only 0.8% of those with good compliance and in none (0%) of those in the excellent and outstanding groups. During follow-up, median weight change was +0.3 kg (IQR −1.8 to 2.7).
Conclusions:
We found that an outstanding compliance to CPAP reduced fasting blood glucose in patients with OSA. Longitudinally, higher levels of therapeutic adherence may affect the rate of incident impaired fasting glucose, prediabetes, and T2DM, despite the observed weight gains.
Commentary:
A commentary on this article appears in this issue on page 365.
Citation:
Ioachimescu OC, Anthony Jr J, Constantin T, Ciavatta MM, McCarver K, Sweeney ME. VAMONOS (Veterans Affairs' Metabolism, Obstructed and Non-Obstructed Sleep) study: effects of CPAP therapy on glucose metabolism in patients with obstructive sleep apnea. J Clin Sleep Med. 2017;13(3):455–466.
Keywords: CPAP therapy, diabetes, obstructive sleep apnea, prediabetes, sleep apnea
INTRODUCTION
Obstructive sleep apnea (OSA) is the one of the most common sleep disorders, yet still significantly underdiagnosed. Current prevalence estimates of moderate to severe OSA (i.e., apnea-hypopnea index [AHI] ≥ 15 events/h) are 10% among 30- to 49-y-old men, 17% in 50- to 70-y-old men, 3% among 30- to 49-y-old women and 9% in 50- to 70-y-old women. These prevalence rates increased by 14% to 55% over the past two decades, depending on the subgroup studied.1 These epidemiologic changes are strikingly similar to the obesity trends in the general population.2 Similarly, the prevalence of type 2 diabetes mellitus (T2DM), a condition linked intimately to obesity, has been increasing alarmingly, to more than 8% of the population.3 Prediabetes is considered an intermediate state between normal glucose metabolism and T2DM, as T2DM develops in approximately 70% of patients.4 It has been estimated that almost 50% of men and 40% of women of age 50–64 y have pre-diabetes.5 Prediabetes is characterized by insulin resistance and glucose intolerance. Prediabetes is defined as fasting blood glucose (FBG) between 100 and 125 mg/dL (also called impaired fasting glucose, IFG), or a 2-h plasma glucose between 140 and 199 mg/dL after a 75-g oral glucose load or a glycated hemoglobin (hemoglobin A1c, HbA1c) between 5.7% and 6.4%.
BRIEF SUMMARY
Current Knowledge/Study Rationale: The effects of sustained CPAP therapy on glucose metabolism in patients with OSA are still unclear. We aimed to assess trends in hemoglobin A1c, fasting blood glucose, and other metabolic parameters in a large cohort of consecutive patients seen in sleep clinics, in relationship to body weight fluctuations, medication changes, and adherence to CPAP therapy.
Study Impact: We found that patients with OSA treated with CPAP tend to gain more weight, in a “dose”-response relationship, yet the glucose metabolism is improved with better therapeutic adherence. Even with a median follow-up of less than 1 y, we found that incident diabetes mellitus and impaired fasting glucose are significantly curtailed by superior adherence to CPAP therapy.
In the triangle delineated by obesity, OSA, and T2DM, there are complex bidirectional relationships. As such, obesity is a major risk factor for OSA, but an OSA to obesity directionality has also been posited. If the connections between obesity and T2DM are well established, there are data showing that OSA and diabetes are also interconnected, both mediated and independent of obesity. Pathophysiologically, increased adiposity, intermittent hypoxia, enhanced sympathetic activity, increased catecholamines and cortisol levels, suppressed slow wave sleep, and sleep fragmentation may all contribute to a certain extent to the development of diabetes mellitus in patients with OSA.
Multiple clinic-based and community studies showed an association between OSA and insulin resistance, IFG, impaired glucose tolerance (IGT), or overt T2DM.6–10 Despite this relationship, treatment of OSA with continuous positive airway pressure (CPAP) has shown so far mixed results in improving glucose metabolism.11–13 Several observational studies found that CPAP therapy may improve insulin resistance14,15 or hemoglobin A1c,16 whereas others failed to identify significant benefits.17,18 There were only a handful of published randomized controlled trials evaluating this relationship and their results are also divergent: several studies12,19 found no changes in hemoglobin glycation or insulin sensitivity after 1–6 mo of CPAP therapy, whereas others found insulin sensitivity improved after 2–6 mo of therapy.20
Several meta-analyses have been published in recent years21,22 assessed the effects of CPAP therapy in studies that used the homeostasis model assessment of insulin resistance (HOMA-IR). In one of them,21 authors found that CPAP treatment did not significantly change FBG values, but improved HOMA-IR, yet this finding was seen only in patients without T2DM. Iftikhar et al.,22 looking at pooled data from six studies that evaluated the effects of CPAP only in patients without diabetes, also found a favorable effect of CPAP therapy on insulin resistance in patients with OSA and no diabetes. While the effect size was modest, it was not insignificant, prompting the authors to recommend further studies, involving a larger number of patients and longer treatment periods to clarify the effects of CPAP on insulin resistance.
Since then, a few more controlled randomized studies have been published, but the results have been largely discordant.23–25 Potential confounders in the available trials are: size of the studies (generally small), patients enrolled (obese or not, normal or dysglycemic), type and duration of treatment, and the actual monitoring of the therapeutic adherence.26 In order to elucidate some of these discrepancies and to assess these effects in a real-world patient population, we initiated a large, non-randomized, point-of-care, comparative effectiveness study, aimed at evaluating cross-sectionally and longitudinally the effects of CPAP therapy on various metabolic parameters in OSA patients, with and without T2DM. Given that prior studies showed that CPAP usage at higher intensity, i.e., more than the traditional 70% of the nights and more than 4 hours nightly may be more beneficial, we aimed to assess the metabolic effects of CPAP used by more stringent adherence criteria.
METHODS
Patient Assessments
Patient data were collected from Veterans Affairs' electronic medical record system (available since 1991). This is one of the first analyses of the VAMONOS (Veterans Affairs' Metabolism, Obstructed and Non-Obstructed Sleep) study cohort, which is a patient population that we assess periodically for therapeutic adherence, effectiveness, as well as natural history of sleep and associated metabolic conditions. We performed first a retrospective analysis on all (new and established) consecutive patients seen in Atlanta VA Sleep Medicine Clinic by three different providers between 10/1/2012–9/30/2013 (n = 928). The database was created 1 y after the last patient had his sleep clinic evaluation (retrospective component). The subsequent assessment was approximately 1 y later (prospective component). At each visit, height, weight, neck and waist circumference were measured and recorded; body mass index (BMI) was then calculated. Epworth Sleepiness Scale (ESS) and several other questionnaires were administered at all visits. Medical comorbidities were defined as follows: hypertension was recorded if the diagnosis was in the problem list or antihypertensive medications were prescribed for this indication; diabetes mellitus was documented if the disease was found mentioned in the problem list, a hemoglobin A1c level ≥ 6.5% was identified or any prescription for any anti-diabetic medications was found; dyslipidemia was considered present if a diagnosis of “dyslipidemia,” “hyperlipidemia” or “hypertriglyceridemia” was found in the problem list or if the patient was on lipid-modifying agents. Coronary artery disease was recorded as present if “angina,” “myocardial infarction” or “coronary artery disease” was identified in the problem list or the results of a coronary angiogram were available. Death, incident diabetes and prediabetes were also ascertained from the medical records during the follow-up.
Assessment of Sleep-Disordered Breathing and Adherence to CPAP Therapy
Patients underwent sleep studies as considered clinically indicated and ordered by the respective sleep professionals (per protocol, in order to assess the clinical suspicion of OSA, all patients had a Berlin questionnaire administered at baseline). Sleep testing consisted of polysomnography (PSG) studies in all patients (no home sleep testing) in accordance with the American Academy of Sleep Medicine (AASM) professional standards and the protocols and procedures of our sleep center. Monitoring included pulse oximetry; respiratory effort by inductance plethysmography; electromyographic, electrocardiographic, electroencephalographic, and airflow monitoring (by oronasal thermistor and nasal pressure transducer. Respiratory events were defined per standard AASM 2012 criteria27: apnea was defined as a reduction in respiratory flow amplitude of ≥ 90% from baseline (for > 10 sec), and hypopnea was defined as a reduction in flow of ≥ 30% from baseline (for > 10 sec), accompanied by either an arousal or an oxygen desaturation of ≥ 3%. Obstructive apneas and hypopneas were defined by aforementioned flow criteria and presence of respiratory effort. In the analysis, all mixed apneas were categorized as central events and all hypopneas were considered by default obstructive. A diagnosis of OSA was made if AHI was ≥ 5; AHI of 5–14.9 defined mild OSA, 15–29.9 moderate OSA, and ≥ 30 severe OSA, which represent standard severity thresholds. The PSG analyses included the number of obstructive apneas, central apneas, hypopneas, nadir and mean oxihemoglobin saturation (SpO2), total sleep time, sleep time with SpO2 of ≤ 90%, percentage of sleep time with SpO2 of ≤ 90% (hypoxic burden), oxygen desaturation index, and diagnosis of OSA and/or other sleep disorders.
Based on the PSG findings, positive airway pressure (PAP, in the form of CPAP, bilelvel PAP or other forms, hereafter called for simplicity CPAP) therapy was initiated for all patients with moderate-severe OSA (unless refused) and for mild OSA with significant cardiopulmonary comorbidities or daytime symptoms (Figure 1). The majority of patients were started on autoadjustable CPAP therapy (6–18 cm H2O), unless a dedicated titration was ordered and identified an optimal PAP setting. CPAP initiation date was recorded when the device was programmed and issued, and CPAP education was performed by a dedicated technologist in a 1:1 session lasting 30–45 min. At the subsequent visit, CPAP device was interrogated by smart card or “cloud”-based system download and the percentage of nights used, median hours of usage nightly, and fixed, P95/P90 level (in cm H20, as reported by the device) were recorded. At least 2 mo after CPAP initiation, patients were seen again in clinic; weight, neck girth, waist circumference, and Epworth Sleepiness Scale (ESS) score were reassessed. Adherence to CPAP therapy was assessed by interview (subjectively) and by interrogation of the CPAP device (objectively). Adherence to CPAP therapy was defined as percent of nights used and by the median number of hours of CPAP usage nightly. Three classification systems of CPAP use were defined a priori (Figure 2): good (median ≥ 4 h and ≥ 70% of nights used), excellent (median ≥ 6 h and ≥ 80% of nights used) and outstanding compliance (median ≥ 8 h and ≥ 90% of nights used). Those who met these specific criteria were considered adherent (+), whereas those who did not meet the criteria were, for the purpose of these analyses, nonadherent (−).
Figure 1. Study flow chart.

?? = missing both hemoglobin A1C (HbA1c) and fasting blood glucose (FBG), and no antidiabetic medications. Overall only 143 patients (15% of total) were missing values for both HbA1c and FBG. * = patients excluded from analyses due to irreconcilable data. DM = diabetes mellitus, PreDM = prediabetes mellitus (hemoglobin A1c or HbA1c ≥ 6.5%), Nl = normal (HbA1c < 5.8%), OSA = obstructive sleep apnea, CPAP = continuous positive airway pressure (included here are all forms of PAP).
Figure 2. Compliance graph.
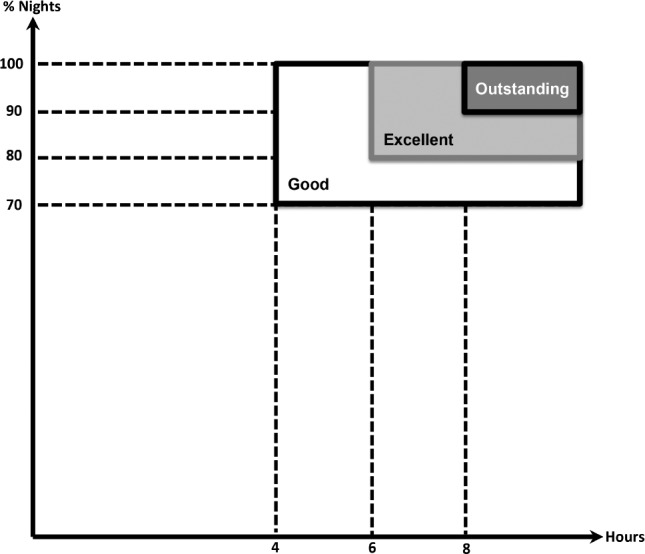
Depiction of % of nights of continuous positive airway pressure (CPAP) usage (on Y axis) versus median hours of CPAP usage (on X axis) and the three compliance categories (good, excellent, and outstanding).
Laboratory Assessments
Pretreatment and posttreatment metabolic parameters (hemoglobin A1c or HBA1c, fasting blood glucose or FBG, total cholesterol, calculated low-density lipoprotein cholesterol, high-density cholesterol, and triglycerides) immediately before and after at least 2 mo of CPAP therapy were extracted. Pre-diabetes and diabetes were defined by standard criteria, i.e., HbA1c 5.7% to 6.49%, and ≥ 6.5%, respectively; IFG was defined as FBG level of ≥ 100 and < 126 mg/dL. Any changes in antihypertensive regimen, lipid modifying agents, or diabetes medications were recorded.
Statistical Analysis
Statistical analysis was performed using JMP 13 Pro software (SAS Institute, Cary, NC, USA). Continuous variables were presented as mean and standard deviation (when distribution was normal) or median and 25% to 75% IQR (when distribution was not normal); Normality of each variable was checked using Q-Q plots and verified for goodness of fit by using Shapiro-Wilk W or Kolmogorov-Smirnov tests, as appropriate. We compared continuous variables between groups using Student t or equivalent tests (e.g., Tukey-Kramer honest significant difference) when variances were similar or Wilcoxon/Kruskal-Wallis rank-sum test for groups with different variances. Tests used to verify that the variances were equal were: O'Brien [0.5], Brown-Forsythe, Levene, Bartlett, and two-sided F test (in all analyses) and adjudicated based on a minimum of three out of five tests concordant for significance and when discordant, giving priority to the first three tests. Baseline categorical characteristics were compared between groups using chi-square and Fisher exact tests (when appropriate). The relationships between different variables and delta HbA1c or delta FBG were determined by Pearson correlation and simple regression analysis using weighted least squares. Various parameters were then included in stepwise multiple linear regression analyses; these models were run to investigate if changes in body mass index (BMI), weight, or other variables had an effect on absolute or delta values for HbA1c and FBG. Colinearity was also evaluated by the variance inflation factor. Logistic regression models were also used to investigate the influence of other variables on incident diabetes, prediabetes, and IFG. Missing data analysis was also performed; the imputation of missing values was accomplished by two different methods in JMP Pro: (1) means method, i.e., using the means of the existing values to replace the missing values; (2) expectation maximization method, which entails several iterations (at first pass the missing values are replaced with the means of the existing values, while at successive iterations, the missing values are replaced with the predicted values using the previous model). A two-sided p < 0.05 was considered statistically significant.
Institutional review committee approvals were obtained for this project (Emory University IRB# 00049576, Atlanta VA R&D# 2610, VA# 002); no informed consent was necessary. This study is an investigator-initiated project without a specific source of funding at the time of this publication.
Preliminary results of this analysis have been communicated in an oral presentation at the 2015 CHEST (American College of Chest Physicians) meeting, in Montreal, Canada, October 2015.28
RESULTS
Demographic Data
The cohort included 928 consecutive patients seen in sleep clinics by three healthcare professionals (KMC, MMC, and OCI). Three subjects were excluded from analyses due to documentation errors or irreconcilable data. Figure 1 shows the study flow chart, detailing the main diagnoses, i.e., OSA versus no OSA, on CPAP therapy or not, and the glucose metabolism status at baseline (normal, prediabetes, or diabetes mellitus). The diagnosis of OSA was already established at baseline in 39% of patients (due to a study ordered and performed before the Sleep Clinic visit 1 of the inclusion period) or the baseline visit identified a high clinical probability of sleep-disordered breathing, and hence a diagnostic PSG was ordered. We identified 143 subjects who did not have HbA1c or FBG available in the computerized system prior to CPAP initiation, did not carry a diagnosis of diabetes mellitus or prediabetes, and were not on any antidiabetic medications. In Figure 1, we classified these subjects in “unknown status,” yet the majority of them were likely in the normal category, as only a very small fraction of patients would have had their entire care for the aforementioned conditions outside our system.
Among the 925 subjects, 803 (87%) were males and 122 (13%) were females; 328 were self-reported as Caucasians or whites (36%) and 560 as African-Americans or blacks (61%, Table 1). At baseline, 64% were obese (BMI ≥ 30), 29% were overweight (25 ≤ BMI < 30) and 7% had normal weight (BMI < 25). Men were heavier than women (median weight 103 versus 87 kg, respectively, p < 0.001), but the overall BMI distribution was similar (median BMI was 32 kg/m2 for both sexes, p = 0.95). Obesity rates were also similar in the two groups (64% and 67% in men and women, respectively, p = 0.76). Neck and abdominal circumferences were significantly higher in men versus women (p < 0.001). Among the 738 patients with OSA, 521 (71%) had excessive daytime sleepiness (EDS, i.e., ESS > 10), 206 (28%) had no EDS (ESS < 10) and 11 subjects' (1%) ESS score was unknown. Among patients without OSA, 131 (70%) had EDS, 51 (27%) did not have EDS and 5 (3%) did not have an ESS score. In those with OSA and on CPAP therapy, 72% had EDS (similar rates in different severity groups), while among patients with untreated previously diagnosed OSA only 57% had EDS (likely explaining why they were not placed on therapy). Among patients with OSA, 50% of men and 34% of women had moderate-severe OSA.
Table 1.
Initial characteristics of the cohort (n = 928).
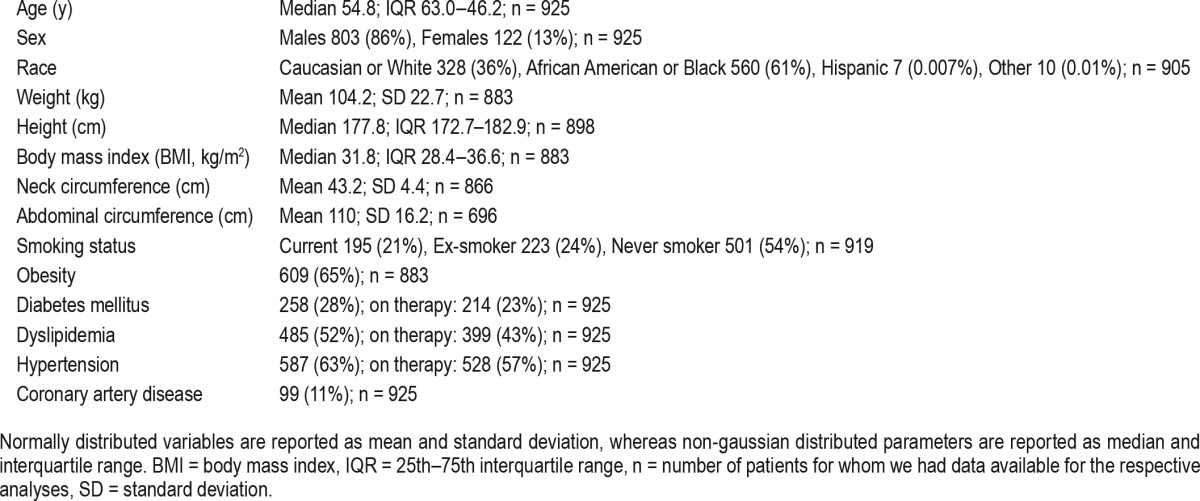
Approximately 28% of subjects in the cohort had a diagnosis of diabetes mellitus, 52% dyslipidemia, 63% hypertension, and 11% had coronary artery disease. Among subjects with T2DM, 83% were on anti-diabetic medications; 23% were on insulin only, and 23% were on insulin and a second agent.
Polysomonographic Parameters
Median total sleep time was 327 min (IQR 268.75–366; range 21.5–519) and median sleep efficiency was 80.7% (IQR: 69– 88.2, range: 9.1–100). Median AHI was 11 (IQR 5.5–20.7, range: 0–146); median central apnea index was 0.13 (IQR 0–0.64, range: 0–34.2); median obstructive apnea index was 2.1 (0.5–6.5, range: 0–97.5); median hypopnea index was 6.9 events/h (IQR 2.7–12.6, range 0–75.6). Median nadir oxyhemoglobin saturation was 84% (IQR 79–88, range: 31–96), whereas the median of the mean oxyhemoglobin saturation was 94% (IQR 92–96, range: 65–100); median time with an oxygen saturation < 90% was 6.8 min (IQR 0.6–39.6, range: 0–415.9), whereas median hypoxic burden was 2.2% (IQR 0.2–15, range: 0–100).
Patient Assessments
After clinical and polysomnographic evaluation, 738 patients (80%) received a diagnosis of OSA; 52% of them had mild, 30% moderate, and 18% severe OSA. Among these subjects, 718 (78%) were started on CPAP therapy. Patients were followed between the Sleep Clinic visit 1 and the CPAP follow-up for a median of 9 mo (IQR 5–12). Between the date of PSG and the follow-up CPAP clinic visit, approximately 2 mo (median) passed (with an IQR of 1–5 mo). Over the period of follow-up (i.e., between the initial and follow-up clinic visits), median weight change was +0.3 kg (IQR −1.8 to 2.7), which corresponds to a median increase in BMI of 0.1 kg/m2 (IQR −0.6 to 0.8) (p < 0.05 for both).
CPAP Therapy
CPAP therapy was initiated for all patients with moderate-severe OSA who accepted it (n = 277), for mild OSA with significant cardiopulmonary comorbidity or daytime symptoms (n = 296), and for subjects with OSA of unknown severity (PSG studies not available) and EDS (ESS score > 10) or other comorbidities (n = 145). In addition, two patients from the non-OSA group, with a diagnosis of upper airway resistance syndrome and daytime symptoms were started on CPAP. After discussions with their healthcare professional, 11 patients with OSA were started on other therapeutic modalities (i.e., not positive airway pressure). CPAP therapy was not instituted in 20 patients: 4 patients with unknown OSA severity, 7 subjects with moderate-severe OSA who refused or did not tolerate CPAP during the initial setup, 3 subjects with mild OSA and no EDS (ESS ≤ 10), and 6 patients with mild OSA and EDS. Because this was not a randomized study with specific allocations, patients received therapy in accordance to the aforementioned criteria and the discussion with their health-care professional.
Overall, CPAP therapy was initiated in 720 of the cohort patients (78%); 718 for OSA and 2 for upper airway resistance syndrome. The PAP modalities used were: autoadjustable CPAP (51% of cases), fixed CPAP (33% of patients), fixed bi-level PAP (9%), autoadjustable bilevel PAP (5%), servoventilation (< 1%) or volume-assured pressure support ventilation (< 1%).
Median p95/p90 or fixed CPAP setting for patients with OSA was 11 cm H2O (IQR 9.4–13.1, range 5–20.5), used for a median of 4.8 h (IQR 2.8–6.5, range 0–10.8; 40th percentile: 4.0; 60th percentile: 6.0), and a median of 34.5% (IQR 5–79.1, range 0–100, 71st percentile: 70, 78th percentile: 80) of the nights. Median duration of CPAP follow-up was 5 mo (IQR 3–14, range: 0–248). Median residual AHI was 2, with only 5% of patients having values more than 10 events/h.
Good (+) CPAP compliance, i.e., median hours ≥ 4 and % of nights ≥ 70, was found in 174 (30%) of patients, whereas 414 did not meet criteria for good compliance (−) [missing data: n = 337]. Excellent (+) CPAP compliance, i.e., median hours ≥ 6 and % of nights ≥ 80, was found in 118 (20%) of patients, whereas 474 did not meet criteria for excellent compliance (−) [missing data: n = 333]. Outstanding (+) CPAP compliance, i.e., median hours ≥ 8 and % of nights ≥ 90, was found in 36 (6%) of patients, while 557 did not meet criteria for outstanding compliance (−) [missing data: n = 332] (Figure 2).
Patients with mild OSA used CPAP therapy 34% of nights, with a median of 4.3 h; those with moderate-severe OSA used it 44% of the nights and 4.6 h nightly (differences nonsignificant for the number of hours—p = 0.16 by Tukey-Kramer honest significant difference test, and significant for the percent of nights—p = 0.007 by Wilcoxon/Kruskal-Wallis test). As expected, individuals with more severe sleep-disordered breathing had better adherence to therapy. As such, those with mild OSA met criteria for (+) good, (+) excellent or (+) outstanding compliance in 23%, 13%, and 4.4%, respectively. Patients with moderate-severe OSA met the same criteria in 32%, 22%, and 4.6%, respectively (differences between groups significant only in good and excellent compliance categories, p < 0.04).
There was an interaction between age of the patient and the CPAP compliance: younger patients and those with mild (versus moderate-severe) OSA had poorer compliance (p < 0.004). Not surprisingly, OSA severity correlated directly with the age and the weight of the patients (Table 2).
Table 2.
Metabolic parameters in obstructive sleep apnea versus controls, and mild versus moderate-severe obstructive sleep apnea.
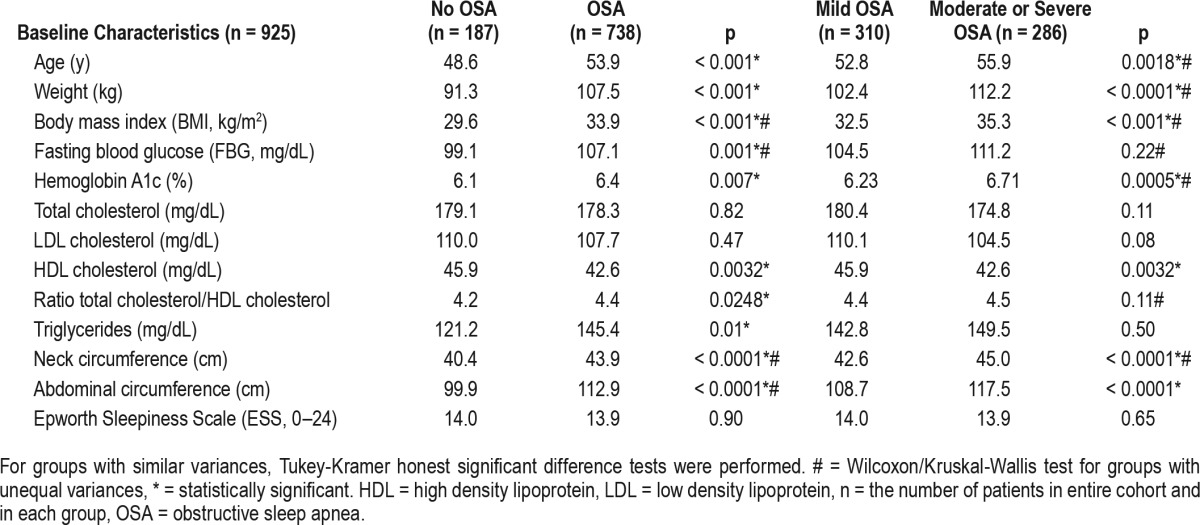
Glucose Metabolism
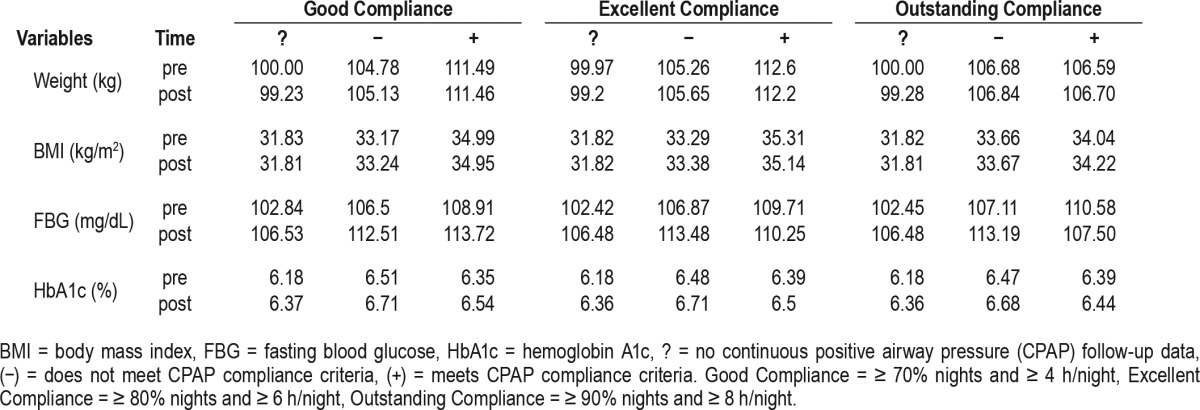
Tables 2 and 3 show baseline metabolic variables in patients without OSA versus OSA, mild versus moderate-severe OSA. Of note, FBG and HbA1c were significantly higher in OSA patients versus non-OSA subjects, both at baseline and at follow-up. While in patients without OSA, FBG and HbA1c did not change significantly over the period of follow-up, they both increased significantly in those with OSA. As seen in Table 4, this happened in parallel with increases in body weight and BMI, in most of the compliance groups or categories.
Table 3.
Main glucose metabolism variables in patients with and without obstructive sleep apnea.
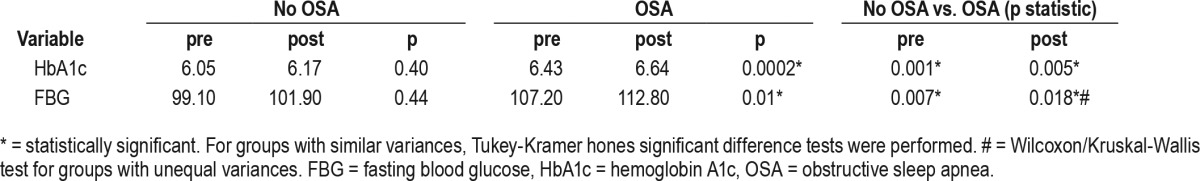
Table 4.
Glucose metabolism parameters, weight, and body mass index in various groups of compliance.
At baseline, mean HbA1c was 6.32% in African-Americans and 6.39% in Caucasians (p = 0.93). Similarly, mean FBG was 104 mg/dL in African Americans and 108 mg/dL in Caucasians (p = 0.55), despite similar mean weights of 104 kg at baseline. These findings alleviated the potential confounding posed by the known fact that HbA1c may be slightly higher in African Americans versus Caucasians for similar blood glucose levels, especially as standard diagnoses of prediabetes and T2DM entail fixed thresholds of 5.7% to 6.4% and 6.5%, respectively.
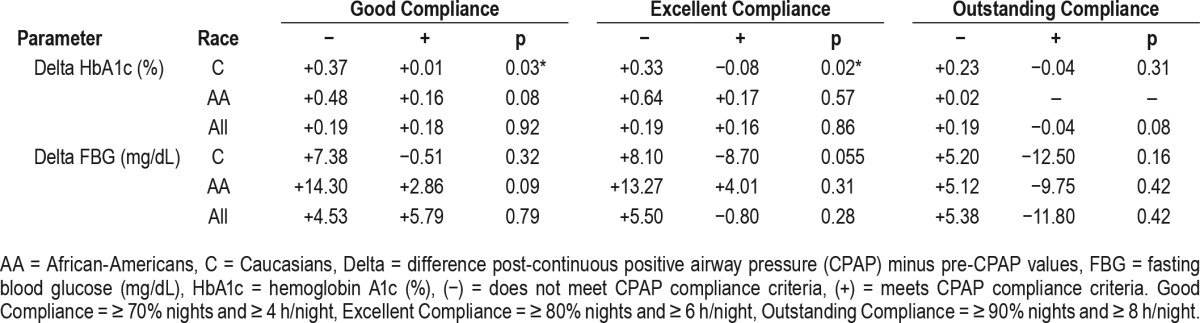
The analyses of post-CPAP minus pre-CPAP values (delta) for FBG and HbA1c in adherent (+) versus nonadherent (−) groups using good, excellent, and outstanding compliance criteria are illustrated in Figure 3 and Table 4. As shown, we found a (nonsignificant) increase in weight in the adherent (+) versus the nonadherent (−) groups for good, excellent, or outstanding compliance. Changes in BMI were also higher in the adherent (+) versus non-adherent (−) groups, but also nonsignificant statistically. During the same time, FBG decreased in the (+) excellent category (nonsignificantly) and in the (+) outstanding compliance category (p = 0.05). The HbA1c decreased only in the (+) outstanding category, with a value of p = 0.08. In multivariate analyses, delta FBG remained significantly lower in adherent (+) outstanding category, even in models that included delta weight or delta BMI (p < 0.05). Interestingly, when the same parameters were analyzed by different racial groups, we found that delta HbA1c was significantly lower in Caucasians who met criteria for (+) good and (+) excellent compliance (p = 0.03 and p = 0.02, respectively), whereas in African-Americans there was only a trend in the same compliance categories (p = 0.08 and p = 0.057, respectively). Table 5 illustrates these changes in HbA1c and FBG by race and different compliance categories.
Figure 3. Change over time (delta) in fasting blood glucose (FBG, mg/dL), hemoglobin A1c (HbA1c, %) and weight (kg) in various compliance groups.

On the X axis, we illustrated the following groups: (?) = no continuous positive airway pressure follow-up, (−) = patients who do not meet the respective compliance category criteria, (+) = patients who meet the respective compliance category criteria. For good compliance criteria (≥ 70% nights and ≥ 4 h), there were 337 subjects in group (?), 414 in group (−) and 174 in group (+). For excellent compliance criteria (≥ 80% nights and ≥ 6 h), there were 333 subjects in group (?), 474 in group (−) and 118 in group (+). For outstanding compliance criteria (≥ 90% nights and ≥ 8 h), there were 332 subjects in group (?), 557 in group (−) and 36 in group (+). NS = not significant (statistically).
Table 5.
Delta hemoglobin A1c and fasting blood glucose versus continuous positive airway pressure compliance categories and main racial groups.
Two parameters were stronger predictors on univariate analyses (baseline neck and abdominal circumferences), but “lost” their significance in multiple regression analyses (data not shown). Several stepwise multiple linear regression models found that changes in BMI, weight, or other variables had no effects on absolute or delta values for HbA1c and FBG. We also assessed for possible confounding from the type of therapy the patients with T2DM received, as well as any changes in anti-diabetic prescriptions over the period of follow-up (28 patients, 3%) and we found no significant result changes.
Lipid Metabolism
During the follow-up, 85 patients (9.1%) had changes in treatment for dyslipidemia; these effects were considered when we analyzed the metabolic parameters before and after CPAP therapy and they did not influence significantly the reported findings. Overall, no significant changes in lipid metabolism parameters were noted after CPAP therapy (data not shown), likely due to the duration of follow-up and/or changes in weight observed.
Incident Diabetes and Prediabetes
Despite the relatively short period of follow-up, we found different rates of new or incident conditions such as new IFG, prediabetes, or diabetes.
Among individuals without T2DM or prediabetes at baseline (“normal” subjects), in approximately 19% of CPAP nonadherent subjects, i.e., with (−) good, (−) excellent, or (−) outstanding compliance IFG developed at follow-up. By contrast, only 15%, 8%, and 5% of those with (+) good, (+) excellent, and (+) outstanding compliance, respectively, had IFG at subsequent testing (Figure 4). In the same “normal” group, in 2% of nonadherent individuals diabetes developed at follow-up. By contrast, 0% was the incidence of T2DM in (+) good, (+) excellent, and (+) outstanding compliance categories (again, possibly due to relatively short follow-up).
Figure 4. Incident impaired fasting glucose.
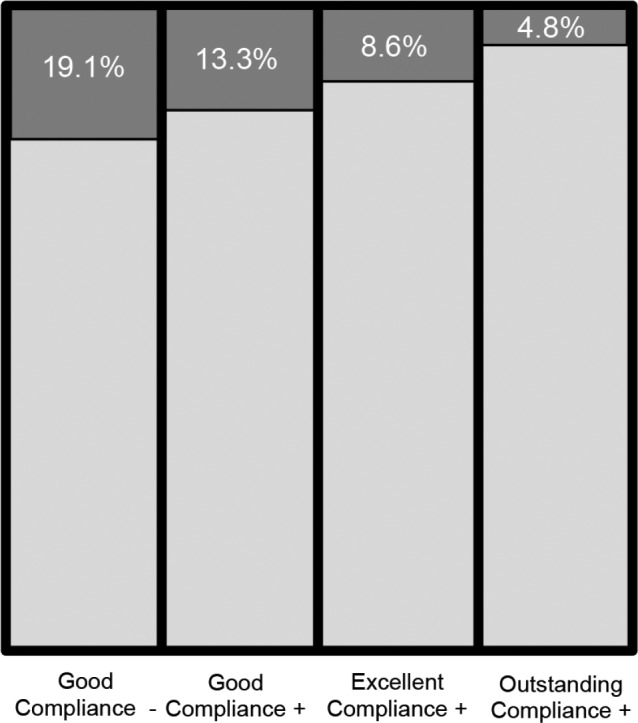
Incident impaired fasting glucose in patients who did not meet criteria for good (−) vs good (+), excellent (+) or outstanding (+) compliance, respectively.
In patients with prediabetes at baseline, in approximately 15% of the nonadherent subjects, i.e., with (−) good, (−) excellent, or (−) outstanding compliance T2DM developed over time. At follow-up in the adherent categories, i.e., (+) good, (+) excellent and (+) outstanding compliance, diabetes developed in 6%, 0%, and 0%, respectively.
No other variables had an effect on these incident conditions, including delta weight and delta BMI.
All these data show that development of T2DM and prediabetes seems to be mitigated in those who meet criteria for excellent or outstanding compliance.
DISCUSSION
This study on mostly obese and overweight patients with OSA shows that CPAP therapy exerts positive metabolic effects, reducing hemoglobin A1c and fasting glucose, but only in those with excellent or outstanding therapeutic adherence. Similarly, the risk of developing impaired fasting glucose and diabetes was reduced by sustained CPAP therapy. Both these findings were not influenced by the slight increase in BMI or weight over the same period of follow-up.
Sleep apnea and cardiometabolic parameters are interconnected by complex relationships.11,29,30 Several mechanisms explaining the connection between glucose dysregulation and OSA have been proposed, including increased catecholamines, elevated sympathetic tone, oxidative stress, intermittent hypoxia,30 elevated cortisol levels, increased inflammatory cytokines, and changes in adipokines.31,32
Multiple clinic-based and community studies showed an association between OSA and insulin resistance, IFG, IGT or overt T2DM.6–10 For example, in a single-center, cross-sectional study of patients with T2DM and HbA1c ≥ 7%, those with intermittent hypoxia had higher HbA1c levels than those without, even after controlling for obesity, age, duration of diabetes, insulin requirement, sleep quality, or depressive mood.30 In a cross-sectional study of 762 patients undergoing sleep studies for OSA, HbA1c was correlated with the AHI and with the 3% oxygen desaturation index in the untreated group, but not in the treated group. In those with treated T2DM, for unclear reasons, the HbA1c was not associated with the sleep variables.33 Among 115 patients with T2DM who underwent sleep studies to evaluate the effect of rapid eye movement (REM) versus non-REM sleep on baseline metabolic variables, the authors found a correlation between REM, AHI, and HbA1c, whereas in non-REM sleep this was not the case.34 This suggests that treating OSA that occurs during REM sleep may have an effect on glycemic control. As such, authors projected that 7 h of CPAP use would be needed to treat 85% of REM sleep. Thus, duration of CPAP use may affect glycemic control by influencing OSA during REM sleep.
Despite this relationship, CPAP therapy has shown so far mixed results in improving glucose metabolism.11–13,21,22
Several studies on individuals without diabetes showed no change in glucose metabolism with CPAP.13,35 In 2013, Yang et al.21 published a meta-analysis of the glycemic effects of CPAP therapy in patients with OSA. They included only prospective observational studies, in adults with moderate or severe OSA, receiving CPAP therapy for more than 2 w. Studies included were published between 2006 and 2010 and used HOMA-IR, as well as FBG and BMI before and after CPAP. Of the 11 final studies analyzed, 2 studies were in patients with diabetes and 9 trials in patients without T2DM. In one of their conclusions, Yang et al. found that 3–24 w of CPAP therapy did not improve FBG values in neither groups (i.e., patients with or without diabetes). Additionally, CPAP therapy led to an improvement in HOMR-IR of 0.55 points versus pretreatment in studies on patients without T2DM at baseline (n = 248 patients). In the two studies on diabetic subjects (n = 39), HOMA-IR reduction was not significant. With the addition of a few more studies not included in the previous meta-analyses,21,36 Iftikhar et al.22 published in 2015 an updated meta-analysis, that confirmed CPAP therapy has a favorable effect on insulin resistance. The pooled estimates of these trials showed a favorable effect of CPAP therapy for 1–12 w on insulin resistance in patients with OSA and without diabetes.
In a more recent and elegant study on patients with prediabetes, CPAP used for 2 w, 8 h nightly (with actual sleep time < 7 h) versus oral placebo improved glucose metabolism significantly, as assessed by both intravenous and oral glucose tolerance test.23
Several observational studies found that CPAP therapy may improve insulin resistance14,15 or hemoglobin A1c,16 whereas others failed to identify significant benefits.17,18,37 To date, there are only a few randomized controlled trials evaluating this relationship and their results are also divergent: several studies12,19,24 found no changes in hemoglobin glycation or insulin sensitivity after 1–6 mo of CPAP therapy, whereas others found insulin sensitivity improved after 2–6 mo of therapy.20,25 A double-blind, placebo-controlled trial on 42 men with diabetes and OSA treated with 3 mo of CPAP versus sham showed no change in HbA1c or euglycemic clamp results. It is interesting to note that the CPAP use was on average < 4 h per night in each group.12 In another study, on 25 patients with diabetes and OSA who were treated with CPAP for 90 days, FBG, HbA1c and continuous glucose monitoring for 72 h were performed at baseline, at 30 days and at 90 days.16 Postprandial glucose excursions were improved after treatment, and in those with HbA1c > 7%, there was significant HbA1c reduction with treatment. Furthermore, in subjects who used CPAP for more than 4 h nightly, the reduction in HbA1c level was significantly correlated with the number of days of CPAP use. There was no such a correlation in subjects who used CPAP therapy for 4 h per night or less.16
Overall, in the existing literature, there is significant heterogeneity in study design, patient selection (patients with diabetes, prediabetes, IFG, IGT, euglycemia, etc), therapeutic measures, and adherence,26 thus limiting our ability to draw unequivocal conclusions.
In our cohort, we found that the overall compliance was affected mainly by the percentage of nights of CPAP usage (only 25% of subjects using it for more than 80% of the nights), whereas the median duration per night was slightly lower than the ones reported in other studies (median 4.8 h, 25% of patients using it for > 6.5 h). When analyzed with the prespecified criteria, we observed very low compliance rates, despite a “near-closed” healthcare system, very structured intake and follow-up, objective smart card and “cloud”-based readings of PAP usage, etc. Although this has been described before in veterans and associated with more prevalent daytime symptoms, higher comorbid load, posttraumatic stress disorder (which may preclude mask acceptance),38 disability claims, administrative issues, etc, these may not be the only explanations. The VAMONOS study included a significantly higher percentage of patients with mild OSA than other studies. As such, our cohort included mild, moderate, and severe OSA in 52%, 30%, and 18%, respectively. If 52% of patients had mild OSA (with an estimated range of 42% to 62% when inputting the cases with missing baseline AHI), poorer CPAP compliance rates may be less surprising, as prior literature showed that adherence to therapy is lower in mild sleep apnea. Additionally, very few studies followed patients on CPAP therapy for more than 6 mo. In a “real life,” point-of-care patient population (i.e., not in the setting of randomized controlled trials), longer follow-up as in our study may be correlated with higher attrition rates. These findings may also be influenced by the fact that our sleep laboratory does not use respiratory effort related arousals for compilation of OSA severity metrics, which could have changed the percentage of patients with mild OSA.
Previous studies and a recent meta-analysis have shown that CPAP therapy may be associated with an increase in body weight and BMI, which may be intriguing in light of the correlations between insulin resistance and weight.39 In our analyses, we were able to confirm these findings, as patients who met more stringent criteria for CPAP compliance had more weight gain than the ones lost to CPAP follow-up or those not meeting criteria (a dose-response effect?). One possible explanation may be that CPAP therapy could mitigate the catabolic effects induced by untreated sleep apnea (e.g., increases in catecholamines, cortisol, and sympathetic activity), thus creating—at least in the short term—an imbalance between catabolic and anabolic processes. In a study by Harsch et al.40 on 40 patients with OSA, insulin sensitivity increased significantly after only 2 days of CPAP therapy; this short-term effect may be due to a reduced sympathetic activity,23 confirming that OSA is an independent risk factor for insulin resistance. The effect of CPAP on insulin sensitivity, while it remained stable at 3 mo, was smaller in obese patients than in nonobese patients, suggesting perhaps that in obese individuals insulin sensitivity is linked mainly to adiposity and to a lesser extent to OSA.40 Our cohort included only 7% normal-weighted individuals, whereas 64% were obese at baseline. Other explanations of how CPAP may lead to weight gain include: CPAP therapy leads to more daytime energy and less sleepiness, allowing perhaps more opportunities to eat, increase exercise and more muscle mass deposition, possible appetite enhancements, etc.
Our study has several strengths: its large size, lack of selection bias (as we included all consecutive patients), ethnic/racial diversity (i.e., better representation of African Americans than in other studies), acceptable period of follow-up (as many other trials span less than 6 mo), objective data for CPAP compliance from smart card and “cloud”-based system downloads, and a “near-closed” system that ensures better clinical and CPAP follow-up.
Our study also has several limitations. First, the patient population is from a single center and represented predominantly by males, sex distribution typical for veterans (only 15% to 20% women). Second, the duration of the study clinic follow-up is still relatively short (median 9, IQR 6–14 mo) in order to detect incident cardiovascular events, prediabetes, or diabetes; nevertheless, we were able to see some trends even during this period of follow-up, especially in more stringent categories of therapeutic adherence. Third, this was a nonrandomized, point-of-care, comparative effectiveness study, patients enrolled in this cohort being consecutive patients from three sleep clinics; although this may carry a referral bias (affecting its generalizability to other populations), it is an important addition to other randomized studies, which possess their own selection and generalizability biases. Fourth, as an observational study, there are several other inherent limitations: no control or sham CPAP group, no data on oral glucose tolerance testing, menopausal status or comorbid polycystic ovary syndrome, missing data points, etc. We also acknowledge that it is conceivable that other interventions, not captured here, such as dietary or exercise interventions, could have contributed. Longer term follow-up and confirmatory analyses are necessary.
CONCLUSIONS
In this comparative effectiveness study of a cohort of mostly obese and overweight patients seen in sleep clinics (VAMONOS study), we found that glucose metabolism parameters are influenced by superior adherence to CPAP therapy, even in the short term. Outstanding and excellent compliance had a superior effect on incident type 2 diabetes mellitus and impaired fasting glucose, despite higher gains in weight over the relatively short period of follow-up. Future interventional studies should control for lifestyle changes such as diet, exercise, nutritional support, etc, so that the glycemic effects attributable to positive airway pressure therapy could be assessed with higher precision and independent of ascertainment bias.
DISCLOSURE STATEMENT
Octavian C. Ioachimescu has received research support from the Department of the Veterans Affairs, GSK, Astrazeneca, Pearl Therapeutics, Cempra, Portola, Cubist, Trius, and Merck. This research support is unrelated to the current article. Disclaimer: The authors who are employees of the Veterans Affairs (OCI, MMC, KMC, MES) acknowledge that this work represents their views alone and not of the Veterans Affairs' or of the United States Federal Government.
ACKNOWLEDGMENTS
The authors thank Robert Havranek and Cianan Lesley (undergraduate students who participated in collection of data); Vidisha Tanukonda and Tiffany Elliott (clinical research coordinators who helped with the regulatory inquiries and submissions). Author contributions: OCI, JAJ, TA, MMC, and KMK researched data; OCI, JAJ, and TC wrote manuscript; MES reviewed data and edited manuscript; OCI analyzed the data.
ABBREVIATIONS
- AA
African-Americans
- AHI
apnea-hypopnea index
- BMI
body mass index
- C
Caucasians
- CPAP
continuous positive airway pressure
- DM
diabetes mellitus
- EDS
excessive daytime sleepiness
- ESS
Epworth Sleepiness Scale
- H2O
water
- HbA1c
hemoglobin A1c
- HDL
high density lipoprotein
- HOMA-IR
homeostatic model assessment of insulin resistance
- IFG
impaired fasting glucose
- IGT
impaired glucose tolerance
- IQR
interquartile range
- LDL
low density lipoprotein
- Nl
normal
- OSA
obstructive sleep apnea
- PAP
positive airway pressure
- PreDM
prediabetes mellitus
- PSG
polysomnography
- P95/P90
95th or 90th percentile
- REM
rapid eye movement
- T2DM
type 2 diabetes mellitus
- VA
Veterans Affairs
- VAMONOS
Veterans Affairs' Metabolism, Obstructed and Non-Obstructed Sleep
REFERENCES
- 1.Peppard PE, Young T, Barnet JH, Palta M, Hagen EW, Hla KM. Increased prevalence of sleep-disordered breathing in adults. Am J Epidemiol. 2013;177(9):1006–1014. doi: 10.1093/aje/kws342. [DOI] [PMC free article] [PubMed] [Google Scholar]
- 2.Smith KB, Smith MS. Obesity statistics. Prim Care. 2016;43(1):121–135. doi: 10.1016/j.pop.2015.10.001. [DOI] [PubMed] [Google Scholar]
- 3.Guariguata L, Whiting DR, Hambleton I, Beagley J, Linnenkamp U, Shaw JE. Global estimates of diabetes prevalence for 2013 and projections for 2035. Diabetes Res Clin Pract. 2014;103(2):137–149. doi: 10.1016/j.diabres.2013.11.002. [DOI] [PubMed] [Google Scholar]
- 4.Nathan DM, Davidson MB, DeFronzo RA, et al. Impaired fasting glucose and impaired glucose tolerance: implications for care. Diabetes Care. 2007;30(3):753–759. doi: 10.2337/dc07-9920. [DOI] [PubMed] [Google Scholar]
- 5.Caspersen CJ, Thomas GD, Beckles GL, Bullard KM. Secular changes in prediabetes indicators among older-adult Americans, 1999-2010. Am J Prev Med. 2015;48(3):253–263. doi: 10.1016/j.amepre.2014.10.004. [DOI] [PMC free article] [PubMed] [Google Scholar]
- 6.Wang X, Bi Y, Zhang Q, Pan F. Obstructive sleep apnoea and the risk of type 2 diabetes: a meta-analysis of prospective cohort studies. Respirology. 2013;18(1):140–146. doi: 10.1111/j.1440-1843.2012.02267.x. [DOI] [PubMed] [Google Scholar]
- 7.Ip MS, Lam B, Ng MM, Lam WK, Tsang KW, Lam KS. Obstructive sleep apnea is independently associated with insulin resistance. Am J Respir Crit Care Med. 2002;165(5):670–676. doi: 10.1164/ajrccm.165.5.2103001. [DOI] [PubMed] [Google Scholar]
- 8.Punjabi NM, Beamer BA. Alterations in glucose disposal in sleep-disordered breathing. Am J Respir Crit Care Med. 2009;179(3):235–240. doi: 10.1164/rccm.200809-1392OC. [DOI] [PMC free article] [PubMed] [Google Scholar]
- 9.Kent BD, Grote L, Ryan S, et al. Diabetes mellitus prevalence and control in sleep-disordered breathing: the European Sleep Apnea Cohort (ESADA) study. Chest. 2014;146(4):982–990. doi: 10.1378/chest.13-2403. [DOI] [PubMed] [Google Scholar]
- 10.Foster GD, Sanders MH, Millman R, et al. Obstructive sleep apnea among obese patients with type 2 diabetes. Diabetes Care. 2009;32(6):1017–1019. doi: 10.2337/dc08-1776. [DOI] [PMC free article] [PubMed] [Google Scholar]
- 11.Schlatzer C, Schwarz EI, Kohler M. The effect of continuous positive airway pressure on metabolic variables in patients with obstructive sleep apnoea. Chronic Respir Dis. 2014;11(1):41–52. doi: 10.1177/1479972313516882. [DOI] [PubMed] [Google Scholar]
- 12.West SD, Nicoll DJ, Wallace TM, Matthews DR, Stradling JR. Effect of CPAP on insulin resistance and HbA1c in men with obstructive sleep apnoea and type 2 diabetes. Thorax. 2007;62(11):969–974. doi: 10.1136/thx.2006.074351. [DOI] [PMC free article] [PubMed] [Google Scholar]
- 13.Coughlin SR, Mawdsley L, Mugarza JA, Wilding JP, Calverley PM. Cardiovascular and metabolic effects of CPAP in obese males with OSA. Eur Respir J. 2007;29(4):720–727. doi: 10.1183/09031936.00043306. [DOI] [PubMed] [Google Scholar]
- 14.Brooks B, Cistulli PA, Borkman M, et al. Obstructive sleep apnea in obese noninsulin-dependent diabetic patients: effect of continuous positive airway pressure treatment on insulin responsiveness. J Clin Endocrinol Metab. 1994;79(6):1681–1685. doi: 10.1210/jcem.79.6.7989475. [DOI] [PubMed] [Google Scholar]
- 15.Hassaballa HA, Tulaimat A, Herdegen JJ, Mokhlesi B. The effect of continuous positive airway pressure treatment on glucose control in diabetic patients with severe obstructive sleep apnea. Sleep Breath. 2005;9(4):176–180. doi: 10.1007/s11325-005-0033-y. [DOI] [PubMed] [Google Scholar]
- 16.Babu AR, Herdegen J, Fogelfeld L, Shott S, Mazzone T. Type 2 diabetes, glycemic control, and continuous positive airway pressure in obstructive sleep apnea. Arch Intern Med. 2005;165(4):447–452. doi: 10.1001/archinte.165.4.447. [DOI] [PubMed] [Google Scholar]
- 17.Harsch IA, Schahin SP, Bruckner K, et al. The effect of continuous positive airway pressure treatment on insulin sensitivity in patients with obstructive sleep apnoea syndrome and type 2 diabetes. Respir Int Rev Thorac Dis. 2004;71(3):252–259. doi: 10.1159/000077423. [DOI] [PubMed] [Google Scholar]
- 18.Myhill PC, Davis WA, Peters KE, Chubb SA, Hillman D, Davis TM. Effect of continuous positive airway pressure therapy on cardiovascular risk factors in patients with type 2 diabetes and obstructive sleep apnea. J Clin Endocrinol Metab. 2012;97(11):4212–4218. doi: 10.1210/jc.2012-2107. [DOI] [PubMed] [Google Scholar]
- 19.Comondore VR, Cheema R, Fox J, et al. The impact of CPAP on cardiovascular biomarkers in minimally symptomatic patients with obstructive sleep apnea: a pilot feasibility randomized crossover trial. Lung. 2009;187(1):17–22. doi: 10.1007/s00408-008-9115-5. [DOI] [PubMed] [Google Scholar]
- 20.Weinstock TG, Wang X, Rueschman M, et al. A controlled trial of CPAP therapy on metabolic control in individuals with impaired glucose tolerance and sleep apnea. Sleep. 2012;35(5):617–625. doi: 10.5665/sleep.1816. [DOI] [PMC free article] [PubMed] [Google Scholar]
- 21.Yang D, Liu Z, Yang H, Luo Q. Effects of continuous positive airway pressure on glycemic control and insulin resistance in patients with obstructive sleep apnea: a meta-analysis. Sleep Breath. 2013;17(1):33–38. doi: 10.1007/s11325-012-0680-8. [DOI] [PubMed] [Google Scholar]
- 22.Iftikhar IH, Hoyos CM, Phillips CL, Magalang UJ. Meta-analyses of the association of sleep apnea with insulin resistance, and the effects of CPAP on HOMA-IR, adiponectin, and visceral adipose fat. J Clin Sleep Med. 2015;11(4):475–485. doi: 10.5664/jcsm.4610. [DOI] [PMC free article] [PubMed] [Google Scholar]
- 23.Pamidi S, Wroblewski K, Stepien M, et al. Eight hours of nightly continuous positive airway pressure treatment of obstructive sleep apnea improves glucose metabolism in patients with prediabetes. A randomized controlled trial. Am J Respir Crit Care Med. 2015;192(1):96–105. doi: 10.1164/rccm.201408-1564OC. [DOI] [PMC free article] [PubMed] [Google Scholar]
- 24.Shaw JE, Punjabi NM, Naughton MT, et al. The effect of treatment of obstructive sleep apnea on glycemic control in type 2 diabetes. Am J Respir Crit Care Med. 2016;194(4):486–492. doi: 10.1164/rccm.201511-2260OC. [DOI] [PubMed] [Google Scholar]
- 25.Martinez-Ceron E, Fernandez-Navarro I, Garcia-Rio F. Effects of continuous positive airway pressure treatment on glucose metabolism in patients with obstructive sleep apnea. Sleep Med Rev. 2016;25:121–130. doi: 10.1016/j.smrv.2015.03.002. [DOI] [PubMed] [Google Scholar]
- 26.Sawyer AM, Gooneratne NS, Marcus CL, Ofer D, Richards KC, Weaver TE. A systematic review of CPAP adherence across age groups: clinical and empiric insights for developing CPAP adherence interventions. Sleep Med Rev. 2011;15(6):343–356. doi: 10.1016/j.smrv.2011.01.003. [DOI] [PMC free article] [PubMed] [Google Scholar]
- 27.Berry RB, Budhiraja R, Gottlieb DJ, et al. Rules for scoring respiratory events in sleep: update of the 2007 AASM Manual for the Scoring of Sleep and Associated Events. Deliberations of the Sleep Apnea Definitions Task Force of the American Academy of Sleep Medicine. J Clin Sleep Med. 2012;8(5):597–619. doi: 10.5664/jcsm.2172. [DOI] [PMC free article] [PubMed] [Google Scholar]
- 28.Ioachimescu OC, Anthony J, Constantin T, Sweeney ME. Effect of CPAP on cardio-metabolic parameters in 925 veterans seen in sleep clinics Abstract and oral communication presented at: CHEST Annual Meeting 2015 International Meeting of the American College of Chest Physicians; October 25-28, 2015; Montreal, Canada. [Google Scholar]
- 29.West SD, Nicoll DJ, Stradling JR. Prevalence of obstructive sleep apnoea in men with type 2 diabetes. Thorax. 2006;61(11):945–950. doi: 10.1136/thx.2005.057745. [DOI] [PMC free article] [PubMed] [Google Scholar]
- 30.Torrella M, Castells I, Gimenez-Perez G, et al. Intermittent hypoxia is an independent marker of poorer glycaemic control in patients with uncontrolled type 2 diabetes. Diabetes Metab. 2015;41(4):312–318. doi: 10.1016/j.diabet.2015.01.002. [DOI] [PubMed] [Google Scholar]
- 31.Briancon-Marjollet A, Weiszenstein M, Henri M, Thomas A, Godin-Ribuot D, Polak J. The impact of sleep disorders on glucose metabolism: endocrine and molecular mechanisms. Diabetol Metab Syndr. 2015;7:25. doi: 10.1186/s13098-015-0018-3. [DOI] [PMC free article] [PubMed] [Google Scholar]
- 32.Pillar G, Shehadeh N. Abdominal fat and sleep apnea: the chicken or the egg? Diabetes Care. 2008;31(Suppl 2):S303–S309. doi: 10.2337/dc08-0715. [DOI] [PMC free article] [PubMed] [Google Scholar]
- 33.Priou P, Le Vaillant M, Meslier N, et al. Association between obstructive sleep apnea severity and glucose control in patients with untreated versus treated diabetes. J Sleep Res. 2015;24(4):425–431. doi: 10.1111/jsr.12278. [DOI] [PubMed] [Google Scholar]
- 34.Grimaldi D, Beccuti G, Touma C, Van Cauter E, Mokhlesi B. Association of obstructive sleep apnea in rapid eye movement sleep with reduced glycemic control in type 2 diabetes: therapeutic implications. Diabetes Care. 2014;37(2):355–363. doi: 10.2337/dc13-0933. [DOI] [PMC free article] [PubMed] [Google Scholar]
- 35.Hoyos CM, Killick R, Yee BJ, Phillips CL, Grunstein RR, Liu PY. Cardiometabolic changes after continuous positive airway pressure for obstructive sleep apnoea: a randomised sham-controlled study. Thorax. 2012;67(12):1081–1089. doi: 10.1136/thoraxjnl-2011-201420. [DOI] [PubMed] [Google Scholar]
- 36.Hecht L, Mohler R, Meyer G. Effects of CPAP-respiration on markers of glucose metabolism in patients with obstructive sleep apnoea syndrome: a systematic review and meta-analysis. Ger Med Sci. 2011;9:Doc20. doi: 10.3205/000143. [DOI] [PMC free article] [PubMed] [Google Scholar]
- 37.Dawson A, Abel SL, Loving RT, et al. CPAP therapy of obstructive sleep apnea in type 2 diabetics improves glycemic control during sleep. J Clin Sleep Med. 2008;4(6):538–542. [PMC free article] [PubMed] [Google Scholar]
- 38.El-Solh AA, Ayyar L, Akinnusi M, Relia S, Akinnusi O. Positive airway pressure adherence in veterans with posttraumatic stress disorder. Sleep. 2010;33(11):1495–1500. doi: 10.1093/sleep/33.11.1495. [DOI] [PMC free article] [PubMed] [Google Scholar]
- 39.Drager LF, Brunoni AR, Jenner R, Lorenzi-Filho G, Bensenor IM, Lotufo PA. Effects of CPAP on body weight in patients with obstructive sleep apnoea: a meta-analysis of randomised trials. Thorax. 2015;70(3):258–264. doi: 10.1136/thoraxjnl-2014-205361. [DOI] [PubMed] [Google Scholar]
- 40.Harsch IA, Schahin SP, Radespiel-Troger M, et al. Continuous positive airway pressure treatment rapidly improves insulin sensitivity in patients with obstructive sleep apnea syndrome. Am J Respir Crit Care Med. 2004;169(2):156–162. doi: 10.1164/rccm.200302-206OC. [DOI] [PubMed] [Google Scholar]