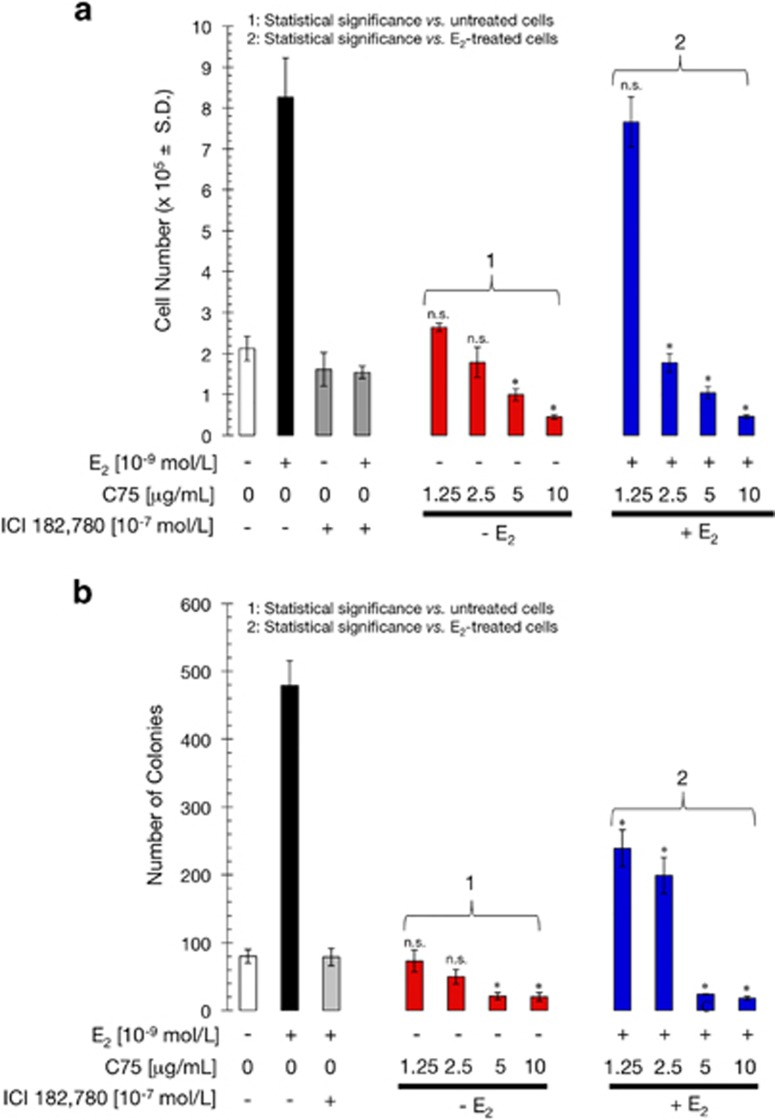
Figure 5.
FASN inhibition blocks E2-stimulated cell growth and survival. (a) E2-depleted MCF-7 cells were plated in 24-well plates at 10 000 cells/well in phenol red-free IMEM and 5% CCS containing E2 (10−9 mol/l), ICI 182 780 (10−7 mol/l), C75 (1.25–10 μg/ml), or combinations of these compounds as specified, and ethanol (v/v) or DMSO (v/v) vehicles alone. The data presented are mean of number cells × 104/well (columns)±s.d. (bars) after 6 days of treatment. All assays were performed at least three times in triplicate. (b) E2-depleted MCF-7 cells were plated in soft agarose containing E2 (10−9 mol/l), ICI 182 780 (10−7 mol/l), C75 (1.25–10 μg/ml), and ethanol (v/v) or DMSO (v/v) vehicles alone for 7–10 days. Colony formation (⩾50 μm) was assessed using a colony counter. Each experimental value represents the mean colony number (columns)±s.d. (bars) from at least three separate experiments in which triplicate dishes were counted. Non-significant (NS) differences (P>0.05) were identified by ANOVA followed by Scheffé's multiple contrasts; *P<0.05 compared with control cells by ANOVA followed by Scheffé's multiple contrasts. (1) Control cells in culture medium only. (2) Control cells in medium supplemented with 10−9 mol/l E2.

