Abstract
Despite high-hyperdiploid acute lymphoblastic leukaemia (HD-ALL) being the most common subgroup of paediatric ALL, its aetiology remains unknown. Genome-wide association studies have demonstrated association at 10q21.2. Here, we sought to determine how this region influences HD-ALL risk. We impute genotypes across the locus, finding the single nucleotide polymorphism rs7090445 highly associated with HD-ALL (P=1.54 × 10−38), and residing in a predicted enhancer element. We show this region physically interacts with the transcription start site of ARID5B, that alleles of rs7090445 have differential enhancer activity and influence RUNX3 binding. RUNX3 knock-down reduces ARID5B expression and rs7090445 enhancer activity. Individuals carrying the rs7090445-C risk allele also have reduced ARID5B expression. Finally, the rs7090445-C risk allele is preferentially retained in HD-ALL blasts consistent with inherited genetic variation contributing to arrest of normal lymphocyte development, facilitating leukaemic clonal expansion. These data provide evidence for a biological mechanism underlying hereditary risk of HD-ALL at 10q21.2.
Risk for the paediatric cancer high-hyperdiploid acute lymphoblastic leukaemia (HD-ALL) has been associated with genetic variants at 10q21.2. Here, the authors characterize this region, establishing a single risk variant and showing its role in dysregulated expression of ARID5B.
Acute lymphoblastic leukaemia (ALL) is the most common childhood malignancy. Twenty to twenty-five per cent of ALL is characterized by high-hyperdiploidy (51–67 chromosomes), making high-hyperdiploid ALL (HD-ALL) one of the major subgroups of paediatric cancer1. A characteristic genetic feature of HD-ALL is the non-random gain of chromosomes X, 4, 6, 10, 14, 17, 18 and 21, with individual trisomies or tetrasomies seen in over 75% of cases2. High-hyperdiploidy is almost exclusively observed in the context of paediatric precursor B-cell ALL, with a peak incidence at 4 years of age2, and has a more favourable outcome than other forms of B-cell ALL (ref. 3). The aetiology of HD-ALL remains unknown, however several lines of evidence are consistent with the initiating transforming event occurring in utero4,5,6, suggesting additional secondary events are required to trigger clonal expansion and the development of overt disease.
Subsequent clonal expansion is likely to be influenced by both inherited genetic susceptibility, and as yet unidentified environmental risk factors. A number of genetic disorders are associated with an increased risk of ALL including Down’s syndrome7 and ataxia telangiectasia8. However, even collectively these account for only a small proportion of ALL (ref. 9) and analyses of risk in siblings of cases suggest that common genetic variation contributes to disease susceptibility10.
Recently, independent genome-wide association studies (GWAS) demonstrated robust association at a locus in the gene AT rich interactive domain 5B (ARID5B) at 10q21.2 (refs 11, 12). Variation at this locus is primarily associated with HD-ALL (refs 11, 12), having no impact on the risk of ETV6/RUNX1 translocation positive ALL. Currently it is unclear how 10q21.2 influences the risk of developing HD-ALL. Elucidating the function of this risk locus is therefore an important step towards the development of testable hypotheses regarding the biological processes involved in the pathogenesis of HD-ALL.
Here, we sought to identify the causal polymorphism(s) driving the 10q21.2 genetic association with ALL susceptibility as a basis for understanding HD-ALL initiation and addiction mechanisms. We identify a potential mechanism contributing to the additional risk to ALL conferred by 10q21.2. Variation at rs7090445 disrupts RUNX3 binding and via a looping interaction reduces the expression of ARID5B. Consistent with rs7090445 contributing to ALL leukaemic blasts with the C-risk allele have reduced ARID5B expression and preferentially duplicate the copy of chromosome 10 harbouring this variant.
Results
Fine mapping and epigenomic profiling of the 10q21.2 locus
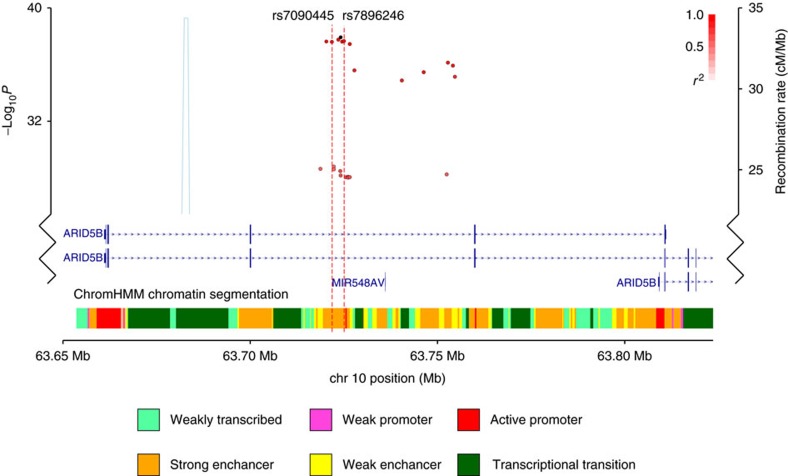
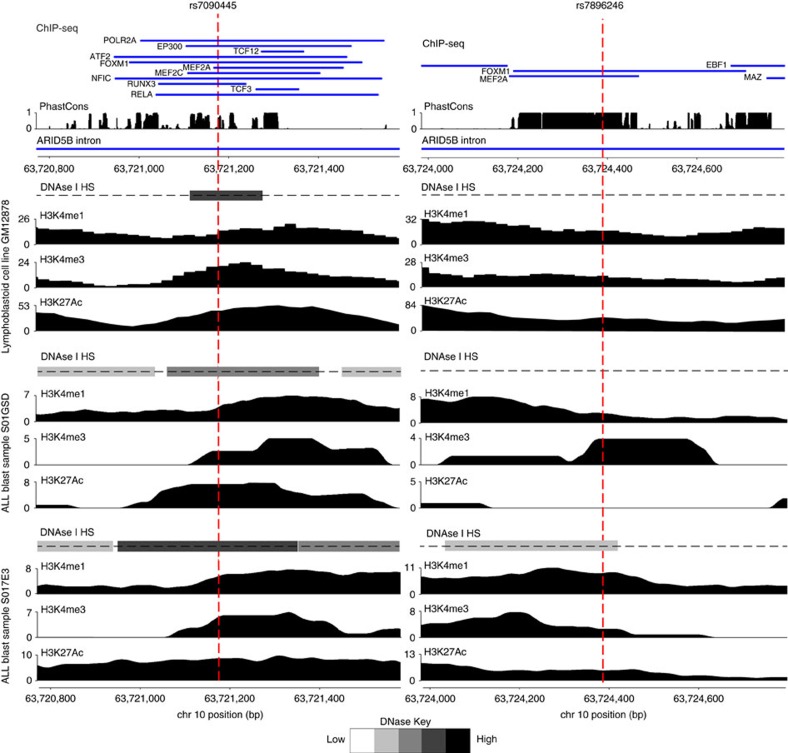
We first fine mapped the 10q21.2 risk locus by imputation using UK10K and 1000 Genomes Project as reference and data from two GWAS data sets totalling 465 HD-ALL cases, both previously reported13. Supplementary Table 7 details whether SNPs in the 10q21 risk loci were directly genotyped or imputed. This identified eight SNPs with minor allele frequency (MAF) >0.01, an association P<1.0 × 10⁻³⁵ (fixed-effects meta-analysis of logistic regression P value) and an odds ratio of >2.4 at 10q21.2 in HD-ALL (Fig. 1, Supplementary Table 8). All eight SNPs localize to intron three of ARID5B and are in strong linkage disequilibrium (LD) defining a single risk haplotype (LD to the lead SNP rs10821936 r2=0.88–1.00; Supplementary Table 8 and Supplementary Fig. 1). We further prioritized associated variants by assessing their regulatory potential inferred through B-cell specific DNase I hypersensitivity mapping and chromatin immunoprecipitation sequencing (ChIP-seq) experiments in the lymphoblastoid cell line (LCL) GM12878 and ALL blasts from the ENCODE14 and Blueprint15 projects respectively (Fig. 2, Supplementary Tables 9 and 10). These data highlighted SNPs rs7896246 and rs7090445 (logistic regression P values 1.36 × 10−38 and 1.54 × 10−38, respectively) as plausible functional SNPs based on their putative enhancer characteristics, defined by relevant histone markers (H3K27ac, H3K4me1 and H3K4me3), transcription factor binding, DNase I hypersensitivity and sequence conservation (Fig. 2; Supplementary Fig. 1).
Figure 1. Genetic mapping and overall epigenetic landscape of the 10q21 HD-ALL risk locus.
The region of association maps to an 8 kb haplotype block within intron 3 of ARID5B. SNPs (dots) are shown based on their chromosomal position (GRCh37/hg19 human genome build) on the x axis and −log10 association P-value in HD-ALL on the y axis. Colour intensity of each SNP reflects the extent of linkage disequilibrium (white r2=0 to dark red r2=1) with the lead SNP, rs10821936 (shown in black). Recombination rates, estimated using 1,000 genomes and UK10K samples of European ancestry, are shown by a light blue line. Gene positions and chromatin state segmentation (ChromHMM) in GM12878 from ENCODE project data are shown. Also annotated are the candidate functional SNPs rs7090445 and rs7896246, red dotted lines.
Figure 2. Epigenetic profiles surrounding the 10q21 SNPs rs7090445 and rs7896346.
Transcription factor ChIP-seq from GM12878 (blue bars) is shown in the upper panel, annotated with the ChIP’d TF name. Evolutionary conservation quantified by PhastCons score, shown below. ChIP-seq data for H3K4Me1, H3K4Me3 and H3K27Ac histone modifications and DNaseI hypersensitivity (DNASe I HS) for the lymphoblastoid cell line GM12878 from ENCODE and for ALL blasts from the Blueprint Project. Extent of DNaseI hypersensitivity based on normalized DNAse-seq data from respective cells. Base pair positions are from GRCh37/Hg19. Figures were generated in visPIG (ref. 37).
rs7090445, rs7896246 and ARID5B expression
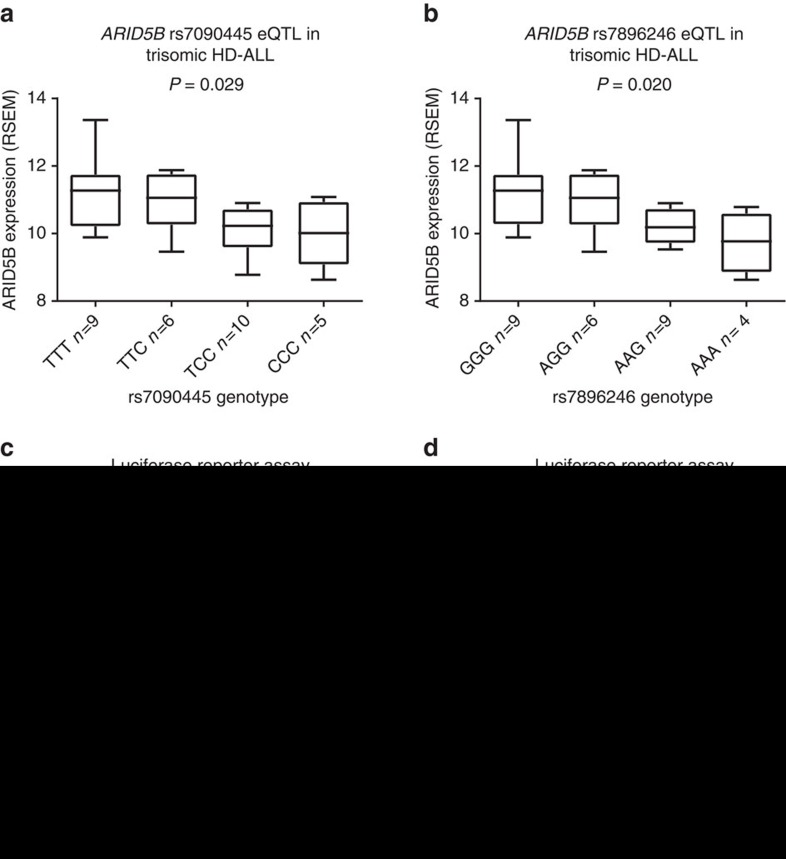
We next examined if the genotypes of rs7090445 or rs7896246 were associated with ARID5B expression. Gene expression was quantified from RNA-sequencing data in 45 HD-ALL cases, of which the majority, 30 (65%), were trisomic for chromosome 10, consistent with previous findings2. To control for gene dosage we restricted our expression quantitative trait locus (eQTL) analysis to these trisomic blasts. Genotypes of both rs7090445 and rs7896246 were associated with ARID5B expression, with the rs7090445-C and rs7896246-A risk alleles associated with reduced expression (ANOVA P=0.029 and P=0.020, respectively, Fig. 3a,b). The risk alleles of rs7090445 and rs7896246 were also associated with reduced ARID5B expression in disomic cases, albeit non-significantly (Supplementary Fig. 2). Following this we tested for an eQTL with RTKN2 and C10orf107 which map within a 500 kb window of rs7090445 and rs7896246. No eQTL was detected for RTKN2 (P>0.05) (Supplementary Fig. 3), and C10orf107 was not expressed.
Figure 3. rs7090445 is associated with lower ARID5B expression and reduced enhancer activity.
Expression quantitative trait loci (eQTL) analysis performed in HD-ALL trisomic for chromosome 10 for (a) rs7090445 and (b) rs7896246. Difference in RNA sequencing of ARID5B expression (RSEM) assessed by ANOVA test. rs7090445-C and rs7896246-A risk alleles show decreased expression over the protective allele. Allele-specific constructs containing the 818bp putative regulatory sequence flanking rs7090445 were cloned into the pGL3-promoter luciferase reporter vector and transfected into (c) REH and (d) SEM cell lines. The ratio of luminescence from the experimental pGL3-rs7090445 constructs to the Renilla internal control, pRL-SV40, normalized to the empty pGL3-SV40 promoter vector. Data shown are mean±s.e.m. from six independent experiments performed in triplicate. Difference in gene expression assessed by Student’s T-test. Luciferase data were normally distributed. The rs7090445-C risk allele has significantly decreased enhancer activity over the protective allele.
rs7090445 genotype influences enhancer activity
To measure the effect of rs7090445 and rs7896246 alleles on enhancer activity we performed luciferase reporter assays in MHH-CALL2 and SEM BCP ALL cell lines. Transfection with constructs containing the rs7090445 risk C-risk allele displayed significantly lower normalized luminescence compared to non-risk T-allele constructs (Two-tail t-test P=0.008 and P=0.028, Fig. 3c,d, respectively). rs7896246 genotype did not impact on enhancer activity (Supplementary Fig. 4a,b). These data are thus consistent with a model of HD-ALL risk in which variation at rs7090445 is associated with decreased expression of ARID5B.
rs7090445 modulates RUNX3 binding affinity
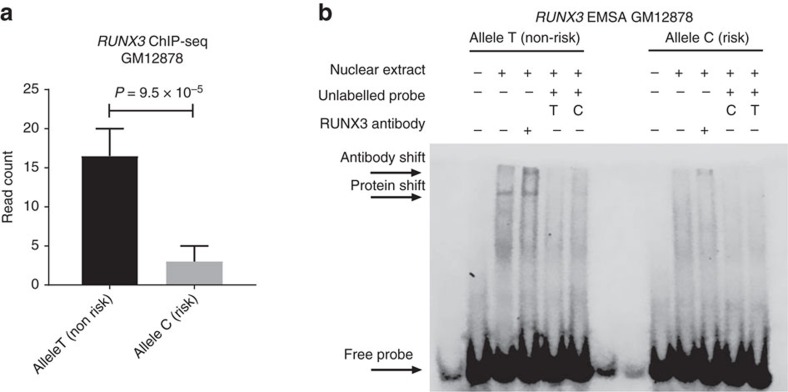
We next interrogated GM12878 Encode ChIP-seq data to identify differential transcription factor (TF) binding for alleles of rs7896246 and rs7090445. Reads mapping to each SNP allele from experiments were mapped and enumerated (Supplementary Table 9). Only RUNX3 at rs7090445 displayed a significant read bias, with a 1.7-fold excess of reads mapping to the non-risk T allele (Weighted Fisher’s combined binomial P<0.001, Fig. 4a). To exclude the possibility this observation was a consequence of copy number or other local cis variation we analysed whole genome sequencing data from the same cell line finding no evidence of allelic read bias (Binomial P=1.0) or any other genetic variation 250 bps upstream or downstream of rs7090445, sequencing coverage within this interval was at least 45X. To verify that RUNX3 also binds to rs7090445 in MHH-CALL2 we performed ChIP-qPCR; enrichment for rs7090445 was observed relative to IgG isotype controls, consistent with differential RUNX3 binding driving allele specific enhancer activity (Supplementary Fig. 5). We examined the possibility that variation at rs7090445 disrupts overlapping motifs using in silico data from HaploReg v4.1 (ref. 16) in conjunction with ENCODE data. While motifs for CUX1, HOXD8 and MEF2A were possibly disrupted by variation at rs7090445 the surrounding loci contains mismatches at high stringency bases for each TF and ENCODE data provided no evidence for CUX1 or MEF2A binding (Supplementary Table 9; Supplementary Fig. 6). To further examine the influence of rs7090445 genotype on function we performed an EMSA in GM12878. Nuclear protein bound to the non-risk T allele of rs7090445 with greater affinity than the risk C allele. The addition of an anti-RUNX3 antibody resulted in a supershift suggesting RUNX3 is a component of this complex (Fig. 4b). Hence while rs7090445 does not overlap with a predicted RUNX3 binding motif, this is a common feature of ChIP-seq data, and suggests RUNX3 may bind cooperatively with as yet unidentified additional factors17,18,19.
Figure 4. The rs7090445 risk allele disrupts RUNX3 binding.
(a) ENCODE ChIP-seq data from the rs7090445 heterozygote lymphoblastoid cell line GM12878. Mean read counts for each allele were combined from replicates, error bars show SEM. Meta P value calculated using Fisher’s method combining binomial test P values. (b) Electromobility shift assay (EMSA) in GM12878 showing differential nuclear protein binding to alleles of rs7090445. Increased protein binding observed for the non-risk T allele was shifted by the addition of a RUNX3 antibody. An uncropped EMSA gel image is provided in Supplementary Fig. 9.
rs7090445 risk region interacts with the ARID5B promoter
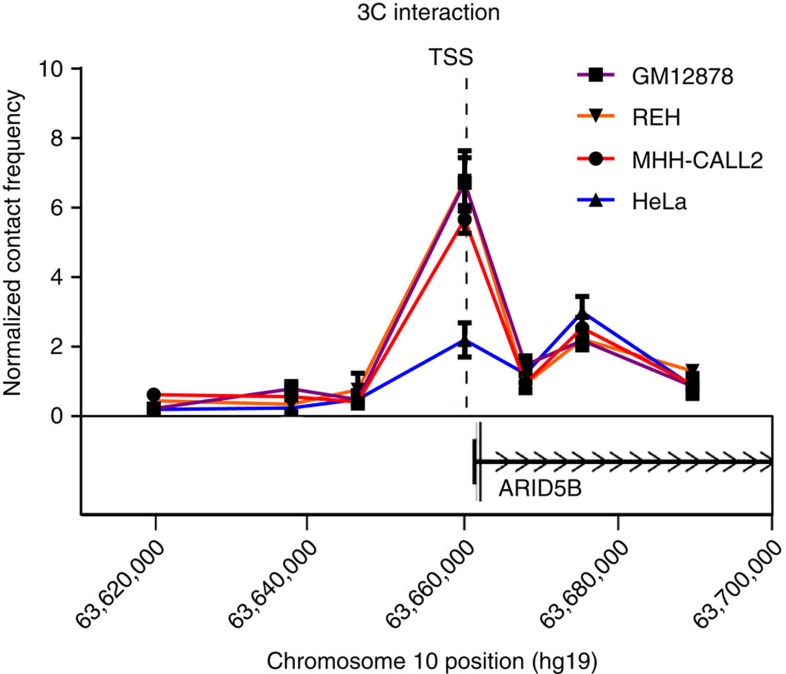
Various lines of evidence indicate that chromatin looping interactions formed between enhancer elements and gene promoters map within distinct chromosomal topological associating domains (TADs). To examine the TAD structure of the 10q21 rs7090445 region and identify local chromatin patterns, we analysed publicly accessible Hi-C GM12878 data20 as a source of B-cell information (Supplementary Fig. 7a). These data demonstrated the transcription start site (TSS) of ARID5B and the rs7090445 risk region map within a single TAD (Supplementary Fig. 7a). Furthermore, accepting the caveat of 5 kb resolution of the Hi-C data, within this TAD the most highly enriched contact of the rs7090445 risk region is with the TSS of ARID5B, which showed a 2.7-fold enrichment over expected levels (Supplementary Fig. 7b), consistent with a looping interaction between these regulatory elements. Following from this observation we performed 3C-qPCR in REH and MHH-CALL2 ALL cell lines, GM12878 and HeLa cells to determine chromatin looping interaction between the genomic region encompassing rs7090445 and the ARID5B promoter. From 3C-qPCR we demonstrated that rs7090445 forms chromatin looping interaction with the TSS of ARID5B in cells of B-cell lineage but not in HeLa cells (Fig. 5). Collectively these data suggest a mechanism by which RUNX3-bound rs7090445 regulates ARID5B expression in a tissue-specific manner. The genotype of rs7090445 did not affect the contract frequency between these two loci (Supplementary Table 11).
Figure 5. 3C interaction plot of rs7090445 with the ARID5B promoter.
Physical map of 10q21 showing the relative interaction frequencies calculated from the abundance of ligation products formed between the constant fragment, containing rs7090445, and each of the target fragments (ARID5B promoter fragment or surrounding genomic intervals). Data shows mean qPCR abundance ±s.e.m., normalized to the abundance of inter-site control region. The assay was performed independently four times for GM12878, REH and HeLa, and three times for MHH-CALL2. GM12878, MHH-CALL2 and REH show a significant increase in the contact frequency between rs7090445 and ARID5B TSS compared to both HeLa and cell specific back ground levels, Students t-test P<0.05 two sided.
RUNX3 regulates ARID5B expression
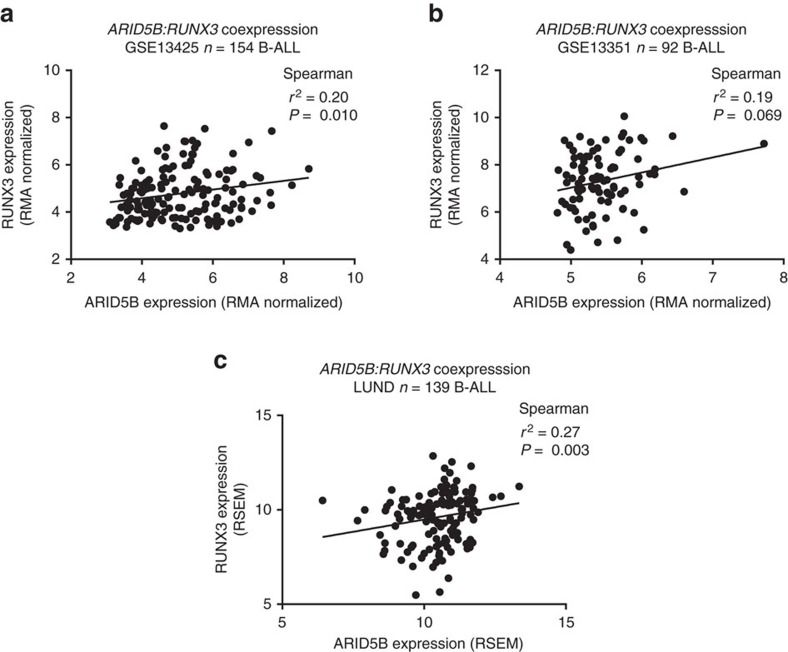
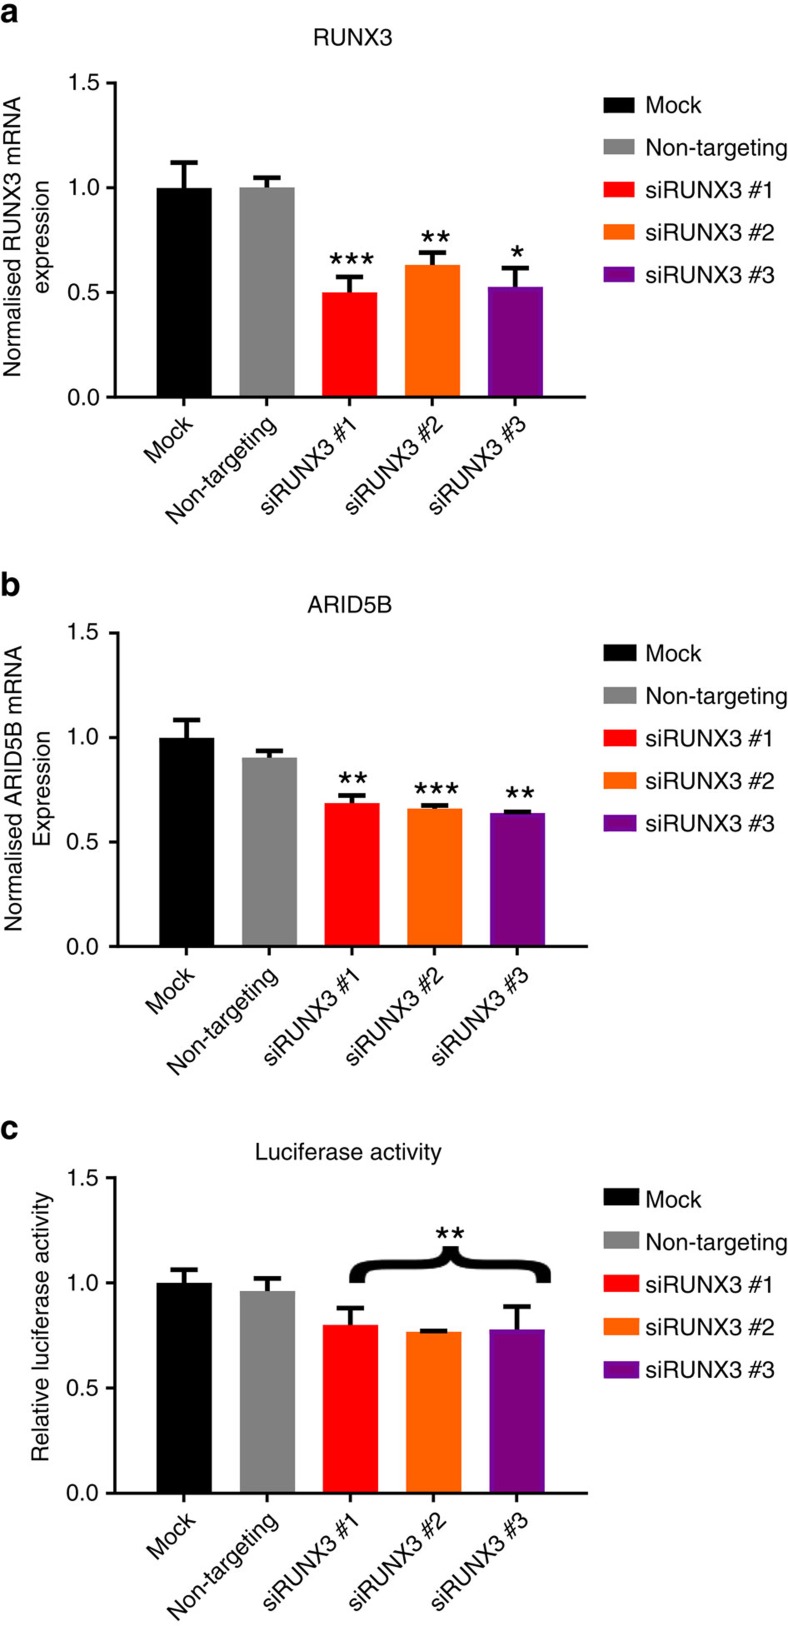
To support a role for RUNX3 in ARID5B regulation we analysed tumour gene expression data from three cohorts of paediatric B-ALL totalling 385 cases (GSE13425, GSE13351 (ref. 21) and LUND (ref. 22) data sets). In each series ARID5B and RUNX3 expression were positively correlated (Fig. 6; Weighted Fisher’s combined Spearman’s P=5.6 × 10⁻⁵). While a consistent association was shown between ARID5B and RUNX3 gene expression in HD-ALL the small size of these subsets of the data may have precluded demonstration of a statistically significant relationship. No consistent correlation between ARID5B and RUNX3 was observed in ETV6/RUNX1 positive ALL (Supplementary Fig. 8). To establish a direct relationship between RUNX3 and ARID5B expression we conducted small interfering RNA (siRNA) experiments. Since transfection efficiency was found to be poor in MHH-CALL2 cells, siRNA RUNX3 knockdown was performed in GM11832 (homozygous for rs7090445 T). We also confirmed that RUNX3 binds to rs7090445 in GM11832 by ChIP-qRT (Supplementary Fig. 5). Knockdown of RUNX3 was accompanied by a significant reduction in ARID5B messenger RNA (mRNA) (Two-tailed t-test P=2.4 × 10⁻³, P=7.0 × 10⁻⁴, P=1.2 × 10⁻³; RUNX3 siRNAs 1, 2 and 3, respectively: Fig. 7b). If RUNX3 contributes to the allele specificity of the rs7090445 reporter assay its depletion should be reflected in reduced luciferase activity. Cells depleted for RUNX3, by siRNA, were subsequently transfected with the high activity rs7090445 T-allele pGL3 vector construct. RUNX3 knockdown was also accompanied by reduced luciferase activity (Fig. 7c).
Figure 6. RUNX3 and ARID5B expression are correlated in B-cell precursor ALL.
Expression of ARID5B and RUNX3 was examined in the BCP-ALL expression data sets (a) GSE13425, (b) GSE13351 and (c) LUND (ref. 22). Lines show linear regression fits. Expression correlation was assessed by Spearman’s r2 and P value test. Combined RUNX3:ARID5B correlation P value 5.6 × 10⁻⁵ (weighted Fisher’s method).
Figure 7. RUNX3 drives ARID5B expression and enhancer activity of rs7090445.
mRNA expression quantitation of siRNA knockdown in the lymphoblastoid cell line GM11832. Cells were transfected with one of three RUNX3 siRNAs for 48 h, after which cells were assayed for expression of RUNX3 (a) ARID5B (b) and re-transfected with the high activity T allele of the rs7090445 pGL3 Promoter reporter construct (c). Gene expression data in a,b normalized to the geometric mean of PPIA, TBP, G6PD and LAMIN A/C. Data shown are mean ±s.e.m. from n=4 (a,b), n=3 (c). Asterisk show the P value of a two sided Students t-test (*P<0.05, **P<0.01, ***P<0.001). qRT-PCR expression data were normally distributed.
rs7090445 risk allele is amplified in hyperdiploid B-ALL
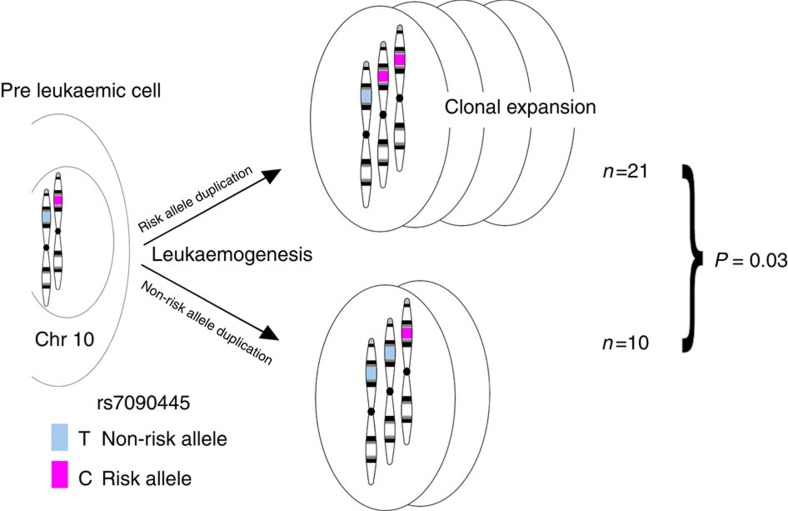
Since, trisomy of chromosome 10 is frequently observed in HD-ALL we sought to determine whether the rs7090445 risk allele, associated with reduced ARID5B expression, is preferentially amplified. To investigate the relationship between heritable risk and somatic mutation in HD-ALL we examined ALL blasts with both chromosome 10 trisomy and heterozygous for rs7090445 (n=31). Of these 21 had duplicated the risk allele (C) and 10 had duplicated the non-risk allele (T) (Binomial test P=0.035, Fig. 8).
Figure 8. The rs7090445 risk allele is preferentially retained in high-hyperdiploid ALL.
The genotype of rs7090445 was interrogated in a series of high-hyperdiploid cases, 31 of which were trisomic for chromosome 10 and heterozygous for rs7090445. P value calculated using a one-sided binomial test.
Discussion
Collectively, our data demonstrate a plausible mechanism underlying the 10q21 risk locus for HD-ALL being mediated through rs7090445, which disrupts RUNX3 transcription factor binding. Our data are compatible with the rs7090445-C allele conferring increased HD-ALL risk through reduced RUNX3-mediated expression of ARID5B. CRISPR/Cas9 genome editing of rs7090445 should provide further support for these assertions, given the limitations of luciferase-based assays. Furthermore, epigenetic and chromosome conformation capture data are consistent with rs7090445 localizing within a chromatin contact domain and overlapping a B-cell enhancer. This interval, anchored by CTCF binding sites, forms a ‘loop domain’ which is expected to bring two regions of RUNX3 binding, separated by a linear distance of around 60Kb, into physical contact close to the TSS of ARID5B.
Here we have provided direct evidence that ARID5B is transcriptionally regulated by RUNX3. ARID5B plays an important role in embryogenesis and growth regulation. ARID5B forms a complex with PHF2 (ref. 23), which has H3K9me2 histone demethylase activity. H3K9me2 is one of the predominant markers of repressed chromatin and as such ARID5B is believed to play a role in epigenetic activation of gene expression. Mouse models with targeted disruption of ARID5B have reduced bone marrow cellularity and B220+/IgM− B-cell progenitor cells populations24. Interestingly ALL blasts lack B220 expression25. RUNX3, a Runt-related transcription factor has also been implicated in the lineage specification of lymphoid cells where RUNX3 knock-out are associated with aberrant differentiation of innate lymphocytes26.
It has been shown that chromosomal gains in HD-ALL often arise prenatally4,5,6. No recurrent fusion gene-forming rearrangements have however been observed in tumours, and analysis of mutations on trisomic chromosomes indicates that chromosomal gains are early events in tumorigenesis, strengthening the notion that the acquisition of high-hyperdiploidy is the main driver event in this common paediatric malignancy27. Moreover sequencing data indicates a latency period after the high-hyperdiploid pattern is established in most patients. Hence the consequence of the chromosomal gains is probably mediated through dosage effects, where additional genetic aberrations are likely to be required for the development of overt leukaemia. We have shown that individuals carrying the rs7090445-C risk allele have reduced ARID5B transcript levels, however chromosome 10, containing ARID5B, is trisomic in around 70% of HD-ALL. We also show that HD-ALL heterozygotes preferentially duplicate the chromosome 10 homologue carrying the rs7090445-C risk allele, potentially allowing increased dosage of chromosome 10 genes relative to ARID5B. The effects of chromosome 10 gain are likely driven by a selective advantage conferred by increased dosage of additional unknown factors unrelated to ARID5B. It is therefore possible that preferential gain of the chromosome 10 homologue carrying the risk allele is due to the conflicting selective forces acting to reduce ARID5B expression, while simultaneously inducing dosage effects associated with trisomy 10.
In conclusion we have shown that in individuals carrying the rs7090445-C risk allele, ARID5B transcript levels are reduced and this provides a mechanistic basis for the 10q21 risk association for HD-ALL. This observation and the finding that the risk allele of rs7090445 is preferentially retained on additional copies of chromosome 10 in HD-ALL blasts are compatible with the hypothesis that inherited genetic variation contributes to decreased ARID5B expression and arrest of normal lymphocyte development facilitating leukaemic clonal expansion.
Methods
Ethics
Collection of GWAS samples and clinicopathological information from subjects was undertaken with informed consent in accordance with the Declaration of Helsinki and with approval of the ethical review board. HD-ALL blast RNA sequencing and genotyping sample collection was approved by the Ethical Review Board at Lund University, no 2011/289. Consent was obtained from all subjects.
Genome-wide association study
The United Kingdom (UK)-GWAS and German-GWAS of B-cell precursor (BCP) ALL have been previously reported11,28. Briefly, the UK GWAS comprised 824 BCP-ALL cases, including 289 with HD-ALL (mean age of diagnosis 5.5 years), genotyped using Illumina Human 317 K arrays (Illumina, San Diego). Controls were provided by the Wellcome Trust Case Control Consortium 2 (http://www.wtccc.org.uk/) of 2,699 individuals in the 1958 British Birth Cohort genotyped using Hap1.2M-Duo Custom array data and 2,501 individuals from the UK Blood Service. The German GWAS comprised 1,155 cases, including 176 with HD-ALL (mean age at diagnosis 6.0 years), genotyped using Illumina Human OmniExpress-12v1.0 arrays. Controls comprised 2,024 healthy individuals from the Heinz Nixdorf Recall study29 genotyped using Illumina HumanOmni1-Quadv1 and HumanOmniExpress-12v1.0 arrays. GWAS quality control (QC) has been described previously28. To recover untyped genotypes we performed imputation using IMPUTE2 v2.3 (ref. 30) with a combined UK10K (ref. 31) and 1000 Genomes Project (phase III)32 panel for reference. Poorly imputed SNPs (INFO score <0.80) were excluded. Frequentist association testing between SNP genotype and HD-ALL was performed using logistic regression under an additive genetic model in SNPTESTv2.5 (ref. 33). Meta-analysis was undertaken under a fixed-effects model using inverse variance weighting in META v1 (ref. 33).
ENCODE and Blueprint chromatin state dynamics
Epigenetic profiles of association signals are composed of chromatin state segmentation (ChromHMM), DNAse I hypersensitivity, transcription factor ChIP-Seq and histone modification data in the lymphoblastoid cell line GM12878 from the ENCODE project14 and in leukaemic blasts from two paediatric precursor B-cell acute lymphoblastic leukaemia cases from the Blueprint project15. The individual data sets used are listed in Supplementary Table 10.
Cell lines
MHH-CALL2, SEM, REH B-ALL and HeLa cell lines were obtained from the DMSZ (Braunschweig, Germany), GM12878 and GM11832 lymphoblastoid cell lines (LCL) were obtained through the Coriell Institute (Camden NJ, US). Cell lines were maintained at 37 °C, with 5% CO2 in either RPMI with 10% FBS (REH, GM12878 and GM11832), 20% FBS RMPI (MHH-CALL2) or 10% DMEM (HeLa) supplemented with GlutaMAX (ThermoFisher Scientific, Waltham, MA, USA). REH BCP-ALL cell line used as a model of ETV6:RUNX1 translocation positive ALL. Cell line identity confirmed by translocation specific PCR primers available on request. HeLa cell line used as a non B-cell control. Cell lines were tested for mycoplasma (PCR Mycoplasma Test Kit I/C, PromoCell, Heidelberg, Germany), no positive results were obtained.
Plasmid construction and luciferase assays
The putative regulatory regions containing rs7090445 and rs7896246 were amplified from genomic DNA from the CEU LCL cell lines NA12004 and NA10851 respectively using primers detailed in Supplementary Table 1. Gel purified PCR-products (Qiagen, Hilden, Germany) were A-tailed using 2U Thermprime DNA polymerase (ThermoFisher Scientific) and 200 μM dATP for 30 min at 70 °C, and cloned into pCR/8/GW/TOPO (ThermoFisher Scientific). Bacterial colonies were picked, cultured and purified using Qiagen Mini-prep Kit. SNP risk alleles were generated using site-directed mutagenesis (Quick Change XL, Agilent). Risk and non-risk variants were transferred into a Gateway compatible pGL3 Promoter vector using Gateway LR Clonase II (ThermoFisher Scientific) and pGL3 constructs purified using Qiagen Midi-prep kits. Inserts and single base changes were verified by Sanger sequencing. Site-directed mutagenesis and sequencing primers are detailed in Supplementary Tables 2 and 3. Cells were transiently transfected by electroporation using a Nucleofector 2B (Lonza, Basel, Switzerland). 4 × 10⁶ MHH-CALL2, 3 × 10⁶ GM11832 and 2 × 10⁶ SEM cells were transfected with 2.5 μg of pGL3 promoter construct and 50 ng of pRL-SV40 (Promega, Madison, WI, United States ), for normalization in 100 μl of Solution V using either program X-01 (MHH-CALL2 and GM11832) or T-02 (SEM). After 16 h promoter activity was assayed using the Dual-Luciferase reporter assay system (Promega) using a Fluoroskan Ascent FL (Labsystems). Six biological replicates each containing 3 technical replicates, were performed for MHH-CALL2 and SEM.
ChIP-seq
Proteins binding rs7896246 and rs7090445 were inferred from Encode ChIP-Seq data (http://hgdownload.cse.ucsc.edu/goldenPath/hg19/encodeDCC/wgEncodeRegTfbsClustered/ wgEncodeRegTfbsClusteredV3). ChIP-seq fastq data for proteins binding to either loci was downloaded from Encode (http://hgdownload.cse.ucsc.edu/goldenPath/hg19/encodeDCC/) and whole genome fastq data for the GM12878 was downloaded from Illumina Platinum Genomes project (AC:ERR194147). Fastq data were aligned to the human reference genome (human_g1k_v37), edited to mask common SNPs in build 141, using Stampy v1.0.28 sequence alignment tool. Allele specificity of ChIP-seq data was assessed using a binomial test of allele specific read counts, assuming an equal distribution. Biological replicates were analysed separately and combined using Fisher’s method.
Electromobility shift assay
Nuclear protein was extracted from GM12878 cells using NE-PER nuclear and cytoplasmic extraction kits (Thermo Fisher Scientific). Fluorescently labelled (DayLight 682 nM) and unlabelled complementary oligonucleotides (Eurofins Genomics) flanking rs7090445 (5′-AACAGCCTAACCTAG GTTAT[T/C]GATAGCTTTGAGACCTTCTG-3′) were annealed to generate double-stranded EMSA probes. Each 20 μl binding reaction contained 50 fmol labelled target DNA, 1 × binding buffer (10 mM Tris, 30 mM KCl, 2 mM DTT, 2.5% glycerol, 0.01 mg ml−1 BSA [pH 7.5], 1 μg polydI-dC [Sigma-Aldrich] and 10 μg nuclear protein extract). Reactions were incubated in the dark for 30 min at room temperature. Competition assays were performed by adding 200-fold molar excess of unlabelled probes. Super-shifts were performed by adding 2 μg RUNX3 antibody (Santa Cruz Biotechnology, sc-376591) to the binding reaction and incubating for 15 min before the addition of labelled probe. DNA-protein complexes were resolved by electrophoresis on a 6% DNA retardation gel (Life Technologies) in 0.5 × Tris-borate-EDTA (TBE) at 4 °C. Gels were imaged using the Odyssey Fc Infrared Imaging System (LI-COR Biosciences). An uncropped EMSA gel image is provided in Supplementary Fig. 9.
ChIP q-RT PCR
ChIP was performed using the Active Motif ChIP-IT Express kit (Active Motif, La Hulpe Belgium), with the modification that after mircococcal nuclease digestion of DNA, cells were sonicated in a Biorupter for 10 min at 4 °C, to aid chromatin release. 25 μg of chromatin was incubated with 1 μg of anti-RUNX3 (Santa Cruz sc-376591) or 1 μg IgG2b (ThermoFisher Scientic, MA5-14447). After washing qRT-PCR was performed using primer sequences detailed in Supplementary Table 6. Three biological replicates were performed using separate chromatin preparations. Interpolated quantities for each target were normalized to an input DNA sample, without antibody pull-down.
Hi-C data analysis
Hi-C data derived from GM12878, digested with MboI, was retrieved from the NCBI (http://www.ncbi.nlm.nih.gov/geo/query/acc.cgi?acc=GSE63525)20. Data from replicates were combined and analysed using a balanced Knight-Ruiz normalization method34, and viewed at 5 kb resolution.
Chromatin confirmation capture
Chromatin confirmation capture (3C) libraries were generated according to Naumova et al.35 A control 3C template was generated using minimally overlapping BAC clones RPCI20I18 (RP11-20I18) and RPCI508P23 (RP11-508P23) (Source Bioscience, Cambridge UK). Taqman reactions were performed in triplicate with four biological replicates using 150 ng of DNA amplified using thermoprime DNA polymerase (ThermoFisher Scientific) and analysed using an ABI7900HT (Applied Biosystems). Raw data signals were normalized to ligated BAC clones and an internal loading control. Primer, probe sequences and cycling conditions are detailed in Supplementary Table 5. PCR-products were verified by Sanger sequencing.
qRT-PCR
qRT-PCR was performed using SYBR Green PCR master mix (ThermoFisher Scientific). Samples were analysed undiluted for ChIP assays or 1/100 diluted in H20 for siRNA assays. Each biological replicate contained three technical replicates. PCR quantitation was by standard curve method. Five-fold serial dilutions of DNA or complementary DNA (cDNA) were used to control for differential primer efficiency. For siRNA assays target gene expression was normalized to the geometric average of PPIA, TBP, G6PD and LAMIN A/C.
siRNA transfection and reverse transcription
GM11832 homozygous for rs7090445 T-allele was transiently transfected by electroporation using 200 nM of siRNA (Eurofins Genomics, Ebersberg, Germany) for 48 h (siRNA sequences detailed in Supplementary Table 4) and then either re-transfected using the T-allele construct of pGL3 and pRL-SV40, or lysed. RNA was prepared using the Qiagen RNAeasy kit. 1–2 μg of RNA was reverse transcribed using MMLV (Promega) and 5 uM dT (ref. 14) per guidelines. Pooled cDNAs diluted 1/20 in H20 were used for standard curve quantitation.
Gene expression in BCP-ALL
mRNA expression data on paediatric B-cell ALL was retrieved from Gene Expression Omnibus accessions GSE13425 (n=154) and GSE13351 (n=92) and RMA-normalized using a custom array definition file from (http://brainarray.mbni.med.umich.edu/Brainarray/Database/CustomCDF/20.0.0/ensg.asp) using the R packages Affy and limma. RNA-seq data from 139 B-cell ALL was quantified using RSEM as described previously22. Spearman correlation coefficient and associated P values were calculated in R version 3.2.2.
SNP array and RNA sequencing
90 cases of HD-ALL were genotyped using either Illumina Human 1M-duo Infinium BeadChip, HumanOmni1-Quad BeadChip or IlluminaOmni5M BeadChips27,36. 45 of the 90 ALL blasts were also RNA sequenced on a HiScanSQ (Illumina, San Diego CA, US) as previously described22. Gene Expression levels were estimated by using TCGA UNC V2 RNA-seq workflow and normalized RNA-Seq by Expectation Maximization (RSEM) values were then log2(x+1) transformed. To control for ploidy effects only cases with chromosome 10 trisomy for were considered for genotype expression correlations and chromosome duplication bias tests.
Data availability
Existing GWAS data is available from the authors upon request13. Existing RNA sequencing in ALL blasts is available from the authors on request22. Existing genotyping data in HD-ALL blasts is available from the authors upon request27. Publically available data used in this study can be found as deposited in the following data sets; DNAse I hypersensitivity data from GM12878: NCBI Gene Expression Omnibus GSE32970, DNAse I hypersensitivity data ALL blasts: European Genome-phenome Archive EGAD00001002499, H3K27ac/H3K4me1/H3K4me3 and H2AZ ChIP sequencing data from GM12878: NCBI Gene Expression Omnibus GSE29611, H3K27ac/H3K4me1/H3K4me3 sequencing data ALL blasts: European Genome-phenome Archive EGAS00001000326, RUNX3 ChIP-seq data from GM12878: NCBI Gene Expression Omnibus GSE32465, GM12878 whole genome sequencing: Illumina Platinum Genomes project AC:ERR194147, ChromHMM in GM12878: NCBI Gene Expression Omnibus GSE38163. Microarray expression data in ALL blasts: NCBI Gene Expression Omnibus GSE13425 and GSE13351. The remaining data within the Article and Supplementary Information files are available from the authors upon request.
Additional information
How to cite this article: Studd, J. B. et al. Genetic and regulatory mechanism of susceptibility to high-hyperdiploid acute lymphoblastic leukaemia at 10q21.2. Nat. Commun. 8, 14616 doi: 10.1038/ncomms14616 (2017).
Publisher’s note: Springer Nature remains neutral with regard to jurisdictional claims in published maps and institutional affiliations.
Supplementary Material
Supplementary Tables, Supplementary Figures, and Supplementary References
Acknowledgments
This work was primarily supported by Bloodwise. Additional funding from Cancer Research UK (C1298/A8362) and the Swedish Childhood Cancer Foundation is also acknowledged. For their contribution to the original identification of the 10q21 risk locus we would also like to acknowledge: Fay J. Hosking, Yussanne Ma and Amy L. Sherborne; The Division of Genetics and Epidemiology, Institute of Cancer Research, Sutton, Surrey, United Kingdom. Bettina Fiege, Rajiv Kumar, Miguel Inacio da Silva Filho, Hauke Thomsen and Kari Hemminki; Division of Molecular Genetic Epidemiology, German Cancer Research Centre, Heidelberg, Germany. Rolf Koehler and Claus R. Bartram; Institute of Human Genetics, University of Heidelberg, Heidelberg, Germany. Julie A. Irving and James M. Allan; Northern Institute for Cancer Research, Newcastle University, Newcastle upon Tyne, United Kingdom. Tracy Lightfoot and Eve Roman; Epidemiology and Cancer Statistics Group, Department of Health Sciences, University of York, York, United Kingdom. Sally E. Kinsey and Eamonn Sheridan; Leeds Institute of Molecular Medicine, University of Leeds, Leeds, United Kingdom. Pamela Thompson; Cancer Immunogenetics Group, School of Cancer Sciences, University of Manchester, St Mary's Hospital, Manchester, United Kingdom. Per Hoffmann, Markus M. Nöthen and Thomas W. Mühleisen; Institute of Human Genetics, University of Bonn, Bonn, Germany. Lewin Eisele; Institute for Medical Informatics, Biometry and Epidemiology, University Hospital Essen, University of Duisburg–Essen, Essen, Germany. Martin Zimmermann and Martin Stanulla; Department of Pediatric Hematology and Oncology, Hannover Medical School, Hannover, Germany. Martin Schrappe; General Pediatrics, University Hospital Schleswig-Holstein, Kiel, Germany. Mel Greaves; Haemato-Oncology Research Unit, Division of Molecular Pathology, Institute of Cancer Research, Sutton, Surrey, United Kingdom.
The authors declare no competing financial interests.
Author contributions J.B.S. and R.S.H. designed the study and drafted the manuscript; J.B.S. performed laboratory analyses; J.B.S., J.V., M.Y., G.M. and K.P. performed bioinformatic and statistical analyses.
05/25/2018
The original version of this Article contained an error in the title, the final paragraph of the Introduction and the first subsection of the Results, where chromosome locus 10q21.2 was incorrectly referred to as 10p21.2. This has now been corrected in both the PDF and HTML versions of the Article.
References
- Inaba H., Greaves M. & Mullighan C. G. Acute lymphoblastic leukaemia. Lancet 381, 1943–1955 (2013). [DOI] [PMC free article] [PubMed] [Google Scholar]
- Paulsson K. & Johansson B. High hyperdiploid childhood Acute lymphoblastic leukemia. Genes. Chromosomes Cancer 48, 637–660 (2009). [DOI] [PubMed] [Google Scholar]
- Forestier E. & Schmiegelow K. The incidence peaks of the childhood acute leukemias reflect specific cytogenetic aberrations. J. Pediatr. Hematol. Oncol. 28, 486–495 (2006). [DOI] [PubMed] [Google Scholar]
- Gruhn B. et al. Prenatal origin of childhood acute lymphoblastic leukemia, association with birth weight and hyperdiploidy. Leuk. Off. J. Leuk. Soc. Am. Leuk. Res. Fund 22, 1692–1697 (2008). [DOI] [PubMed] [Google Scholar]
- Maia A. T. et al. Prenatal origin of hyperdiploid acute lymphoblastic leukemia in identical twins. Leuk. Off. J. Leuk. Soc. Am. Leuk. Res. Fund 17, 2202–2206 (2003). [DOI] [PubMed] [Google Scholar]
- Renate Panzer-Grümayer E. et al. Nondisjunction of chromosomes leading to hyperdiploid childhood B-cell precursor acute lymphoblastic leukemia is an early event during leukemogenesis. Blood 100, 347–349 (2002). [DOI] [PubMed] [Google Scholar]
- Hasle H., Clemmensen I. H. & Mikkelsen M. Risks of leukaemia and solid tumours in individuals with Down’s syndrome. Lancet 355, 165–169 (2000). [DOI] [PubMed] [Google Scholar]
- Morrell D., Cromartie E. & Swift M. Mortality and cancer incidence in 263 patients with ataxia-telangiectasia. J. Natl Cancer Inst. 77, 89–92 (1986). [PubMed] [Google Scholar]
- Levine R. L. Inherited susceptibility to pediatric acute lymphoblastic leukemia. Nat. Genet. 41, 957–958 (2009). [DOI] [PubMed] [Google Scholar]
- Hemminki K. & Jiang Y. Risks among siblings and twins for childhood acute lymphoid leukaemia: results from the Swedish Family-Cancer Database. Leukemia 16, 297–298 (2002). [DOI] [PubMed] [Google Scholar]
- Papaemmanuil E. et al. Loci on 7p12.2, 10q21.2 and 14q11.2 are associated with risk of childhood acute lymphoblastic leukemia. Nat. Genet. 41, 1006–1010 (2009). [DOI] [PMC free article] [PubMed] [Google Scholar]
- Treviño L. R. et al. Germline genomic variants associated with childhood acute lymphoblastic leukemia. Nat. Genet. 41, 1001–1005 (2009). [DOI] [PMC free article] [PubMed] [Google Scholar]
- Vijayakrishnan J. et al. A genome-wide association study identifies risk loci for childhood acute lymphoblastic leukemia at 10q26.13 and 12q23.1. Leukemia doi:10.1038/leu.2016.271 (2016). [DOI] [PMC free article] [PubMed] [Google Scholar]
- Becker P. B. A User’s Guide to the Encyclopedia of DNA Elements (ENCODE). PLoS Biol. 9, e1001046 (2011). [DOI] [PMC free article] [PubMed] [Google Scholar]
- Martens J. H. A. & Stunnenberg H. G. BLUEPRINT: Mapping human blood cell epigenomes. Haematologica 98, 1487–1489 (2013). [DOI] [PMC free article] [PubMed] [Google Scholar]
- Ward L. D. & Kellis M. HaploReg: a resource for exploring chromatin states, conservation, and regulatory motif alterations within sets of genetically linked variants. Nucleic Acids Res. 40, D930–D934 (2012). [DOI] [PMC free article] [PubMed] [Google Scholar]
- Worsley Hunt R. & Wasserman W. W. Non-targeted transcription factors motifs are a systemic component of ChIP-seq datasets. Genome Biol. 15, 412 (2014). [DOI] [PMC free article] [PubMed] [Google Scholar]
- Wang J. et al. Sequence features and chromatin structure around the genomic regions bound by 119 human transcription factors. Genome Res. 22, 1798–1812 (2012). [DOI] [PMC free article] [PubMed] [Google Scholar]
- Lesluyes T., Johnson J., Machanick P. & Bailey T. L. Differential motif enrichment analysis of paired ChIP-seq experiments. BMC Genom. 15, 752 (2014). [DOI] [PMC free article] [PubMed] [Google Scholar]
- Rao S. S. P. et al. A 3D map of the human genome at kilobase resolution reveals principles of chromatin looping. Cell 159, 1665–1680 (2014). [DOI] [PMC free article] [PubMed] [Google Scholar]
- Den Boer M. L. et al. A subtype of childhood acute lymphoblastic leukaemia with poor treatment outcome: a genome-wide classification study. Lancet Oncol. 10, 125–134 (2009). [DOI] [PMC free article] [PubMed] [Google Scholar]
- Lilljebjörn H. et al. Identification of ETV6-RUNX1-like and DUX4-rearranged subtypes in paediatric B-cell precursor acute lymphoblastic leukaemia. Nat. Commun. 7, 11790 (2016). [DOI] [PMC free article] [PubMed] [Google Scholar]
- Baba A. et al. PKA-dependent regulation of the histone lysine demethylase complex PHF2-ARID5B. Nat. Cell Biol. 13, 668–675 (2011). [DOI] [PubMed] [Google Scholar]
- Lahoud M. H. Gene targeting of Desrt, a novel ARID Class DNA-binding protein, causes growth retardation and abnormal development of reproductive organs. Genome Res. 11, 1327–1334 (2001). [DOI] [PubMed] [Google Scholar]
- Rodig S. J., Shahsafaei A., Li B. & Dorfman D. M. The CD45 isoform B220 identifies select subsets of human B cells and B-cell lymphoproliferative disorders. Hum. Pathol. 36, 51–57 (2005). [DOI] [PubMed] [Google Scholar]
- Ebihara T. et al. Runx3 specifies lineage commitment of innate lymphoid cells. Nat. Immunol. 16, 1124–1133 (2015). [DOI] [PMC free article] [PubMed] [Google Scholar]
- Paulsson K. et al. The genomic landscape of high hyperdiploid childhood acute lymphoblastic leukemia. Nat. Genet. 47, 672–677 (2015). [DOI] [PubMed] [Google Scholar]
- Migliorini G. et al. Variation at 10p12.2 and 10p14 influences risk of childhood B-cell acute lymphoblastic leukemia and phenotype. Blood 122, 3298–3307 (2013). [DOI] [PubMed] [Google Scholar]
- Kröger K. et al. Prevalence of peripheral arterial disease–results of the heinz nixdorf recall study. Eur. J. Epidemiol. 21, 279–285 (2006). [DOI] [PubMed] [Google Scholar]
- Howie B. N., Donnelly P. & Marchini J. A flexible and accurate genotype imputation method for the next generation of genome-wide association studies. PLoS Genet. 5, e1000529 (2009). [DOI] [PMC free article] [PubMed] [Google Scholar]
- Walter K. et al. The UK10K project identifies rare variants in health and disease. Nature 526, 82–90 (2015). [DOI] [PMC free article] [PubMed] [Google Scholar]
- Auton A. et al. A global reference for human genetic variation. Nature 526, 68–74 (2015). [DOI] [PMC free article] [PubMed] [Google Scholar]
- Marchini J., Howie B., Myers S., McVean G. & Donnelly P. A new multipoint method for genome-wide association studies by imputation of genotypes. Nat. Genet. 39, 906–913 (2007). [DOI] [PubMed] [Google Scholar]
- Knight P. A. & Ruiz D. A fast algorithm for matrix balancing. IMA J. Numer. Anal. 33, 1029–1047 (2013). [Google Scholar]
- Naumova N., Smith E. M., Zhan Y. & Dekker J. Analysis of long-range chromatin interactions using chromosome conformation capture. Methods 58, 192–203 (2012). [DOI] [PMC free article] [PubMed] [Google Scholar]
- Paulsson K. et al. Genetic landscape of high hyperdiploid childhood acute lymphoblastic leukemia. Proc. Natl Acad. Sci. USA 107, 21719–21724 (2010). [DOI] [PMC free article] [PubMed] [Google Scholar]
- Scales M., Jäger R., Migliorini G., Houlston R. S. & Henrion M. Y. R. VisPIG - A web tool for producing multi-region, multi-track, multi-scale plots of genetic data. PLoS ONE 9, e107497 (2014). [DOI] [PMC free article] [PubMed] [Google Scholar]
Associated Data
This section collects any data citations, data availability statements, or supplementary materials included in this article.
Supplementary Materials
Supplementary Tables, Supplementary Figures, and Supplementary References
Data Availability Statement
Existing GWAS data is available from the authors upon request13. Existing RNA sequencing in ALL blasts is available from the authors on request22. Existing genotyping data in HD-ALL blasts is available from the authors upon request27. Publically available data used in this study can be found as deposited in the following data sets; DNAse I hypersensitivity data from GM12878: NCBI Gene Expression Omnibus GSE32970, DNAse I hypersensitivity data ALL blasts: European Genome-phenome Archive EGAD00001002499, H3K27ac/H3K4me1/H3K4me3 and H2AZ ChIP sequencing data from GM12878: NCBI Gene Expression Omnibus GSE29611, H3K27ac/H3K4me1/H3K4me3 sequencing data ALL blasts: European Genome-phenome Archive EGAS00001000326, RUNX3 ChIP-seq data from GM12878: NCBI Gene Expression Omnibus GSE32465, GM12878 whole genome sequencing: Illumina Platinum Genomes project AC:ERR194147, ChromHMM in GM12878: NCBI Gene Expression Omnibus GSE38163. Microarray expression data in ALL blasts: NCBI Gene Expression Omnibus GSE13425 and GSE13351. The remaining data within the Article and Supplementary Information files are available from the authors upon request.


