Abstract
It is common knowledge that macromolecular crystals are damaged by the X‐rays they are exposed to during conventional data collection. One of the claims made about the crystallographic data collection now being collected using X‐ray free‐electron lasers (XFEL) is that they are unaffected by radiation damage. XFEL data sets are assembled by merging data obtained from a very large number of crystals, each of which is exposed to a single femtosecond pulse of radiation, the duration of which is so short that diffraction occurs before the damage done to the crystal has time to become manifest, i.e. “diffraction‐before‐destruction.” However, recent theoretical studies have shown that many of the elemental electronic processes that ultimately result in the destruction of such crystals occur during a single pulse. It is predicted that the amplitudes of atomic scattering factor could be reduced by as much as 75% within the first 5 femtoseconds of such pulses, and that different atoms will respond in different ways. Experimental evidence is provided here that these predictions are correct.
Keywords: XFEL, cytochrome c oxidase, photosystem II, cytochrome c peroxidase, atomic scattering factors, radiation damage, metalloproteins
Synopsis: Experimental evidence is provided that the single image per crystal technique for the collection of diffraction data made possible by the development of X‐ray free‐electron lasers does not yield data sets that represent the structures of crystals that have not been damaged by radiation.
Introduction
Structural biology community has long been interested in the development of stronger and more intense X‐ray sources to facilitate the collection of data from the weakly diffracting crystals they normally work with.1 The more intense the source, however, the faster these crystals accumulate radiation damage.2, 3, 4 It is widely believed that the “diffraction‐before‐destruction” approach to data collection made possible by X‐ray free‐electron lasers (XFEL) femtosecond pulse bypasses the radiation‐damage problem,5, 6, 7 and this idea has generated a lot of excitement among those interested in proteins that are notoriously sensitive to radiation, for example, photosystem II, cytochrome c oxidase (CcO), cytochrome c peroxidase (CcP), and other peroxidases.8, 9 In fact, it is likely to be the case that all of the effects that comparatively slow, radiation‐induced, chemical processes have on crystals structures can be circumvented using XFEL techniques, but, as is shown below, this does not mean that the structures obtained using data of this sort are identical to those of crystals that have never been exposed to X‐rays.
In the era before the freezing of macromolecular crystals became routine, it was well known that radiation damage could utterly destroy the diffracting power of crystals, and that this could happen alarmingly fast if the X‐ray source used was a synchrotron.10 Often dozens of crystals had to be used to obtain complete data sets (e.g., see Ref. 11). Using frozen crystals, it is often possible to collect entire data sets from single crystals.12 Even so, very few crystals are sufficiently resistant to radiation damage so that the several high‐quality data sets required for multiple‐wavelength anomalous dispersion (MAD) phasing can be collected from a single crystal, which is one of the reasons why single‐wavelength anomalous scattering (SAD) remains the phasing method of choice for many investigators.13
It has long been hoped that the radiation damage that limits the ordinary collection of data from macromolecular crystals could be circumvented using XFEL‐based techniques. The number of X‐ray photons in a single pulse produced by an XFEL is large enough to vaporize any macromolecular material that is exposed to it, but these pulses are so short that most of the destructive chemistry they trigger occurs after the pulse is over. However, it would be a mistake to think that the events that occur during the pulse, which ultimately result in crystal destruction, are invisible crystallographically. Among the many of the electronic processes that occur during such pulses are photoionization, Auger processes, electron‐impact ionizations, electron–electron scattering, three‐body recombination, all of which should have a detectable impact on electron density distributions.14, 15 In fact, a recent computer simulation shows that if the fluency of such a pulse is of the order of 108 photons/Å2, which it often is, the atomic scattering factors of the oxygen atoms in proteins could be reduced by more than 75% at scattering angles near the incident beam direction (i.e., sinθ/λ = 0) within the first 5 fs.16 This simulation also showed that the magnitudes of these radiation‐induced reductions in atomic scattering factors should vary with both atom type and scattering angles in complex ways. Typically, large atoms appear to lose scattering factors much faster than lighter atoms, making them look less conspicuous in the resulting electron‐density maps than they otherwise would be. This study presents direct evidence that all the metal ions in the crystals of oxidized CcO described by the XFEL data set associated with 3WG7 have fewer electrons associated with them than the corresponding metal ions in the structure of the same molecule that is described by 2DYR, the data for which were obtained for the same protein by conventional means (3WG7 and 2DYR are PDB accession numbers).17, 18
Results
The XFEL 3WG7 data were carefully scaled to the data for 2DYR data in two resolution ranges, and the 2DYR model was rerefined (Table 1 and see Methods).17, 18 Following that refinement, isomorphous difference Fourier maps were calculated using the observed differences between the two data sets, Fobs(2DYR)‐Fobs(3WG7). The resulting map was relatively free of noise both because the amplitude differences between the two data sets were small (18.5% for all the data out to a resolution of 1.89 Å), and because the model phases using were reasonably accurate since the model used had a relatively low free R factor (16.8%) (Table 1). Near all the major features in this map can be divided into six groups based on differences in peak amplitudes, and four of them appear to represent alterations in atomic scattering factors. The fifth group belongs to displacements of atoms associated with chemical reactions. In this map, reductions in the magnitudes of atomic scattering factors in the crystals exposed to XFEL radiation (3WG7) will produce positive features, and any chemistry‐based losses of atoms in the conventional radiation (2DYR) will be represented by negative features.
Table 1.
Scaling Statistics Between the 2DYR and 3WG7 Data Sets
| Single‐Crystal/2DYR | XFEL/3WG7 | |
|---|---|---|
| Unit cell (P212121) | ||
| a (Å) | 182.59 | 182.60 ± 0.38 |
| b (Å) | 205.14 | 204.51 ± 0.55 |
| c (Å) | 178.25 | 178.29 ± 0.46 |
| Resolution (Å) | 1.80 Å | 1.90Å |
| Number of crystals | Not available | 76 crystals/1,107 still images |
| Intensity R merge | Not available | 0.243 |
| Number of reflections | 607,319 | 473,986 |
| R work | 0.202 | 0.195 |
| R free | 0.227 | 0.230 |
| Isomorphous differences as a function of scaling procedures | ||
| R iso (all) | 0.202 (Intensity R iso = 0.341) | |
| R iso (4.50–1.89 Å) | 0.183 (Intensity R iso = 0.303) | |
| R iso (140–4.50 Å) | 0.205 (Intensity R iso = 0.394) | |
| R iso (second pass) | 0.185 (Intensity R iso = 0.331) | |
| Statistics for refinement of models for this analysis | ||
| R work | 0.131 | 0.168 |
| R free | 0.168 | 0.218 |
The largest difference feature in this difference Fourier map (−12.6σ) is located in the middle of the catalytic site between the CuB ion and the Fea 3 ion of heme a 3 (Fig. 1). In fact, if the map is contoured at ±6.5σ, there are two negative peaks evident between these two metal ions. The larger of these two peaks suggest that one of the oxygen atoms in the O2 substrate normally bound in the catalytic site of the resting‐state oxidized CcO has been lost in the crystal that were exposed to conventional radiation (2DYR). The second negative feature represents the repositioning of the remaining O atom. This finding is consistent with the results of the original interpretation of these structures.17, 18
Figure 1.
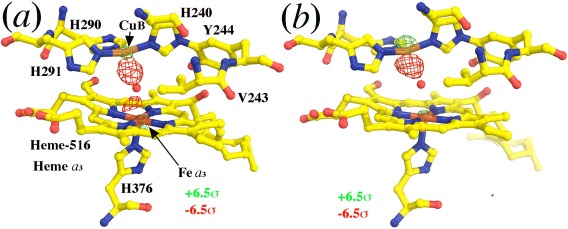
The first class of the largest difference features in F(2DYR)‐F(3WG7) difference Fourier map in the catalytic site. (a, b) Isomorphous difference Fourier maps contoured at ±6.5σ (green and red, respectively) superimposed onto the 2DYR model (yellow) in the two copies of CcO in the structure. Loss of scattering electrons in the XFEL data set results in positive peaks (green features) in this map.
Next to the two negative features in the catalytic site, there are two positive features, one on each metal ion (+8.5σ and +7.5σ) (Fig. 1). They indicate that the atomic scattering factors of both the CuB and Fea 3 metal ions are lower in the 3WG7 structure than they are in the 2DYR structure (Fig. 1). The second and third classes of positive peaks (above 10σ) in the map are on the CuA and Zn atoms, respectively (Fig. 2). These positive peaks superimpose precisely on those metal ions, suggesting again that exposure to XFEL radiation has reduced the atomic scattering factors of all the metal ions present in the enzyme. These features are all evident in both of CcO in the asymmetric unit of these crystals, no matter whether the phases used were obtained from the refined version of 2DYR model used here, or from the original 2DYR model, although peak heights in the latter case were slightly reduced because the resulting isomorphous difference Fourier map was noisier.
Figure 2.
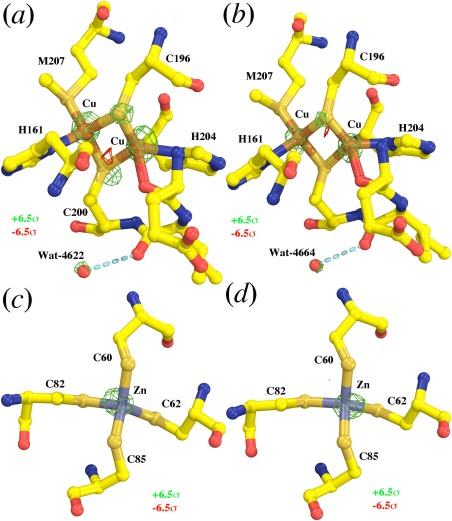
Relative loss of scattering powers of Cu, Zn, and S atoms in the XFEL 3WG7 data set revealed from the F(2DYR)‐F(3WG7) difference Fourier map. (a, b) The first and second copies of CcO molecules in the structure for the di‐copper cluster. (c, d) The first and second copies of CcO molecules in the structure for the Zn‐(Cys)4 motif. The map is contoured at ±6.5σ (green and red) and superimposed onto the 2DYR model.
The fifth largest differences in the map (∼9σ) all involve the S atoms in these crystals, but the situation in this case is more complicated. The effect that conventional synchrotron radiation has on S atoms during data collection is well established.19 S atoms are gradually lost because of chemical reactions, and this effect is evident in the structure derived from the 2DYR data set. However, no chemical reaction could have occurred in the few‐femtoseconds duration it took to collect each component of the XFEL 3WG7 data set. As a consequence, one sees negative features on S atoms (Fig. 3). These features are mainly centered on the S atoms, but sometimes with small displacements due to the fact that the refined S positions in the 2DYR structure are somewhat inaccurate because they represent a mixture of structures with and without S atoms for any given location.
Figure 3.
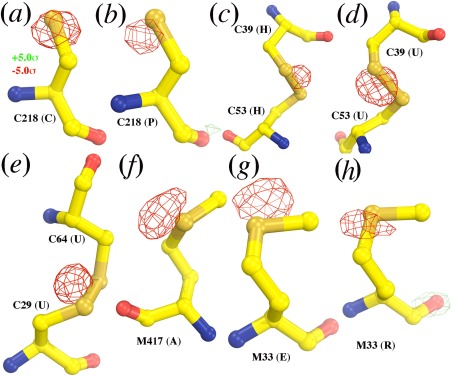
Relative loss of S atoms in the 2DYR data set revealed from the F(2DYR)‐F(3WG7) difference Fourier map. (a, b) Cys218 in the two CcO molecules in the structure. (c, d). Disulfide bonded Cys39/Cys52 in the two CcO molecules. (e) Disulfide bonded Cys29/Cys64 in the second copy of CcO molecule (maps for the corresponding residues in the first copy CcO molecule were too noisy). (f) Met417 for the first copy of the CcO molecule (maps for the second copy were too noisy). (g, h) Met33 in the two CcO molecules. The map is contoured at ±5.0σ (green and red) and superimposed onto the 2DYR model. Subunit identification numbers are included in parenthesis.
The S atoms that are ligands for the CuA ions in the di‐Cu redox center or nonredox Zn2+ ion are exceptional in this regard, possibly because they were protected by their environments from the radiation‐induced hydroxyl free radicals in the crystal that altered the other S atoms in the 2DYR crystals. The availability of electrons in the redox centers may have also protected S atoms from oxygenic free radicals by quenching them. Indeed, the XFEL 3WG7 data set suggests that the atomic scattering factors for S atoms appear to be reduced in the redox centers, although they remain relatively unchanged outside the nonredox centers (Fig. 2). This observation suggests that the crystallographically visible end‐result of the ultrafast electronic processes that occur during XFEL fs pulses may depend on structural environment, and thus that it may not be possible to correct for them by uniformly adjusting atomic structure factors.
Lastly, the decrease in atomic scattering factors evident in the structure obtained from the XFEL 3WG7 data set is not limited to metal ions and S atoms. Nearly all the O atoms in the XFEL 3WG7 data set have systematically lost more electrons on average than the remaining structure, resulting in striking features nearly on every backbone carbonyl O atom at reduced contour levels (Fig. 4). Occasionally, very large positive peaks are clearly visible in the map contoured at +6.5σ for both water molecules Wat‐4622 and Wat‐4644 (Fig. 2). Again, the extent of loss of atomic scattering factors in the XFEL 3WG7 data set for O atoms is highly dependent on their three‐dimensional environments, and is not uniform for all the O atoms in the structure.
Figure 4.
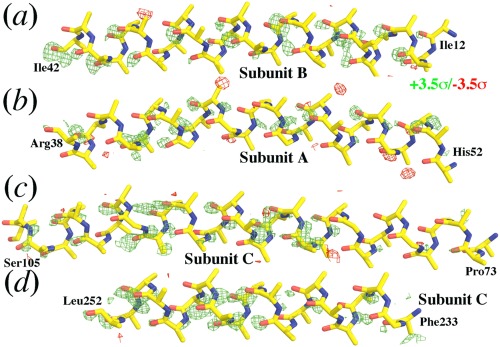
Relative loss of scattering powers of O atoms in the 2DYR data set revealed from the F(2DYR)‐F(3WG7) difference Fourier map. (a–d). These four helices are representatives of all the helices in the structure in which side chains are omitted for clarity. This map is contoured at ±3.5σ (green and red).
Discussion
The data presented above unambiguously demonstrate that crystallographically significant reductions of atomic scattering factors occur in macromolecules that are exposed to femtosecond XFEL pulses, as theoretical studies had predicted.14, 15, 16 This study identified isomorphous difference features produced both by radiation‐induced enzymatic reduction and by radiation‐associated changes of atomic scattering factors. The reduction of atomic scattering factors in the XFEL 3WG7 data set discussed here is very large and on the same order of the magnitude of a complete loss of an O atom in the 2DYR data set (Fig. 1). The reduction in atomic scattering factors documented here has also been observed in the CcP compound I intermediate structure, by comparing the conventionally collected data for the PDB accession number 3M23 and the XFEL data for 5EJX,20, 21 and by doing the same for the PSII resting state using the conventional data for 3ARC and the XFEL data for 4UB8 (data not shown).22, 23
The significant alternations in atomic scattering factors observed here that are caused by exposure to XFEL radiation may for example explain in part why the R factors for the structural models obtained from them are so large. For example, model free R factor was 24.8% for the best myoglobin test structure obtained from a 100‐crystals XFEL data set having a resolution of 1.35 Å (no PDB accession available)24 and it was 26.1% for another XFEL model at 1.50‐Å resolution (5EJX).21 Carefully refined models based on conventionally collected data sets that extend to these resolutions are usually about 10–13%. Another reason for the poor model R‐factors XFEL‐derived structures is that the quality of most such data sets appears to be very poor. For example, an overall intensity R(merge) value reported for the XFEL 3WG7 data set discussed here was 24.3%.18
Concluding Remarks
Without question the development of the XFEL technology is opening up exciting prospects, but the many of the problems associated with it that concerned Henderson a decade ago remain to be resolved.25 The purpose of this study is to highlight one such problem. In this instance it might be useful to use XFEL methods to solve the structures of a number of small molecules, which commonly diffract to sub‐Angstrom resolutions. Structures of this sort could result in an improved understanding of the crystallographic consequences of the processes that occur when X‐ray pulses of that duration and intensity interact with matter.
Methods
The 2DYR and 3WG7 diffraction data were retrieved from the PDB.17, 18 Because the quality of the 2DYR data set was presumed to be better than that of the XFEL 3WG7 data set, the 2DYR data set was chosen as the reference (footnote: Unfortunately, neither the primary publication for 2DRY nor its PDB entry includes a list of precision indexes nor a crystallographic table). Small anisotropic differences in unit‐cell parameters were ignored in this analysis, with the result that the effective resolution of the 3WG7 data set increased slightly from 1.90 to 1.89 Å when the expanded 2DYR unit‐cell parameters were used. In classic isomorphous difference Fourier maps without involving changes of unit cell parameters, the difference the structure of interest minus its reference structure is often used. For example, it would be the XFEL data set minus the conventional data set for this study. If this were done, the map calculated in the fractional coordinate system and then expanded using the unit cell parameters of the XFEL data set would have become non‐interpretable due to different scaling factors during the fractional‐to‐Cartesian coordinate system from the reference structure. This can be circumvented by changing the order of the difference between the two data sets (i.e., the conventional data set minus the XFEL data set as done in this study) or editing the unit cell parameter information stored in the CCP4 binary map and/or data files.
The overall isomorphous amplitude difference obtained when the 3WG7 data set was first anisotropically scaled to the 2DYR data set, using Scaleit in the CCP4 suite,26 and including all the reflections out to 1.89 Å, was 20.2%, which seemed satisfactory (Table 1). However, this scaling resulted in very different Wilson B‐factors for the two data sets because anisotropy‐like property in the 2DYR data set associated with radiation damage dominated the scaling at low resolution, which it should not have done. As a consequence, overall residual‐scaling factors increased rapidly with resolution, up to a factor of 1.5 in the highest resolution shells (Fig. 5). Given this large residual‐scaling factors, an F obs(2DYR)‐F obs(3WG7) difference map was now equivalent to a 1.5 Fobs(2DYR)‐Fobs(3WG7) difference map in the highest resolution ranges, and it proved to be un‐interpretable no matter which model phases were used.
Figure 5.
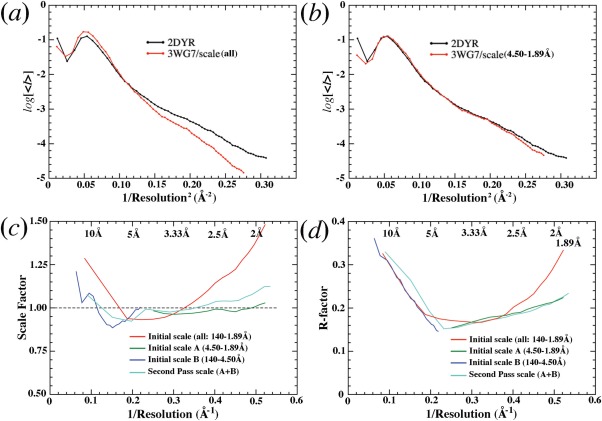
Isomorphous scaling between the 2DYR and 3WG7 data sets. (a) Wilson plots of prescaled data sets using all data. (b) Wilson plots of scaled sets using data between 4.50‐ and 1.89‐Å resolution. (c) Residual scaling factors of prescaled data: initial scale using all the data (red), initial scale A using data between 4.50 and 1.89 Å (green), initial scale B using data between 140 and 4.50 Å (blue), and second pass scale after combining data from scale A and scale B (cyan). (d) Amplitude R‐factors of scaled data using the procedures described in (c).
To resolve the residual‐scaling problem, the data sets were separately scaled in two resolution ranges between 4.5 and 1.89 Å and between 140 and 4.5 Å, and then combined together. After this scaling, the Wilson plots for the two data sets became nearly superimposable, and the residual‐scaling factor is much closer to the unity except at very low‐resolution (Fig. 5). This scaling procedure also reduced the magnitude of the overall amplitude isomorphous difference by 2% (Table 1). These scaled data sets were used for the isomorphous difference studies described here.
Anisotropy analysis and scaling, and the calculation of difference Fourier maps were carried out using the CCP4 suite.26 Models were partially re‐refined using Refmac5 and rebuilt with the graphics program Coot.27, 28 Figures were made using the program Pymol.29
Acknowledgment
The author thanks Professors P. B. Moore for simulating discussion and for editing this manuscript and V. Y. Lunin for insightful suggestions on loss of scattering electrons of O atoms in the XFEL data set.
References
- 1. McSweeney S, Fromme P (2014) Crystallography: sources of inspiration. Nature 505:620–621. [DOI] [PMC free article] [PubMed] [Google Scholar]
- 2. Ravelli RB, Theveneau P, McSweeney S, Caffrey M (2002) Unit‐cell volume change as a metric of radiation damage in crystals of macromolecules. J Synchrotron Radiat 9:355–360. [DOI] [PubMed] [Google Scholar]
- 3. Sliz P, Harrison SC, Rosenbaum G (2003) How does radiation damage in protein crystals depend on X‐ray dose? Structure 11:13–19. [DOI] [PubMed] [Google Scholar]
- 4. Wang J (2016) X‐ray radiation‐induced addition of oxygen atoms to protein residues. Protein Sci. Doi:10.1002/pro.2934 available since April 13, 2016. [DOI] [PMC free article] [PubMed]
- 5. Neutze R, Wouts R, van der Spoel D, Weckert E, Hajdu J (2000) Potential for biomolecular imaging with femtosecond X‐ray pulses. Nature 406:752–757. [DOI] [PubMed] [Google Scholar]
- 6. Chapman HN, Fromme P, Barty A, White TA, Kirian RA, Aquila A, Hunter MS, Schulz J, DePonte DP, Weierstall U, Doak RB, Maia FR, Martin AV, Schlichting I, Lomb L, Coppola N, Shoeman RL, Epp SW, Hartmann R, Rolles D, Rudenko A, Foucar L, Kimmel N, Weidenspointner G, Holl P, Liang M, Barthelmess M, Caleman C, Boutet S, Bogan MJ, Krzywinski J, Bostedt C, Bajt S, Gumprecht L, Rudek B, Erk B, Schmidt C, Homke A, Reich C, Pietschner D, Struder L, Hauser G, Gorke H, Ullrich J, Herrmann S, Schaller G, Schopper F, Soltau H, Kuhnel KU, Messerschmidt M, Bozek JD, Hau‐Riege SP, Frank M, Hampton CY, Sierra RG, Starodub D, Williams GJ, Hajdu J, Timneanu N, Seibert MM, Andreasson J, Rocker A, Jonsson O, Svenda M, Stern S, Nass K, Andritschke R, Schroter CD, Krasniqi F, Bott M, Schmidt KE, Wang X, Grotjohann I, Holton JM, Barends TR, Neutze R, Marchesini S, Fromme R, Schorb S, Rupp D, Adolph M, Gorkhover T, Andersson I, Hirsemann H, Potdevin G, Graafsma H, Nilsson B, Spence JC (2011) Femtosecond X‐ray protein nanocrystallography. Nature 470:73–77. [DOI] [PMC free article] [PubMed] [Google Scholar]
- 7. Emma P, Akre R, Arthur J, Bionta R, Bostedt C, Bozek J, Brachmann A, Bucksbaum P, Coffee R, Decker FJ, Ding Y, Dowell D, Edstrom S, Fisher A, Frisch J, Gilevich S, Hastings J, Hays G, Hering P, Huang Z, Iverson R, Loos H, Messerschmidt M, Miahnahri A, Moeller S, Nuhn HD, Pile G, Ratner D, Rzepiela J, Schultz D, Smith T, Stefan P, Tompkins H, Turner J, Welch J, White W, Wu J, Yocky G, Galayda J (2010) First lasing and operation of an angstrom‐wavelength free‐electron laser. Nat Photon 4:641–647. [Google Scholar]
- 8. Schlichting I (2015) Structural biology: photosynthetic complex in close‐up. Nature 517:26–27. [DOI] [PubMed] [Google Scholar]
- 9. Fromme P (2015) XFELs open a new era in structural chemical biology. Nat Chem Biol 11:895–899. [DOI] [PMC free article] [PubMed] [Google Scholar]
- 10. Sagi I, Weinrich V, Levin I, Glotz C, Laschever M, Melamud M, Franceschi F, Weinstein S, Yonath A (1995) Crystallography of ribosomes: attempts at decorating the ribosomal surface. Biophys Chem 55:31–41. [DOI] [PubMed] [Google Scholar]
- 11. Wang J, Sattar AK, Wang CC, Karam JD, Konigsberg WH, Steitz TA (1997) Crystal structure of a pol alpha family replication DNA polymerase from bacteriophage RB69. Cell 89:1087–1099. [DOI] [PubMed] [Google Scholar]
- 12. Franklin MC, Wang J, Steitz TA (2001) Structure of the replicating complex of a pol alpha family DNA polymerase. Cell 105:657–667. [DOI] [PubMed] [Google Scholar]
- 13. Rose JP, Wang BC (2016) SAD phasing: history, current impact and future opportunities. Arch Biochem Biophys. doi: 10.1016/j.abb.2016.03.018. [DOI] [PubMed]
- 14. Leonov A, Ksenzov D, Benediktovitch A, Feranchuk I, Pietsch U (2014) Time dependence of X‐ray polarizability of a crystal induced by an intense femtosecond X‐ray pulse. IUCrJ 1:402–417. [DOI] [PMC free article] [PubMed] [Google Scholar]
- 15. Stumpf V, Gokhberg K, Cederbaum LS (2016) The role of metal ions in X‐ray‐induced photochemistry. Nat Chem 8:237–241. [DOI] [PubMed] [Google Scholar]
- 16. Lunin VY, Grum‐Grzhimailo AN, Gryzlova EV, Sinitsyn DO, Petrova TE, Lunina NL, Balabaev NK, Tereshkina KB, Stepanov AS, Krupyanskii YF (2015) Efficient calculation of diffracted intensities in the case of nonstationary scattering by biological macromolecules under XFEL pulses. Acta Cryst D71:293–303. [DOI] [PubMed] [Google Scholar]
- 17. Shinzawa‐Itoh K, Aoyama H, Muramoto K, Terada H, Kurauchi T, Tadehara Y, Yamasaki A, Sugimura T, Kurono S, Tsujimoto K, Mizushima T, Yamashita E, Tsukihara T, Yoshikawa S (2007) Structures and physiological roles of 13 integral lipids of bovine heart cytochrome c oxidase. Embo J 26:1713–1725. [DOI] [PMC free article] [PubMed] [Google Scholar]
- 18. Hirata K, Shinzawa‐Itoh K, Yano N, Takemura S, Kato K, Hatanaka M, Muramoto K, Kawahara T, Tsukihara T, Yamashita E, Tono K, Ueno G, Hikima T, Murakami H, Inubushi Y, Yabashi M, Ishikawa T, Yamamoto M, Ogura T, Sugimoto H, Shen JR, Yoshikawa S, Ago H (2014) Determination of damage‐free crystal structure of an X‐ray‐sensitive protein using an XFEL. Nat Methods 11:734–736. [DOI] [PubMed] [Google Scholar]
- 19. Leiros HK, Timmins J, Ravelli RB, McSweeney SM (2006) Is radiation damage dependent on the dose rate used during macromolecular crystallography data collection? Acta Cryst D 62:125–132. [DOI] [PubMed] [Google Scholar]
- 20. Meharenna YT, Doukov T, Li H, Soltis SM, Poulos TL (2010) Crystallographic and single‐crystal spectral analysis of the peroxidase ferryl intermediate. Biochemistry 49:2984–2986. [DOI] [PMC free article] [PubMed] [Google Scholar]
- 21. Chreifi G, Baxter EL, Doukov T, Cohen AE, McPhillips SE, Song J, Meharenna YT, Soltis SM, Poulos TL (2016) Crystal structure of the pristine peroxidase ferryl center and its relevance to proton‐coupled electron transfer. Proc Natl Acad Sci USA 113:1226–1231. [DOI] [PMC free article] [PubMed] [Google Scholar]
- 22. Umena Y, Kawakami K, Shen JR, Kamiya N (2011) Crystal structure of oxygen‐evolving photosystem II at a resolution of 1.9 A. Nature 473:55–60. [DOI] [PubMed] [Google Scholar]
- 23. Suga M, Akita F, Hirata K, Ueno G, Murakami H, Nakajima Y, Shimizu T, Yamashita K, Yamamoto M, Ago H, Shen JR (2015) Native structure of photosystem II at 1.95 A resolution viewed by femtosecond X‐ray pulses. Nature 517:99–103. [DOI] [PubMed] [Google Scholar]
- 24. Uervirojnangkoorn M, Zeldin OB, Lyubimov AY, Hattne J, Brewster AS, Sauter NK, Brunger AT, Weis WI (2015) Enabling X‐ray free electron laser crystallography for challenging biological systems from a limited number of crystals. Elife 4. doi: 10.7554/eLife.05421. [DOI] [PMC free article] [PubMed] [Google Scholar]
- 25. Henderson R (2002) Excitement over X‐ray lasers is excessive. Nature 415:833. [DOI] [PubMed] [Google Scholar]
- 26. Winn MD, Ballard CC, Cowtan KD, Dodson EJ, Emsley P, Evans PR, Keegan RM, Krissinel EB, Leslie AG, McCoy A, McNicholas SJ, Murshudov GN, Pannu NS, Potterton EA, Powell HR, Read RJ, Vagin A, Wilson KS (2011) Overview of the CCP4 suite and current developments. Acta Cryst D 67:235–242. [DOI] [PMC free article] [PubMed] [Google Scholar]
- 27. Murshudov GN, Vagin AA, Dodson EJ (1997) Refinement of macromolecular structures by the maximum‐likelihood method. Acta Cryst D 53:240–255. [DOI] [PubMed] [Google Scholar]
- 28. Emsley P, Cowtan K (2004) Coot: model‐building tools for molecular graphics. Acta Cryst D 60:2126–2132. [DOI] [PubMed] [Google Scholar]
- 29. The PyMOL Molecular Graphics System : 2002. https://www.pymol.org/.


